Municipals Rallied Last Week with Treasuries
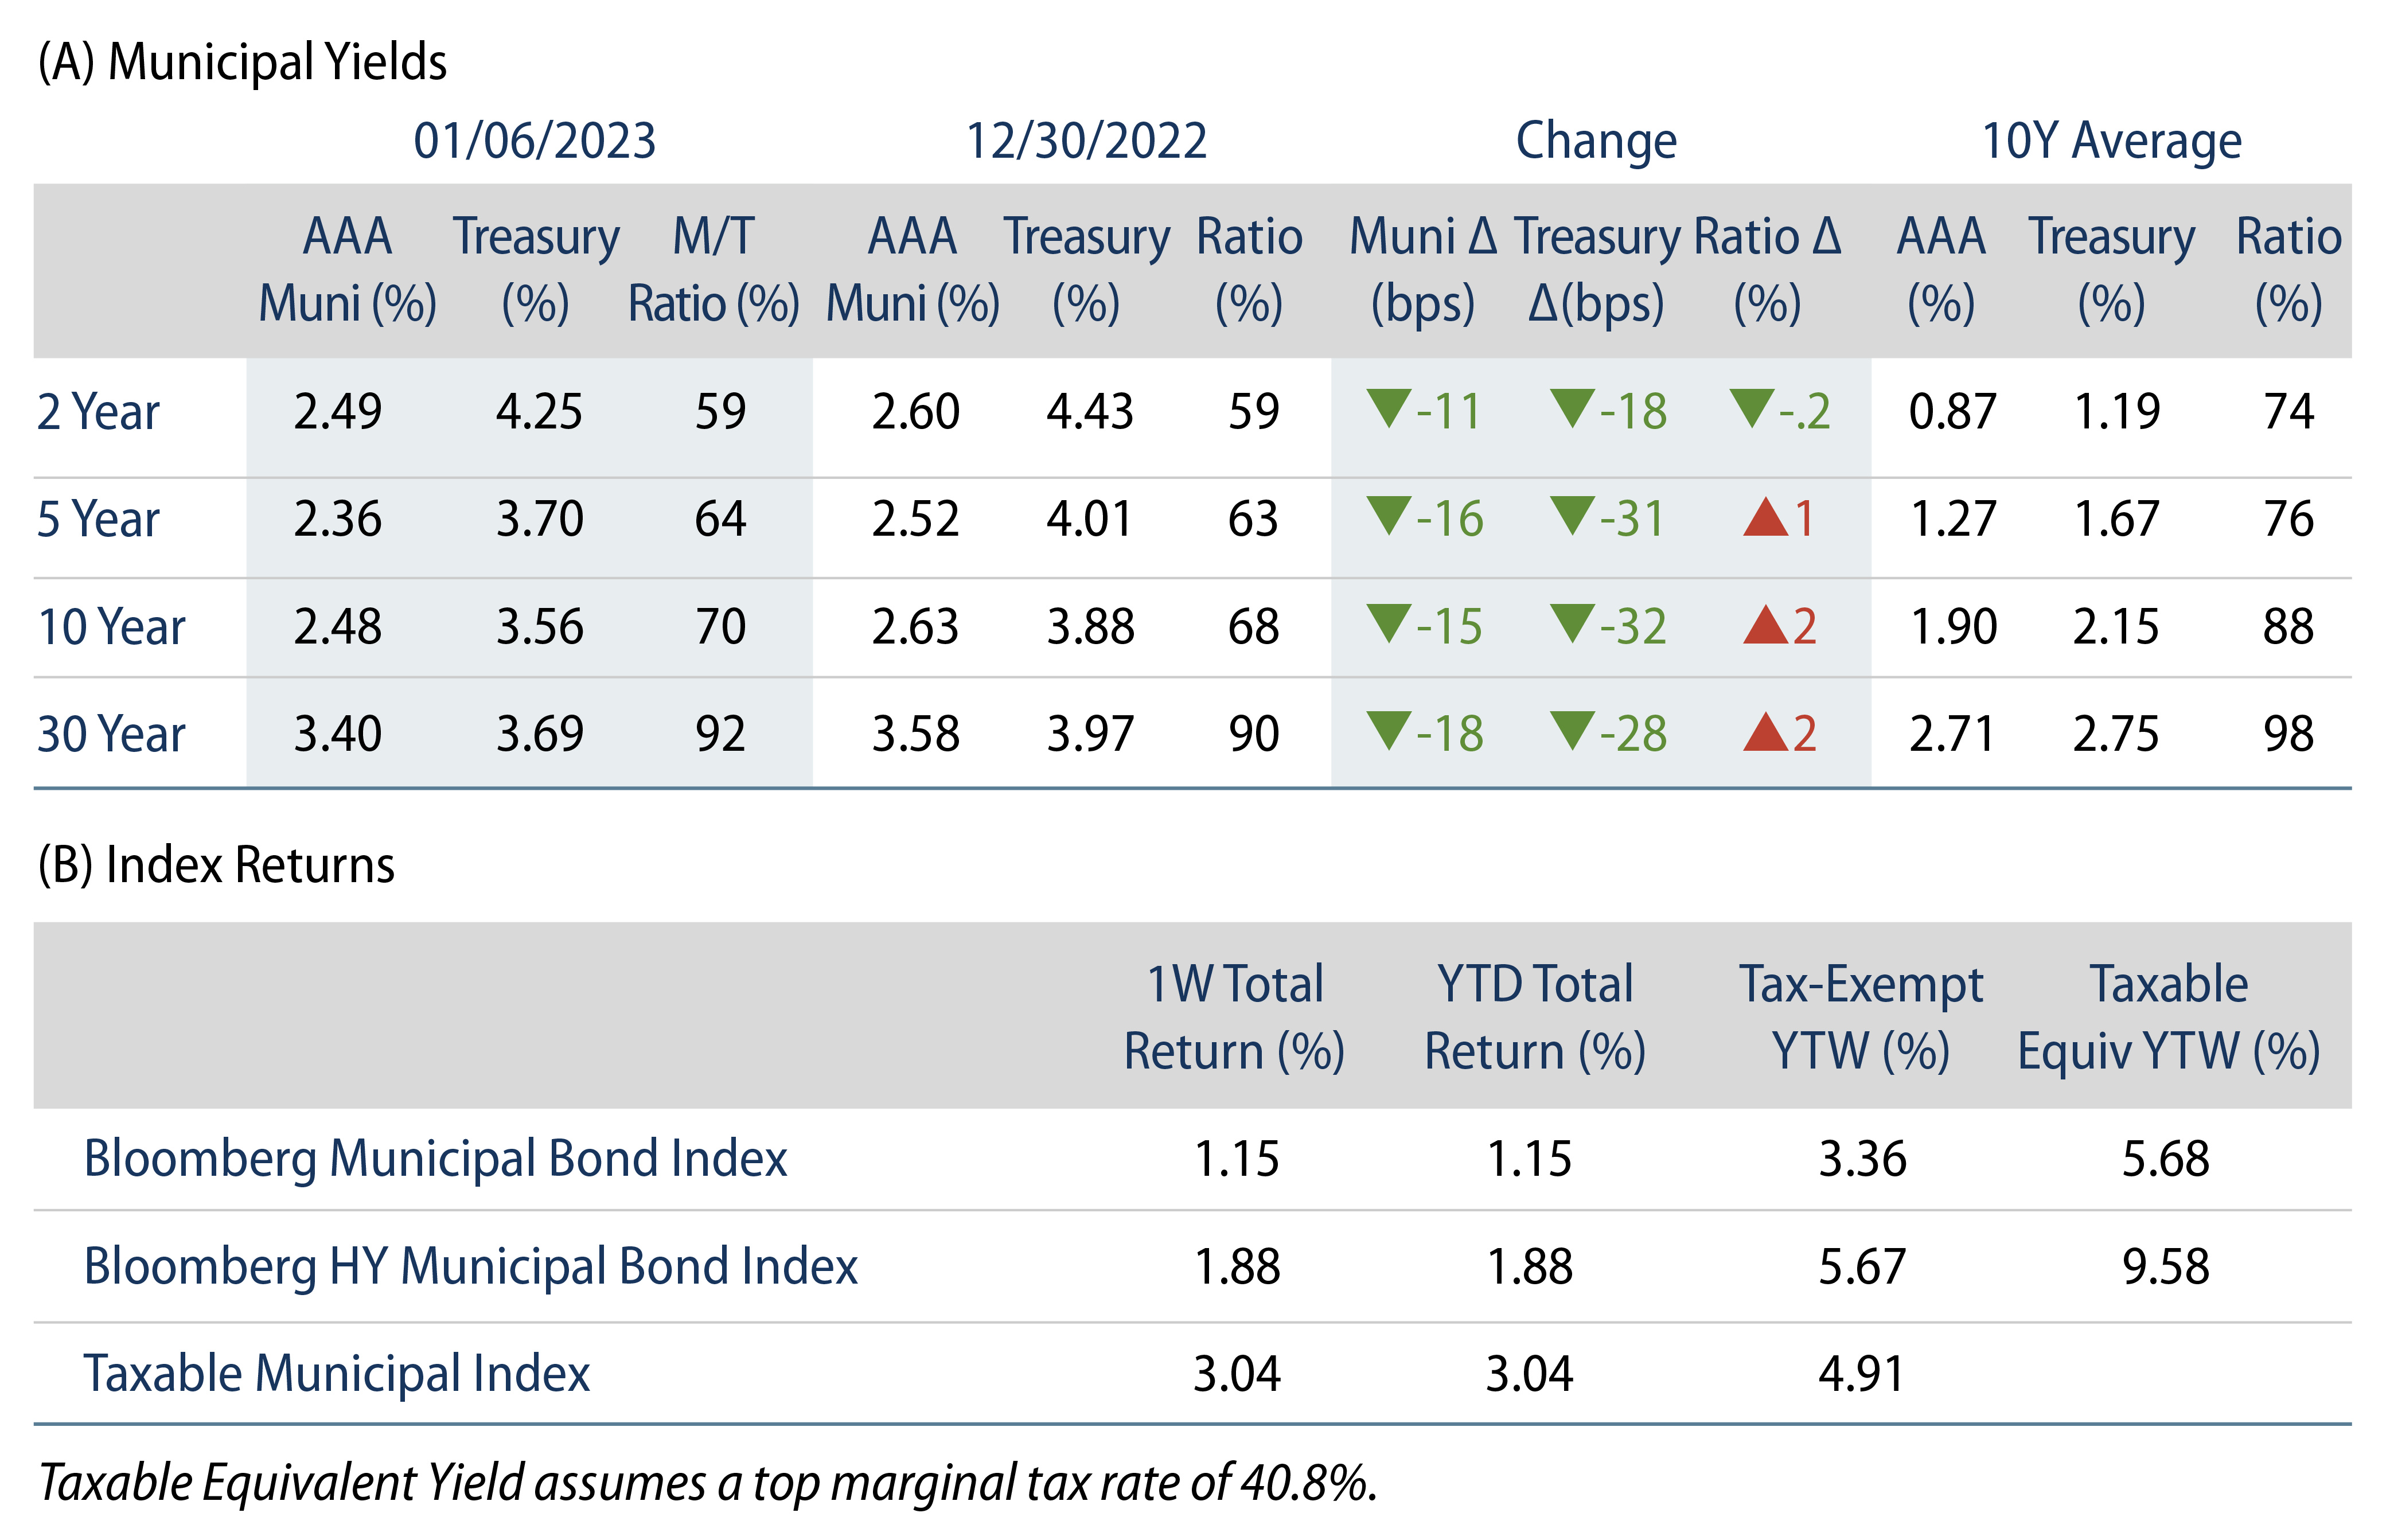
Municipals posted strong returns during the first week of the year, as high-grade municipal yields declined 11-18 bps across the curve, trailing Treasuries lower. The US payrolls report suggested continued strong growth in jobs and favorable employment conditions, but slower than expected wage growth delivered markets another indicator that inflation could be easing. Meanwhile, municipal mutual funds extended their outflow streak. The Bloomberg Municipal Index returned 1.15%, the HY Muni Index returned 1.88% and the Taxable Muni Index returned 3.04%. This week we provide a muni market outlook for 2023.
Municipal Mutual Funds Extend Outflow Cycle in First Week of the Year
Fund Flows: During the week ending January 4, weekly reporting municipal mutual funds recorded $2.5 billion of net outflows, according to Lipper. Long-term funds recorded $1.8 million of outflows, high-yield funds recorded $765 million of outflows and intermediate funds recorded $456 million of outflows. We believe this week’s elevated level of outflows was at least partially driven by end-of-year tax selling.
Supply: The muni market recorded just $1 billion of new-issue volume the first week of the year, comprised mostly of tax-exempt issuance. Following a year of lower total issuance in 2022, we enter January with the expectation that the “January Effect” of seasonally low total issuance combined with elevated coupon reinvestment will be supportive of market technicals this month.
Performance
Negative returns across fixed-income last year were characterized by elevated inflation, the Federal Reserve’s (Fed) aggressive hiking cycle, and overall uncertainty around the future path of inflation and the policy response.
Entering 2023, the key drivers of upside inflation surprises in 2022 (housing, energy and auto prices) have demonstrated clear signs of slowing following aggressive Fed measures. We expect that these trends will reduce the probability that inflation continues to surprise to the upside, and that the Fed will be less aggressive in increasing rates. In turn, we would anticipate lower interest-rate volatility to support fixed-income and municipal market sentiment.
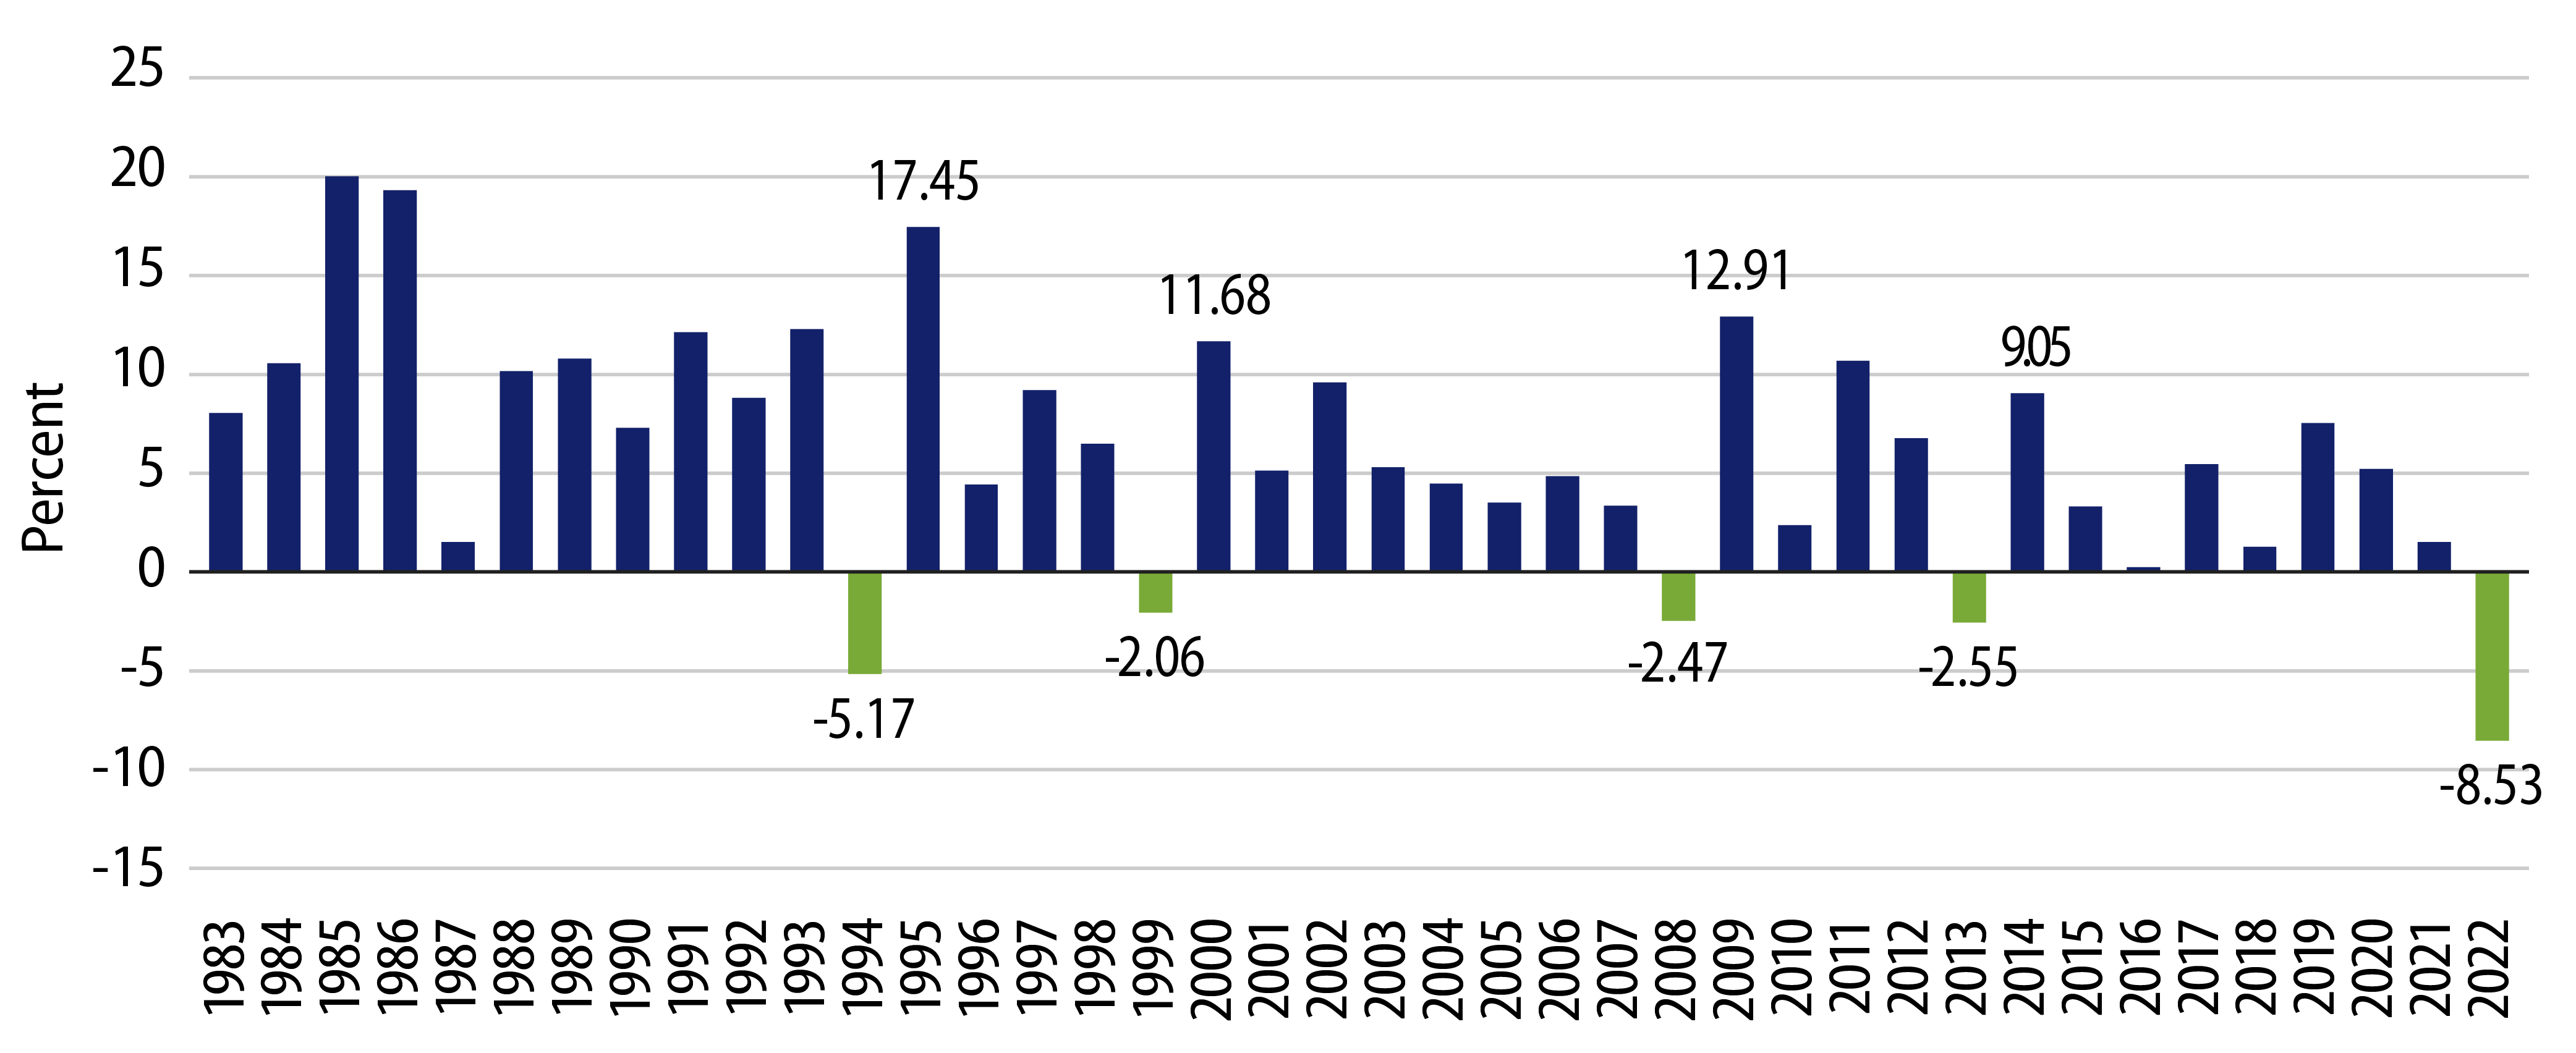
Over the past 40 years, the Bloomberg Municipal Bond Index never had two consecutive years of negative returns. Following the four years of negative returns prior to this current period (1994, 1998, 2008 and 2013), the subsequent-year return averaged 12.78%. While such a return figure is likely optimistic considering the relatively lower starting nominal yield we see at present, we anticipate that favorable technicals and fundamentals could support above-average returns in 2023.
Technicals
Muni Demand:
- Entering the year on the heels of the largest outflow cycle in the muni market’s history (-$125 billion through January 4, 2023), Western Asset expects substantial demand to return to the asset class this year. We attribute the negative demand observed last year to relatively rich valuations, elevated rate volatility and tax-loss selling later in the year. As we enter 2023 with attractive relative valuations and the expectation for lower rate volatility, we expect investors to re-enter the asset class.
- Historically, sizeable inflow cycles have followed large outflow cycles. Considering the continued industry trend to managed assets, along with the large scope of the current outflow cycle, we anticipate over $50 billion of net inflows could come back to muni mutual funds in 2023.

Muni Supply:
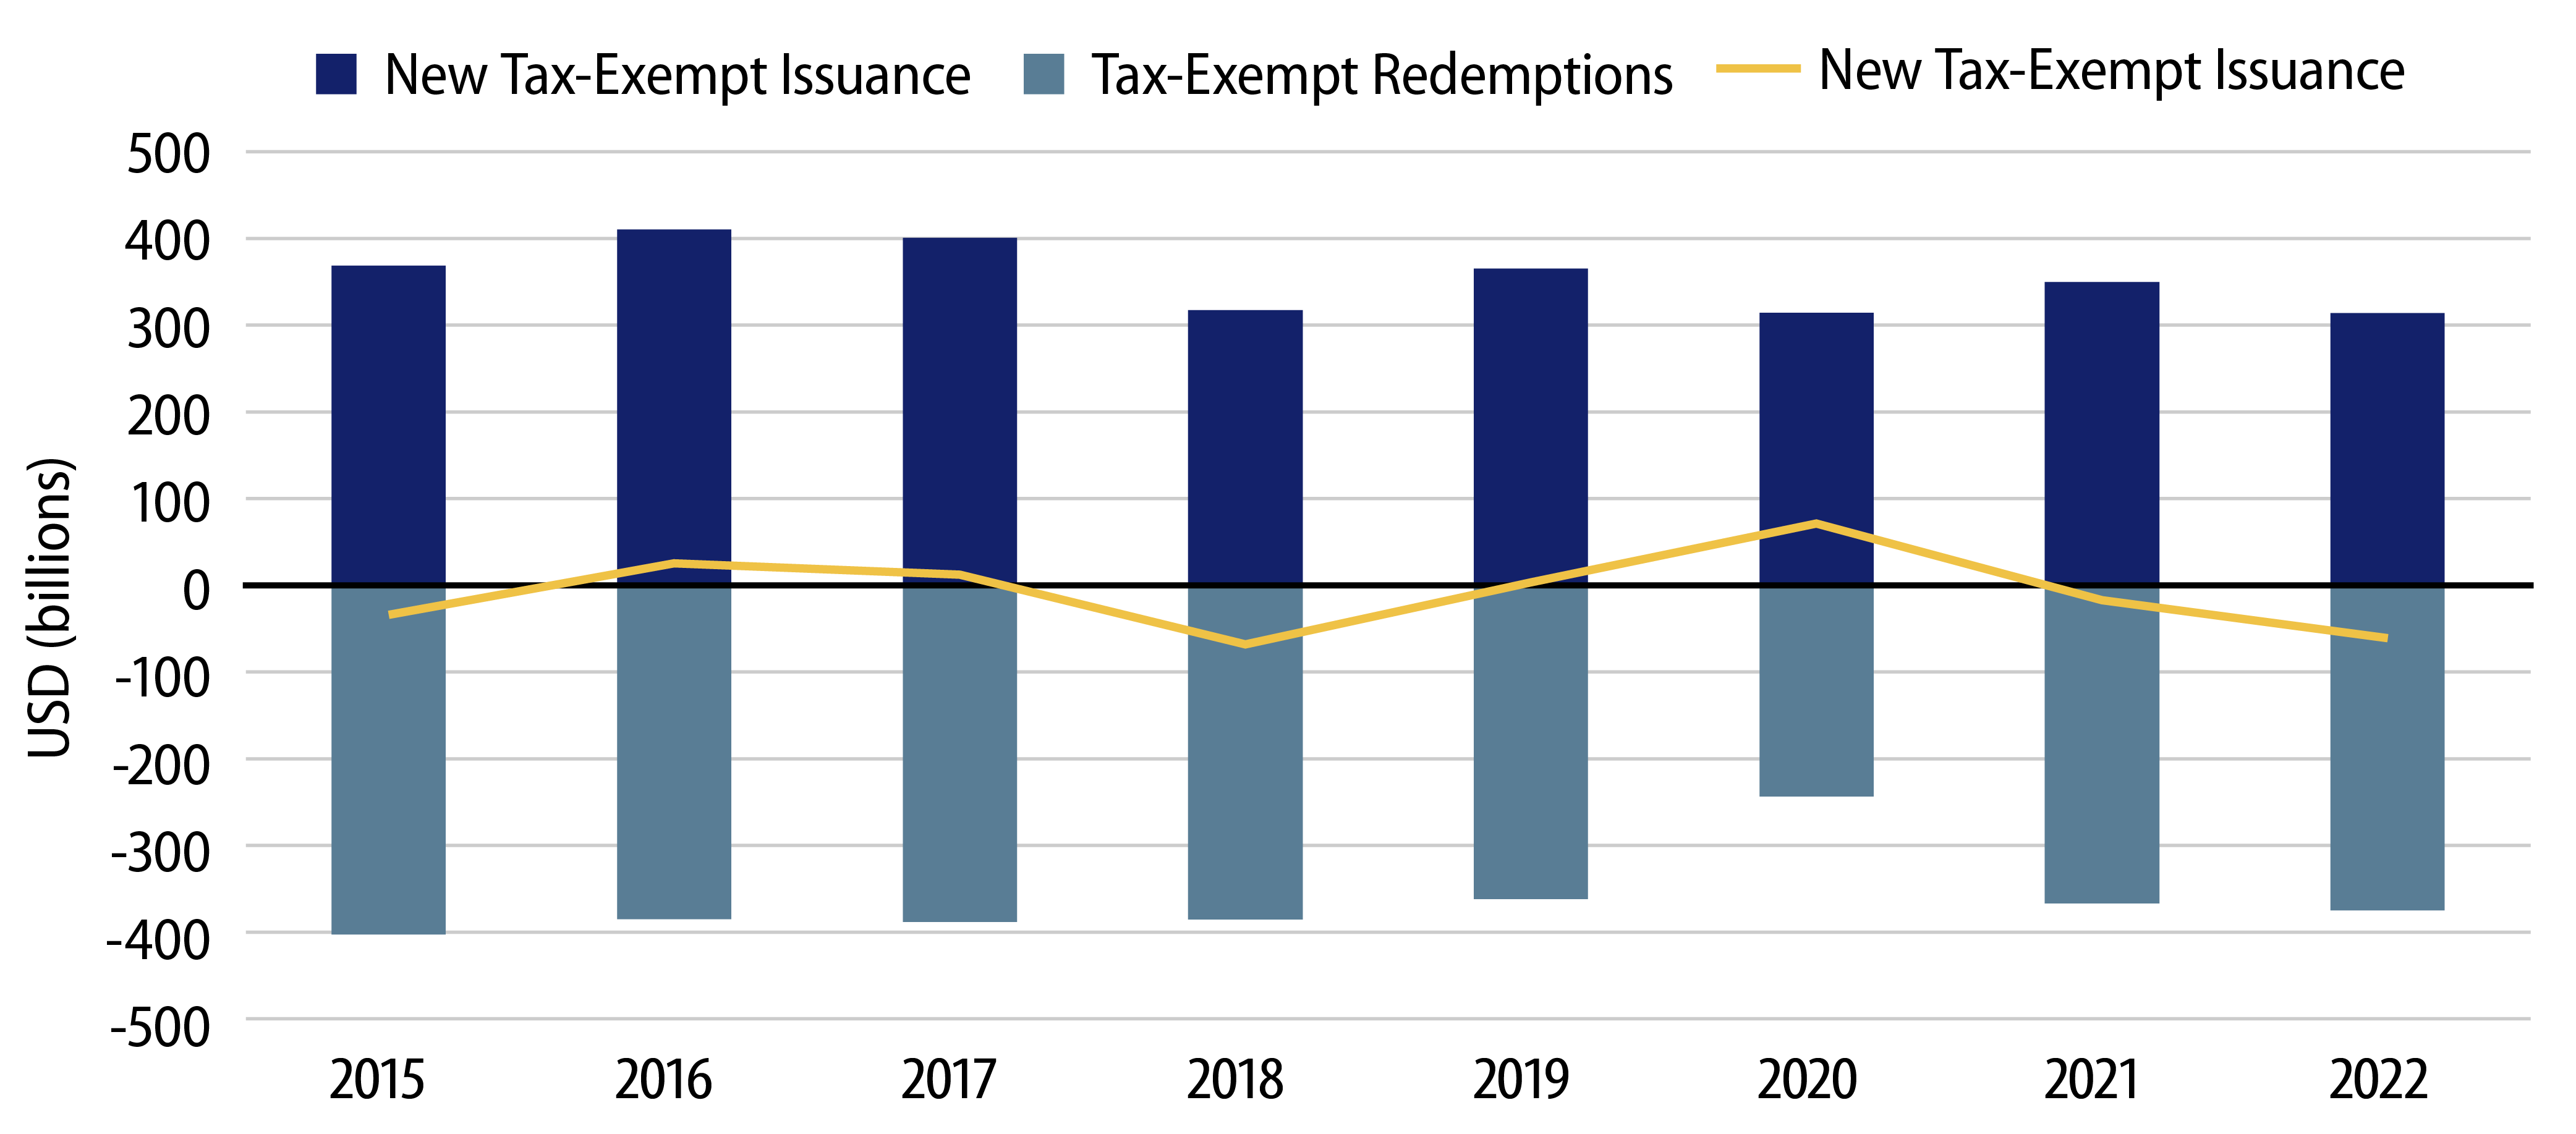
- Over the past decade we observed low to negative net supply in the muni market as state and local governments addressed fiscal challenges that emanated from the global financial crisis, including increased funding to pension systems. In addition, the 2017 Tax Cuts and Jobs Act eliminated tax-exempt advanced refunding, a key component of new tax-exempt issuance that also comprised up to 30% of total issuance a decade ago.
- Considering relatively higher borrowing costs, a lack of tax-exempt advanced refunding, and no significant additional federal incentives to stoke new issuance, we anticipate new-issue supply to remain in line with 2022 levels of $373 billion. Considering potential refundings and maturities, this would likely contribute to a low-to-negative net new-issue supply environment and support muni technicals as we have observed in the past two years.
Fundamentals
State and local governments finished fiscal-year 2022 (ending June 30, for most) with strong tax revenue collections, supported by strong labor and real estate markets. The Census reported state and local revenue collections in the four quarter through June 2022 increased 11% to $2.0 trillion, which we expect will be reflected in upcoming audited financials. The Census also reported continued revenue growth in 3Q22 (the first quarter of fiscal-year 2023), highlighting quarterly state and local tax collections grew by 7.4% year-over-year from 3Q21 to $500 billion.
In 2023, we anticipate the effects of the robust federal support to the US economy to wane, and that slower wage growth and home price appreciation could contribute to slower revenue growth. While a deep recession is not in our base case, state and local governments are well-equipped to manage through an economic downturn or slowdown. In addition to monopolistic pricing power and robust budgetary flexibility, we have observed most municipalities increased rainy day funds to near record highs.
Western Asset is more cautious on sectors that are acutely impacted by inflation and labor shortages which could further pressure budgets, particularly in high-yield issuers. Overall, we expect defaults to remain low and isolated to select high-yield sectors.