マーケット・ブログ
MARKETS
06 February 2024

Weekly Municipal Monitor—Active Management Often Outperforms

By Sam Weitzman, Connor O'Malley, CFA

Municipals Posted Positive Returns Last Week

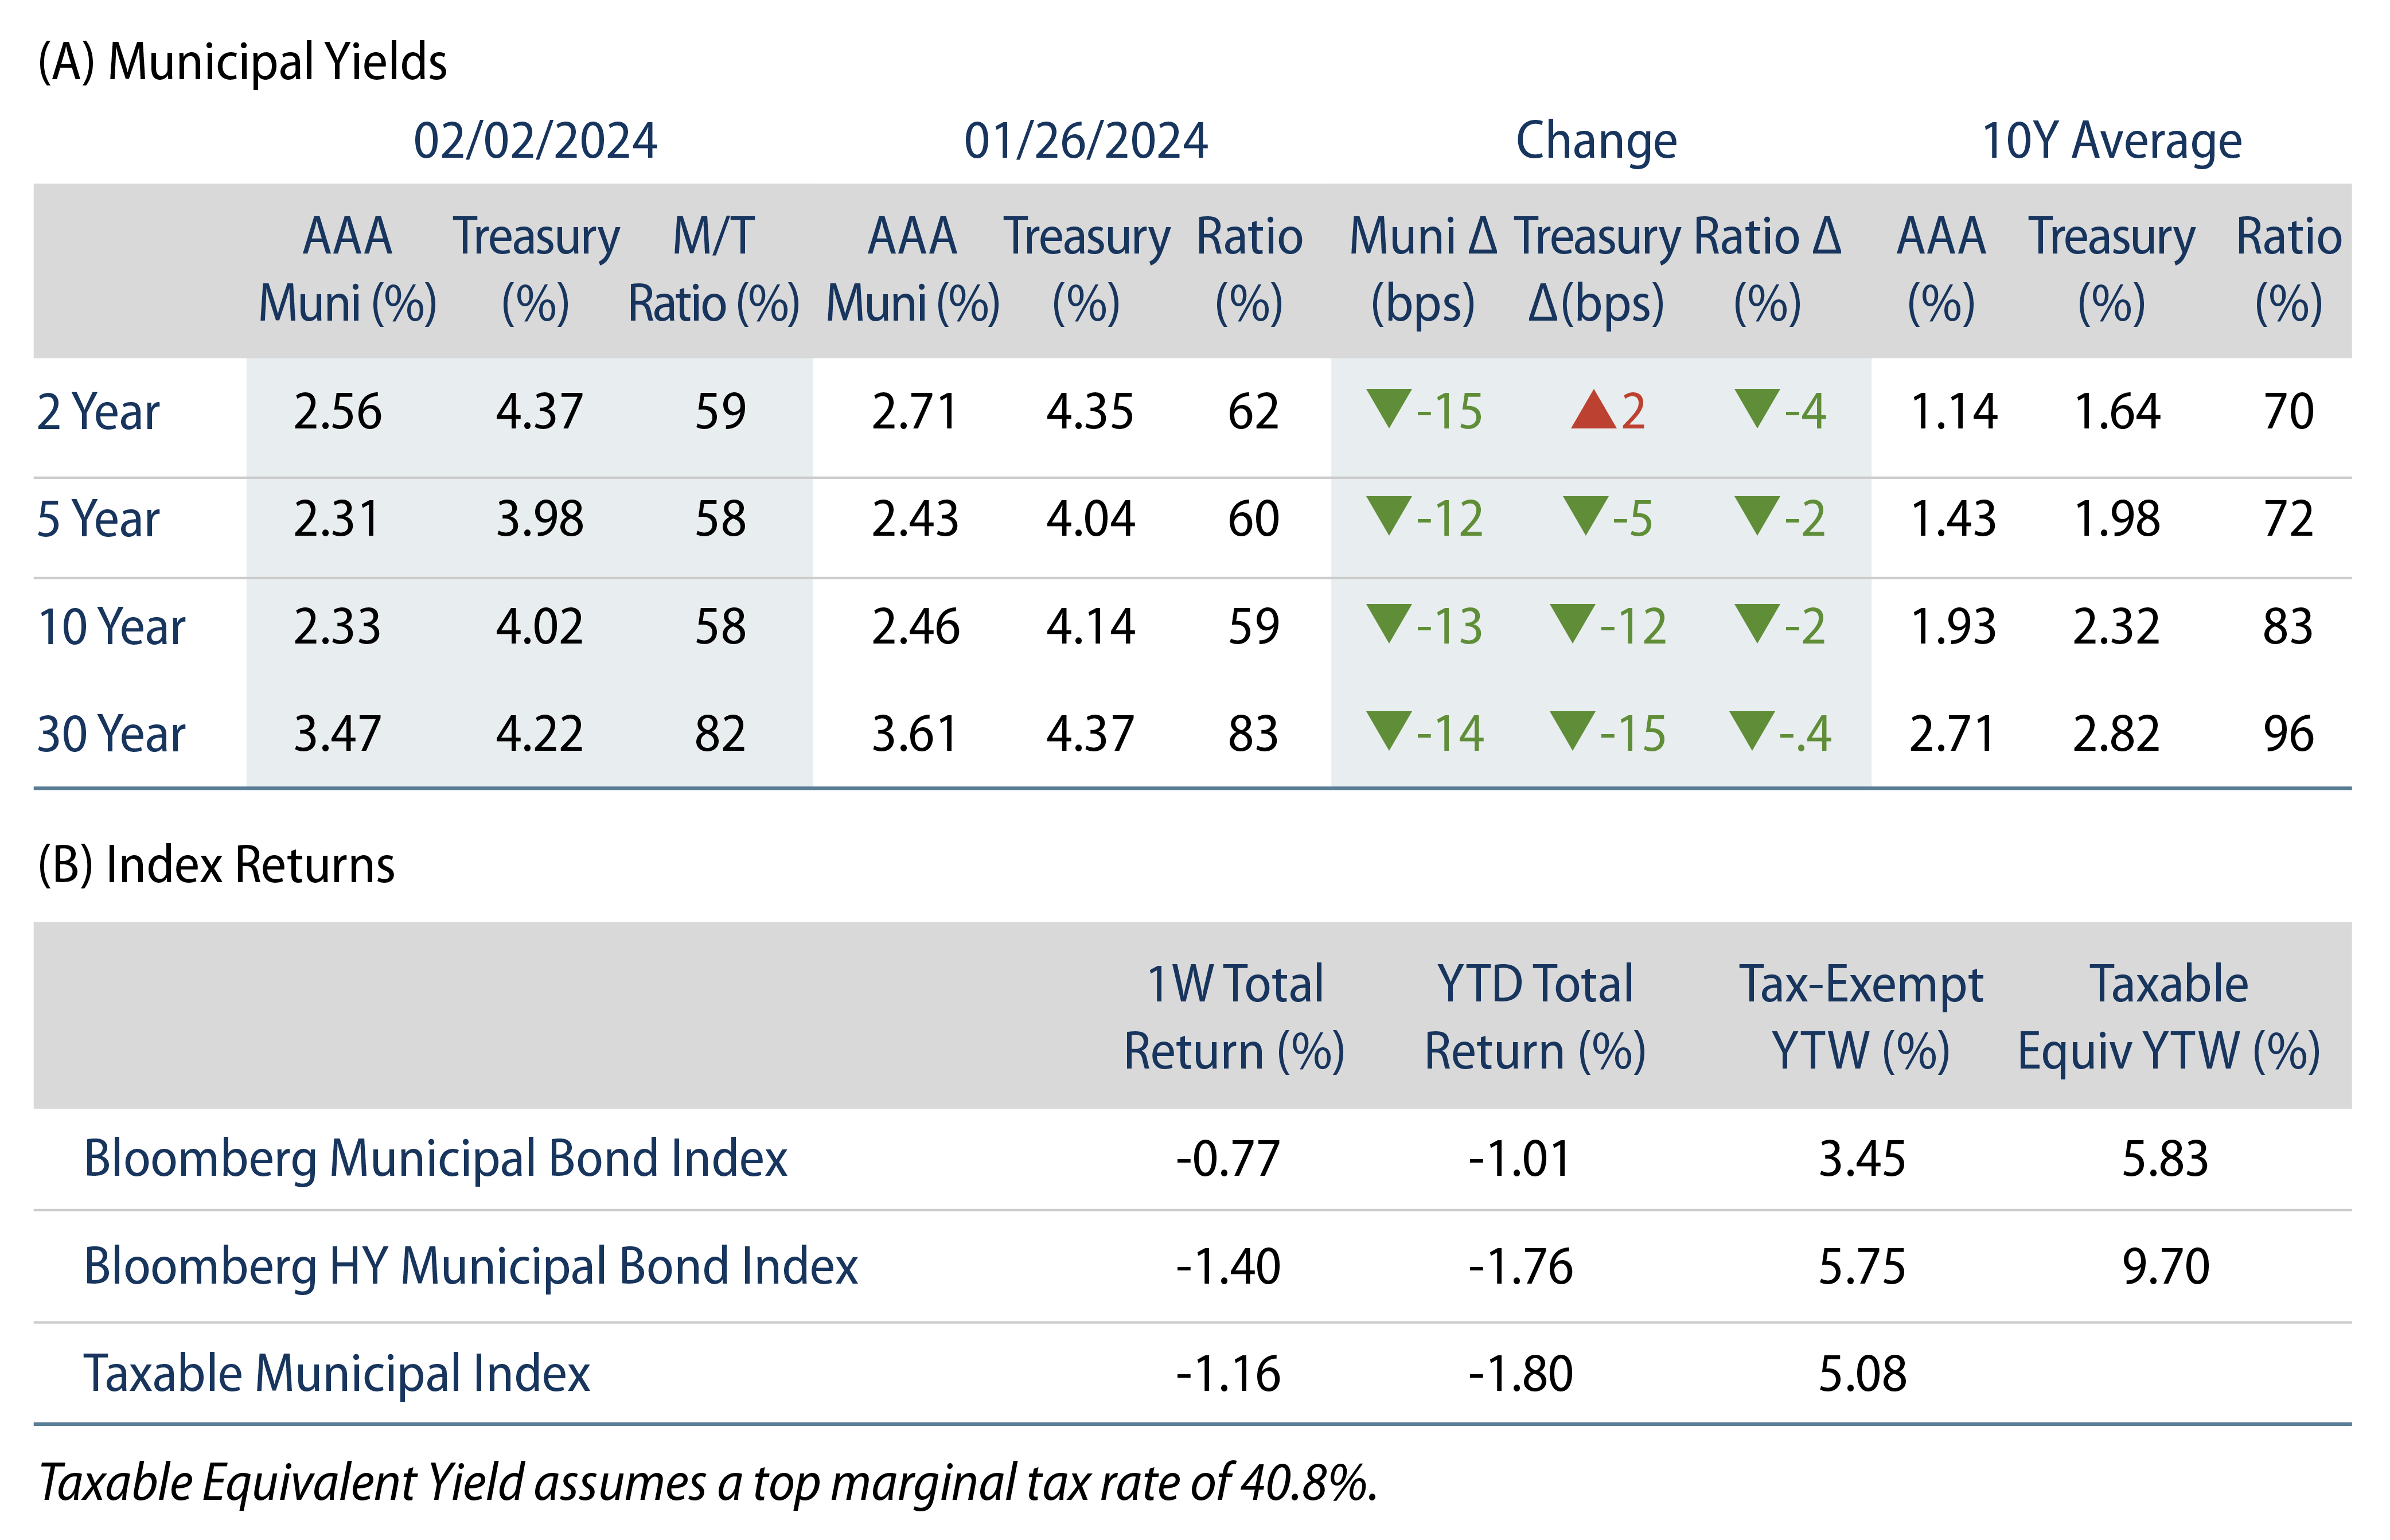
Munis posted positive returns and outperformed Treasuries last week, as yields moved lower despite a stronger-than-expected payrolls report. Market technicals improved with municipal mutual funds recording inflows amid lighter supply conditions. The Bloomberg Municipal Index returned 0.94% during the week, the High Yield Muni Index returned 1.57% and the Taxable Muni Index returned 1.34%. This week we highlight active versus passive muni fund performance and the structural benefit of active management within the muni market.

Muni Technicals Strengthened on Lower Supply, Fund Inflows

Fund Flows: During the week ending January 31, weekly reporting municipal mutual funds recorded $1.5 billion of net inflows, according to Lipper. Long-term funds recorded $1.5 billion of inflows, high-yield funds recorded $626 million of inflows and intermediate funds recorded $95 million of inflows. Short-term funds posted outflows of $25 million. This week marks the fourth consecutive week of inflows and led year-to-date (YTD) net mutual fund inflows higher to $2 billion.

Supply: The muni market recorded $6 billion of new-issue volume last week, down 35% from the prior week. YTD issuance of $35 billion is 50% higher from last year’s level, with tax-exempt issuance up 58% and taxable issuance up 16% year-over year. This week’s calendar is expected increase to $8 billion. The largest deals include $1 billion New York Transition Finance Authority and $540 million Commonwealth of Massachusetts transactions.

This Week in Munis: Active Management Often Outperforms

Low absolute yields over the past decade have heightened the allure of passive municipal mutual funds. From 2013-2023, passive muni mutual funds garnered $103 billion of inflows or nearly nine times starting 2013 AUM levels, according to Morningstar. Over the same period, active municipal funds collected a comparable $105 billion of net inflows, though representing just 18% of 10-year growth.

Exhibit 1: Morningstar Intermediate Muni Category—Active vs. Passive Total Return
Morningstar Intermediate Muni Category—Active vs. Passive Total Return
Source: Bloomberg, Western Asset. As of 31 Dec 23. Select the image to expand the view.

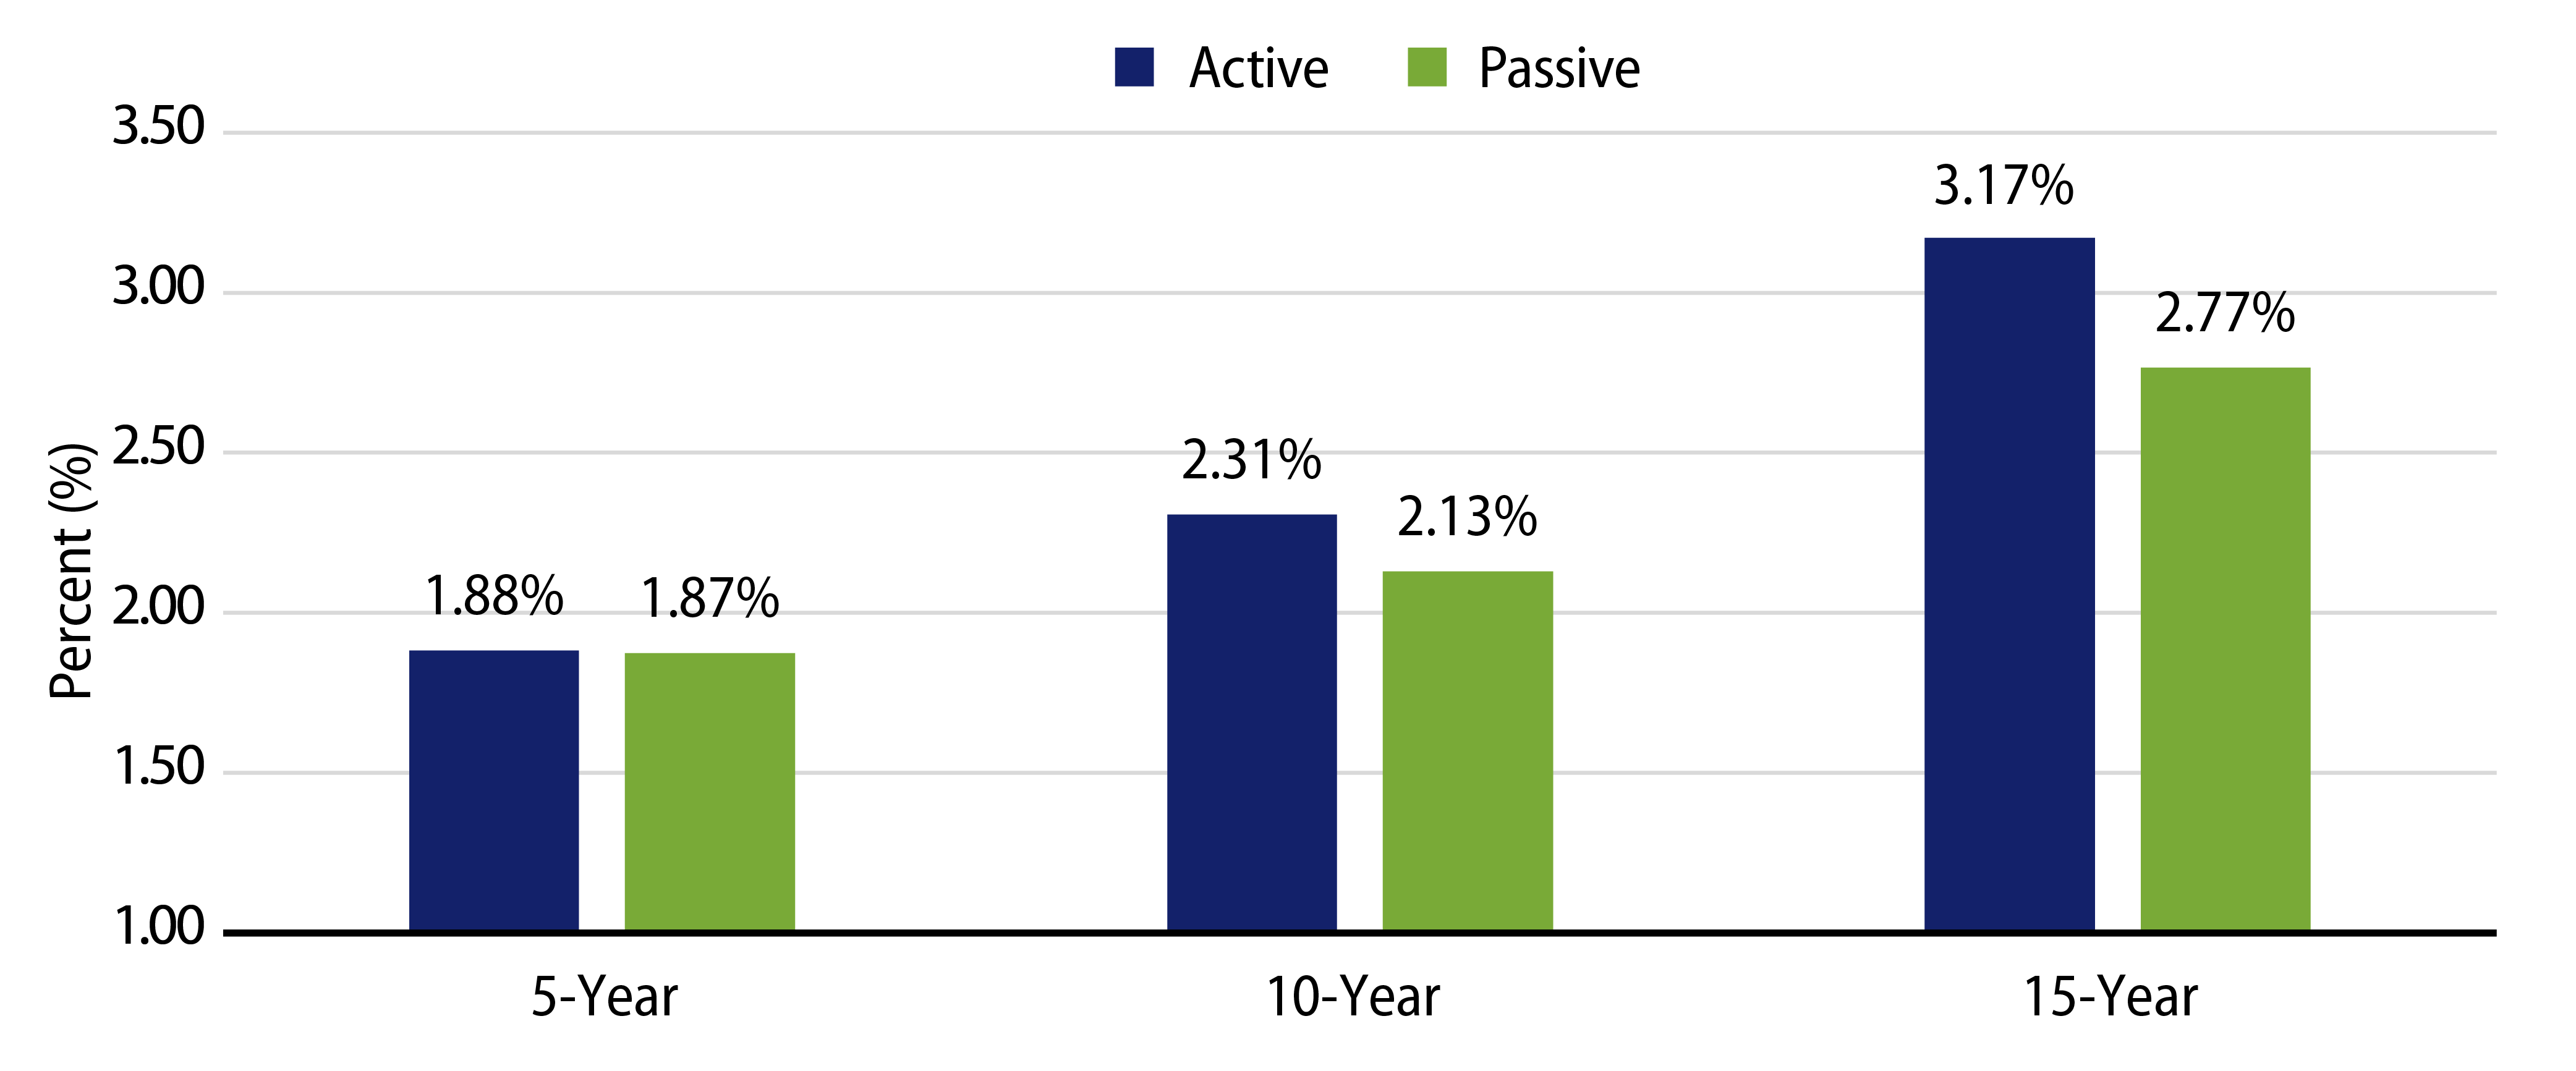
While passive investment solutions have proven advantageous in equity markets, active management offers structural advantages in fixed-income markets, particularly within the fragmented muni market. Considering the largest Morningstar municipal fund category (Muni Intermediate), over the past 15 years (2008-2023), actively managed funds have outperformed passive vehicles by 0.43%, after fees. We believe there are several structural advantages to an active approach within the muni market:

1. Rules-Based Allocations Can Bias Investment to Rich Valuations. The largest passive funds maintain allocation rules that track underlying indices. Allocating to these rules at all costs could lead investment into relatively poor valuations, and within tax regimes that may not be beneficial for all underlying investors. For example, all else being equal, California muni bonds often trade at lower yields because in-state investors benefit from the exemption from the top state tax rate in the nation of 13.3%. Therefore, California-domiciled investors are willing to pay higher prices, or accept lower yields for California securities. Because the state of California is the largest issuer in the municipal market, it represents the largest holding in the largest passive mutual fund even though the majority of fund investors likely do not benefit from the in-state California tax exemption.

2. Volatile Liquidity Conditions Could Challenge Passive Vehicles. Considering their rules-based allocation approach, passive funds tend to be fully vested at all times and could be vulnerable to the challenging municipal supply and demand dynamics. During inflow cycles, passive vehicles could be forced to allocate at the time of potentially rich valuations in order to achieve index-like exposure. Similarly, during outflow cycles, fully vested vehicles can be subject to redemptions and forced to raise cash during weak market conditions. Active strategies that can navigate market liquidity, seasonal supply and demand dynamics and relative value independent of an index can stand to benefit from investing into overbought and selling into oversold conditions.

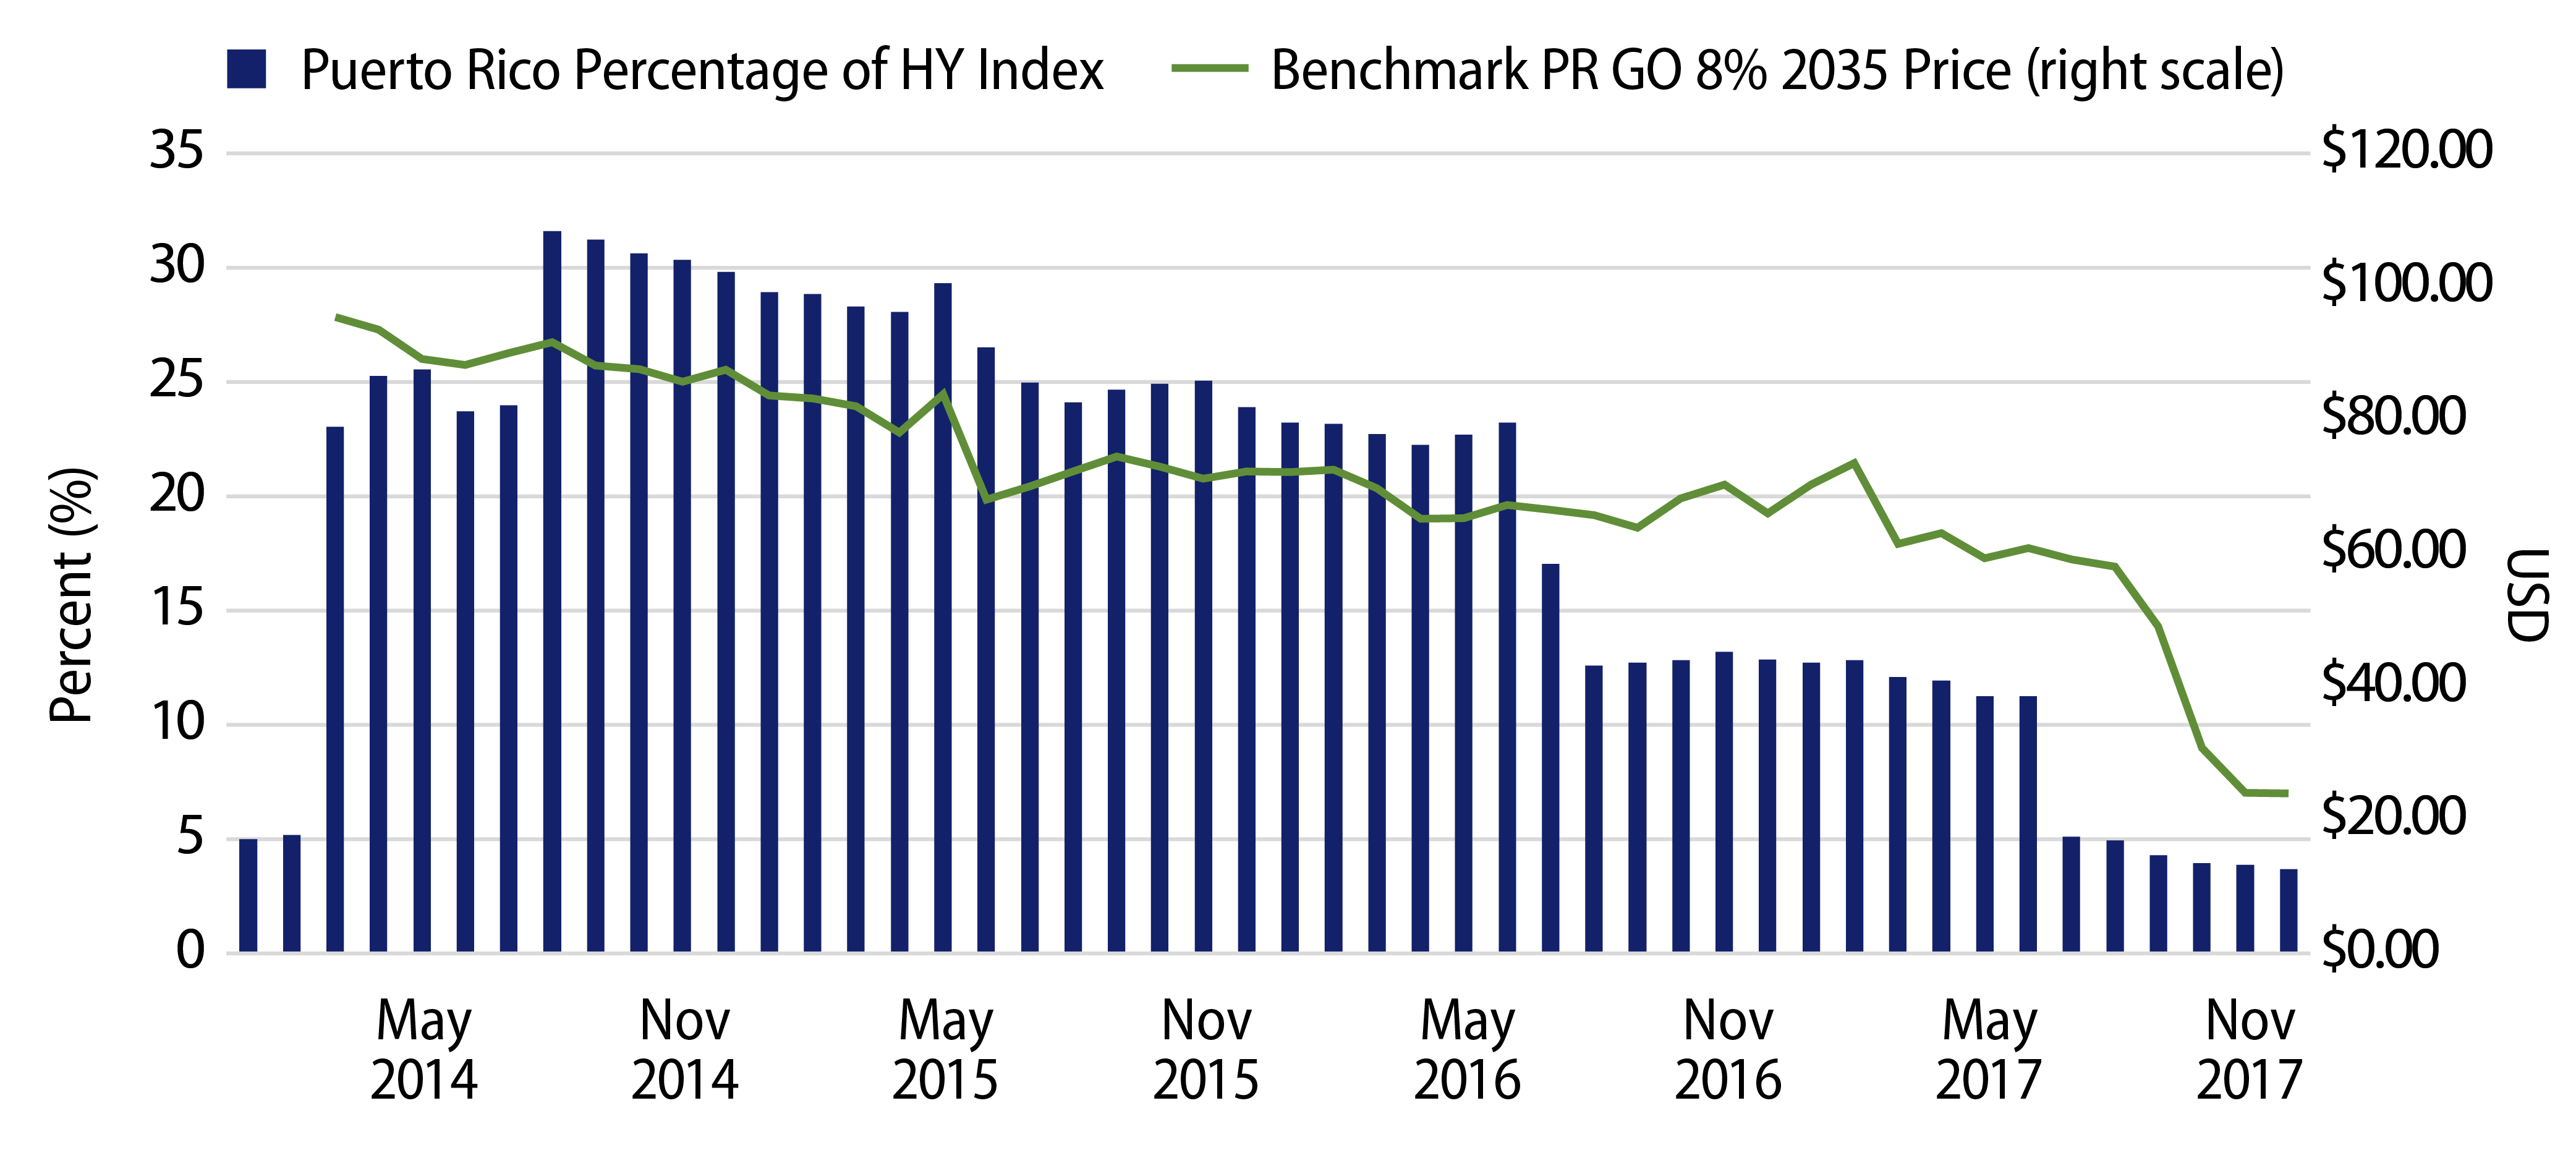
3. Greater Exposure to Indebted Issuers Could Challenge Risk-Adjusted Returns. While equity benchmark constituents are typically weighted by market capitalization, fixed-income benchmarks are weighted by the amount of debt outstanding in the marketplace. This distinction can lead more levered and potentially lower quality issuers to comprise a greater share of the overall index and passive portfolios that track the index. This dynamic is perhaps best illustrated by Puerto Rico, which comprised over 30% of the Bloomberg High Yield Municipal Bond Index in 2014 ahead of the island’s bankruptcy process that led to the defaults and removal of these bonds from the index. While an index can seamlessly rebalance out of defaulted securities following a default without consequence, a fund vehicle could be challenged to source liquidity for these securities. The benchmark Puerto Rico GO 8% of 2035 observed its steepest price decline after the removal from the index, falling to as low as $21.18 in 2017 following the initial issue price of $93 in 2014.

Exhibit 2: Puerto Rico Percentage of High-Yield Muni Bond Index vs. Puerto Rico 8% of 2035 Price
Puerto Rico Percentage of High-Yield Muni Bond Index vs. Puerto Rico 8% of 2035 Price
Source: Bloomberg, Western Asset. As of 04 Feb Dec 24. Select the image to expand the view.

4. Tax-Aware Outcomes. Municipal investors often seek to limit tax liabilities within a municipal allocation. Active management allows portfolio managers the ability to take losses against embedded gains to minimize tax consequences, improve the tax-exempt income profile of the fund, and contribute to better after-tax outcomes.

Western Asset believes that expenses will impact total returns and should be considered as part of an asset allocation. However, passive “set it and forget it” frameworks in the inefficient municipal market can lead to less optimal outcomes. With fewer liquidity providers in the muni market and the greater potential for market volatility, we expect active management solutions will continue to deliver better value versus passive counterparts.

Exhibit 3: Municipal Bond Yields and Index Returns
Municipal Bond Yields and Index Returns
Source: Bloomberg. As of 02 Feb 24. Past performance is not a guarantee of future results. It is not possible to invest directly in an Index. Select the image to expand the view.
Exhibit 4: Tax-Exempt and Taxable Muni Valuations
Tax-Exempt and Taxable Muni Valuations
Source: Bloomberg. As of 02 Feb 24. Select the image to expand the view.

Western Asset Key Themes for Muni Investors

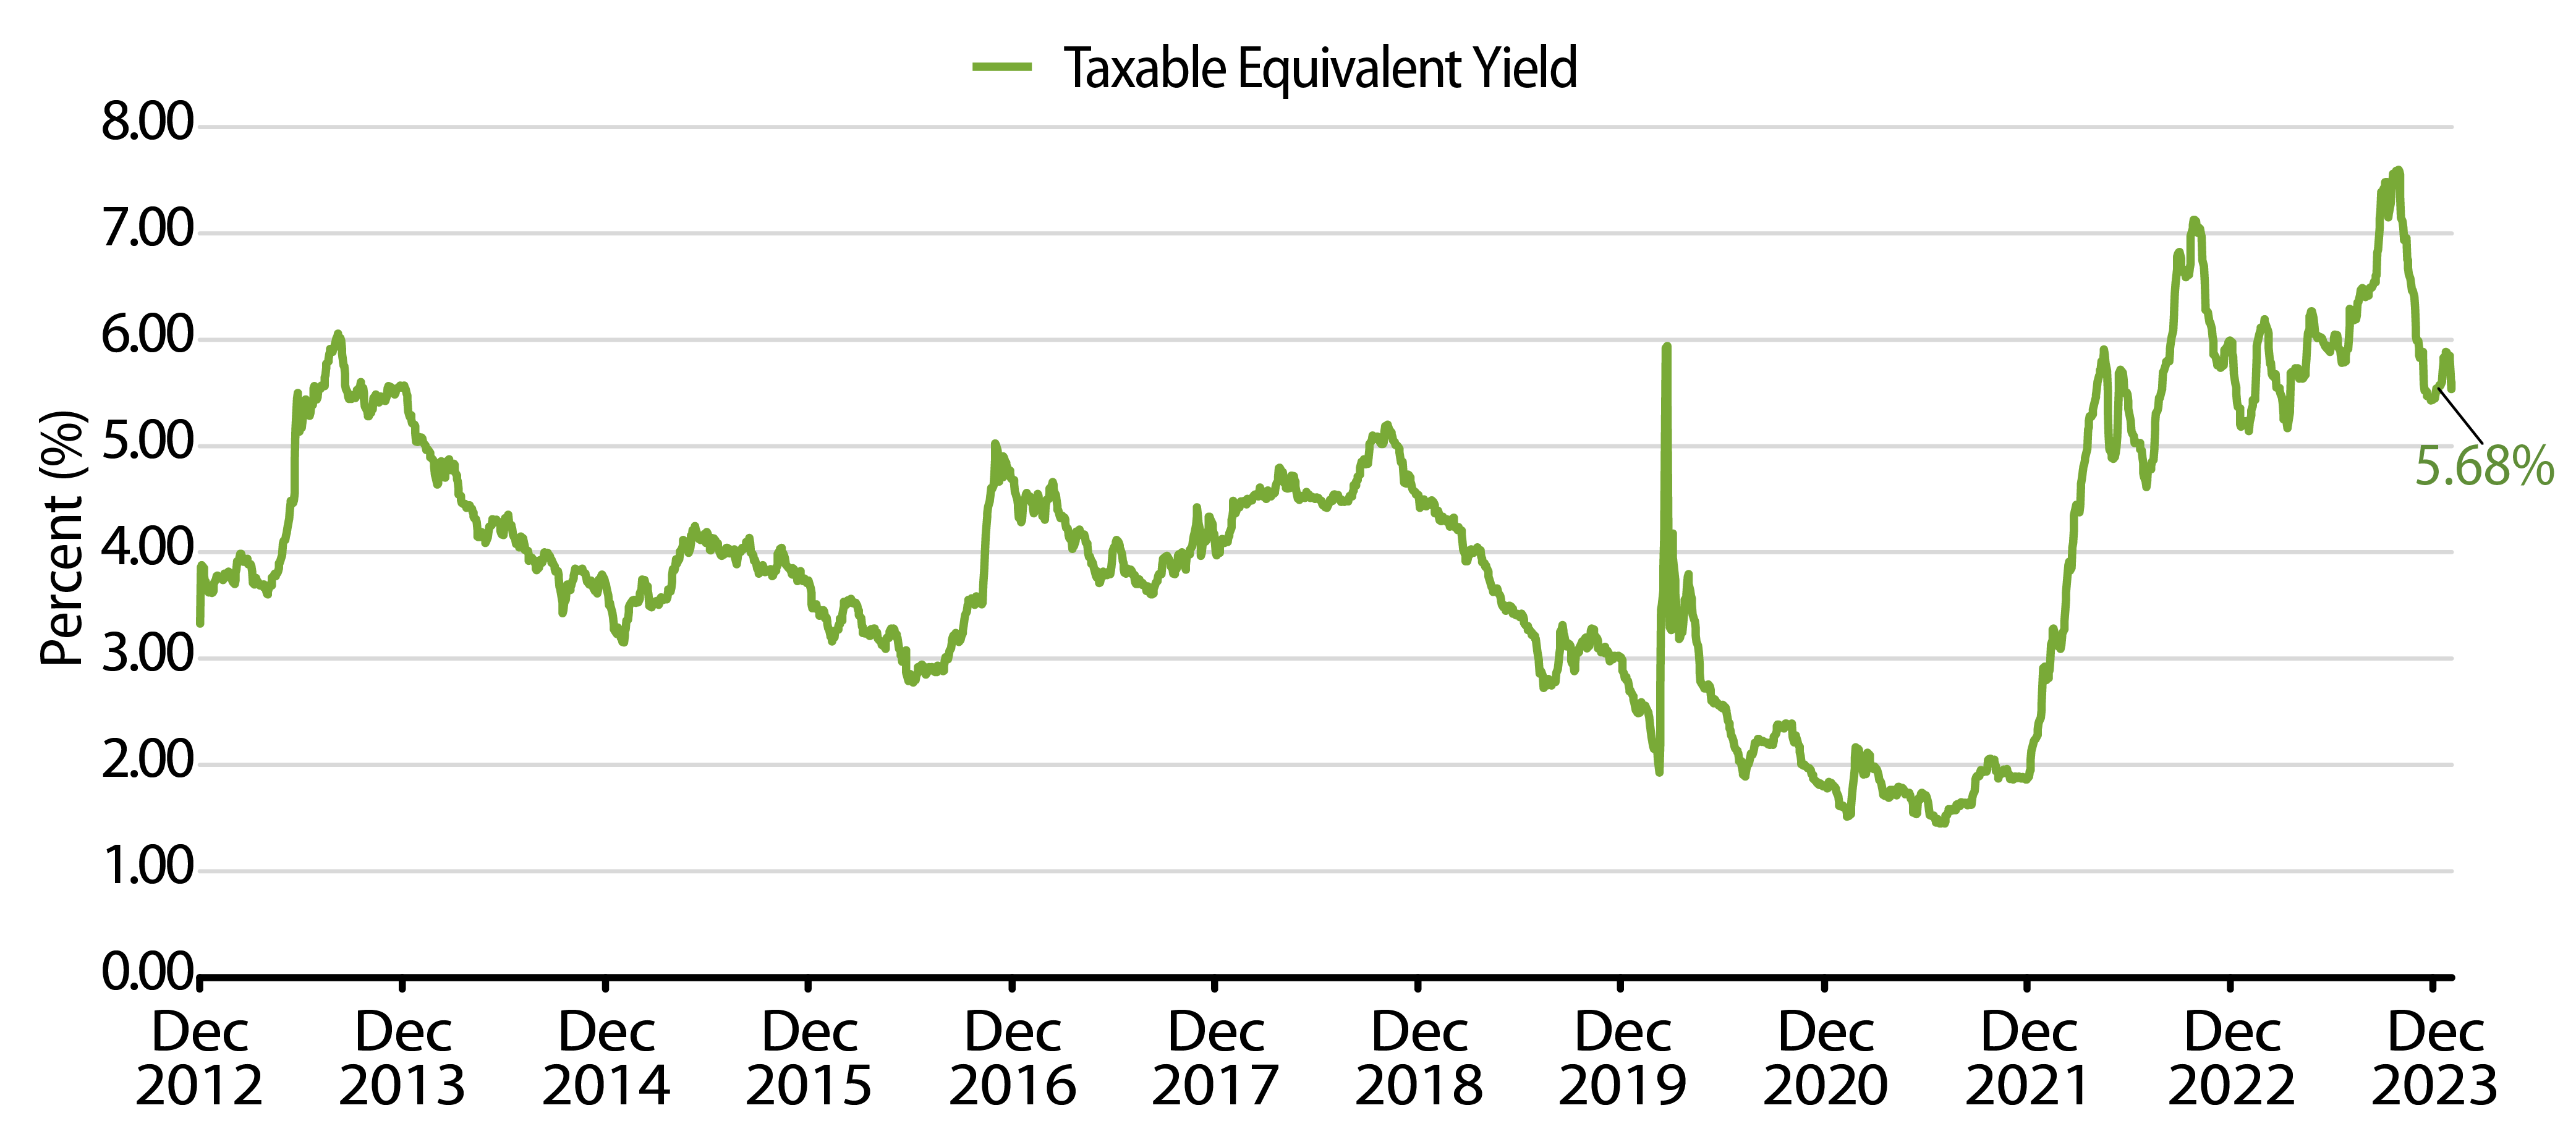
Theme #1: Municipal taxable-equivalent yields are above decade averages.

Exhibit 5: Muni and Taxable-Equivalent Muni Yield-to-Worst
Muni and Taxable-Equivalent Muni Yield-to-Worst
Source: Bloomberg, Western Asset. As of 02 Feb 24. Bloomberg Municipal Bond Index Yield Considering Highest Marginal Tax Rate. Select the image to expand the view.

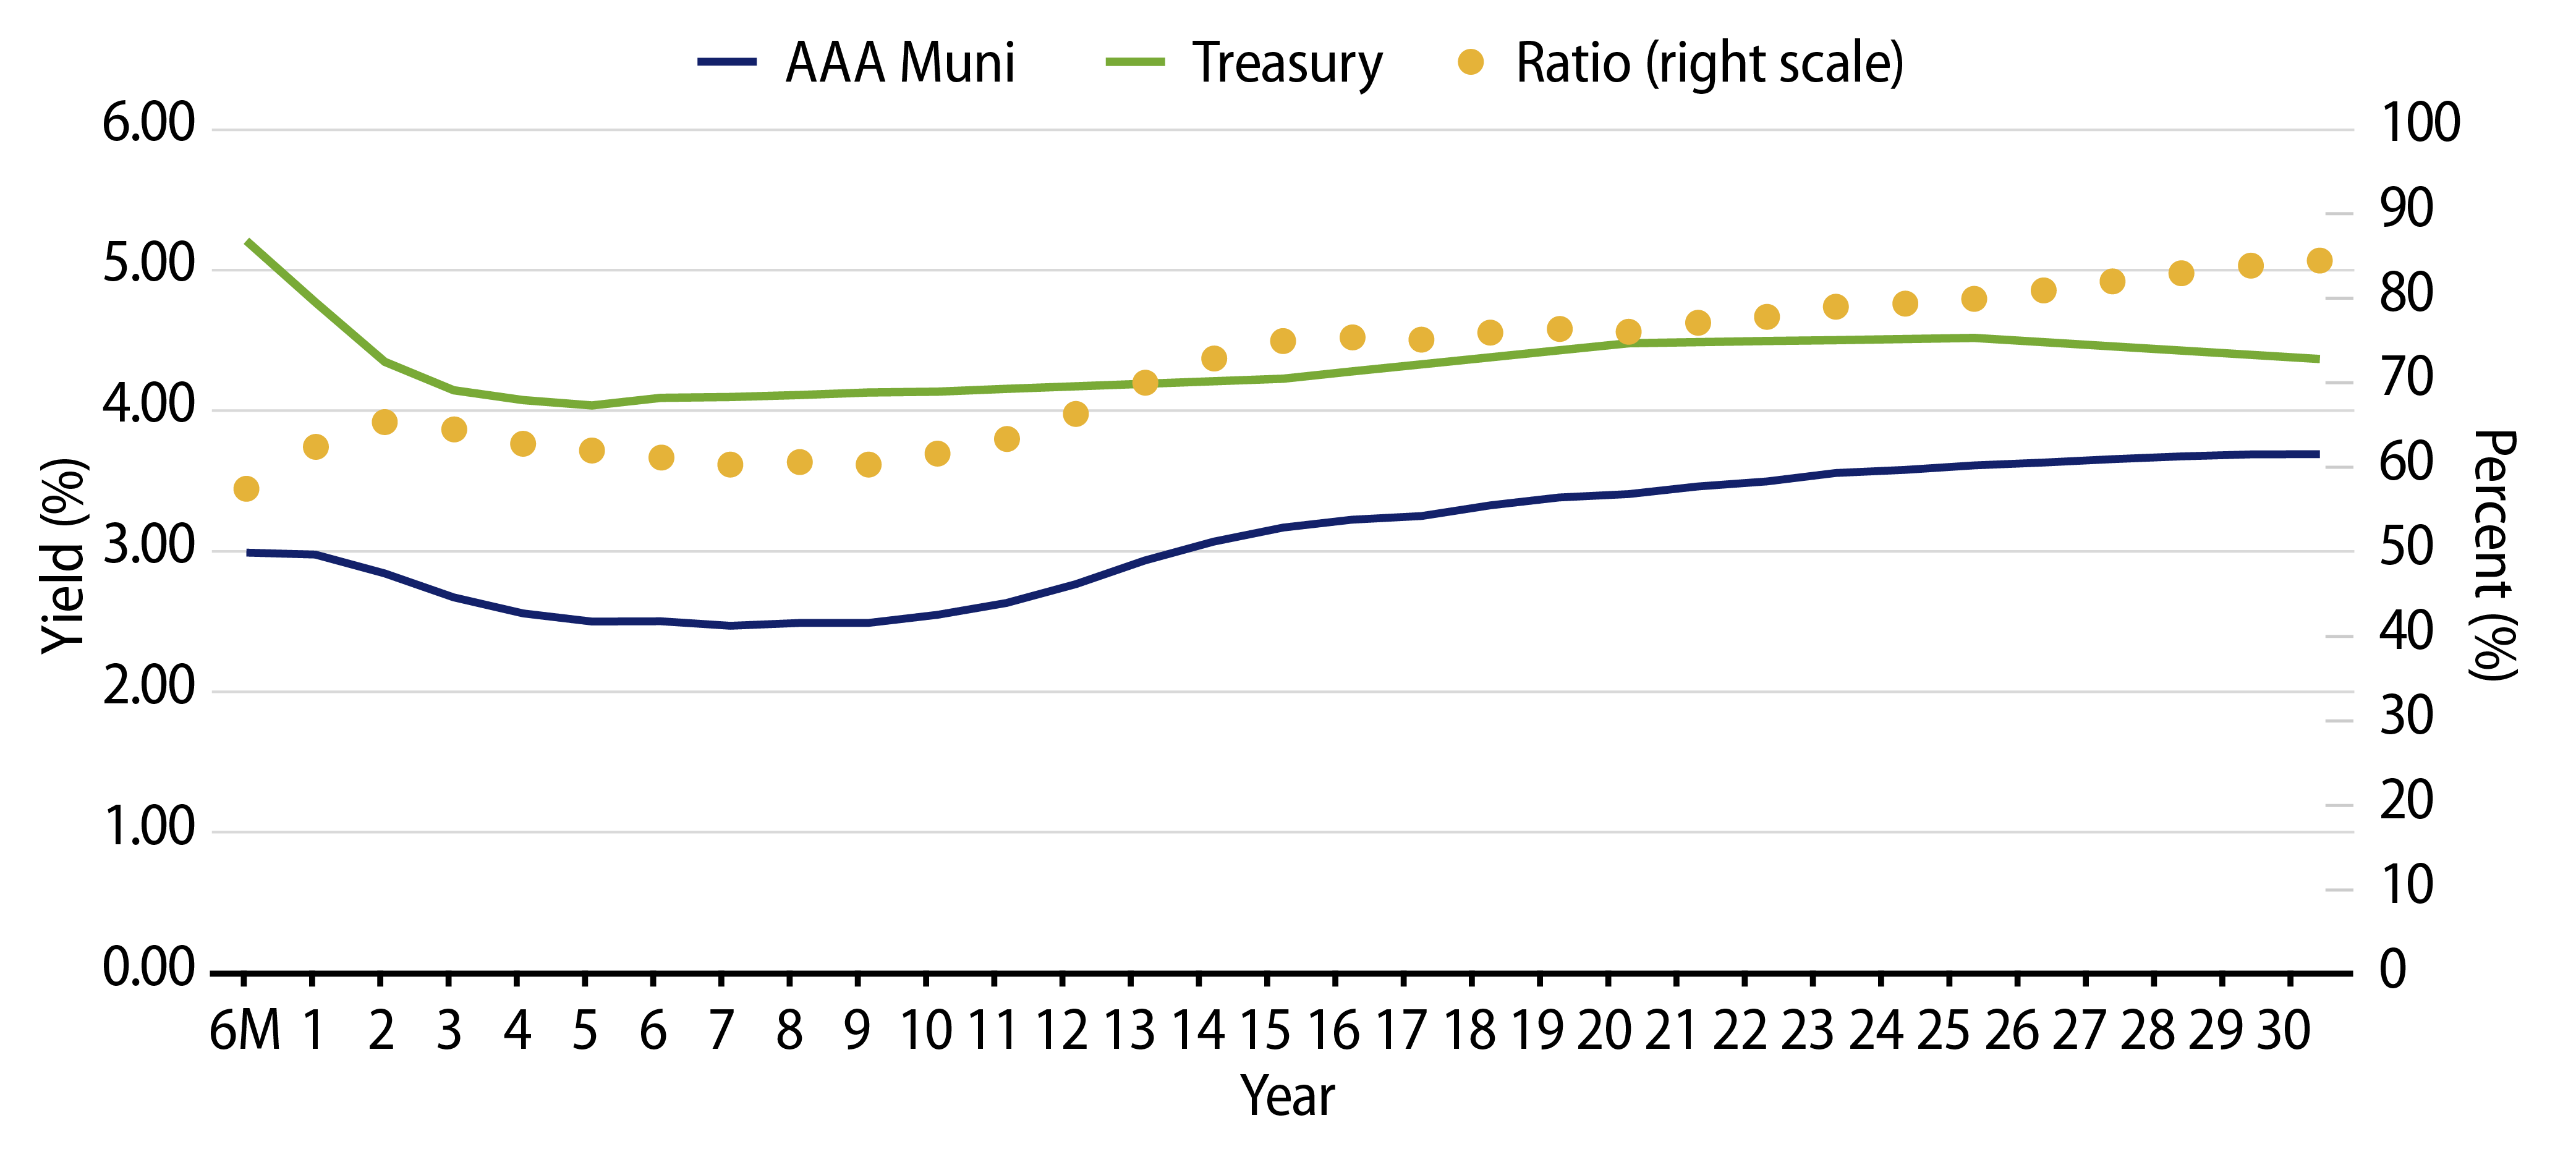
Theme #2: Recent yield curve steepening has highlighted value in longer maturities.

Exhibit 6: AAA Municipal vs. Treasury Yield Curves
AAA Municipal vs. Treasury Yield Curves
Source: Bloomberg, Western Asset. As of 02 Feb 24. Bloomberg BVAL AAA Muni Curve and US On-/Off-the-Run Sovereign Curve. Select the image to expand the view.

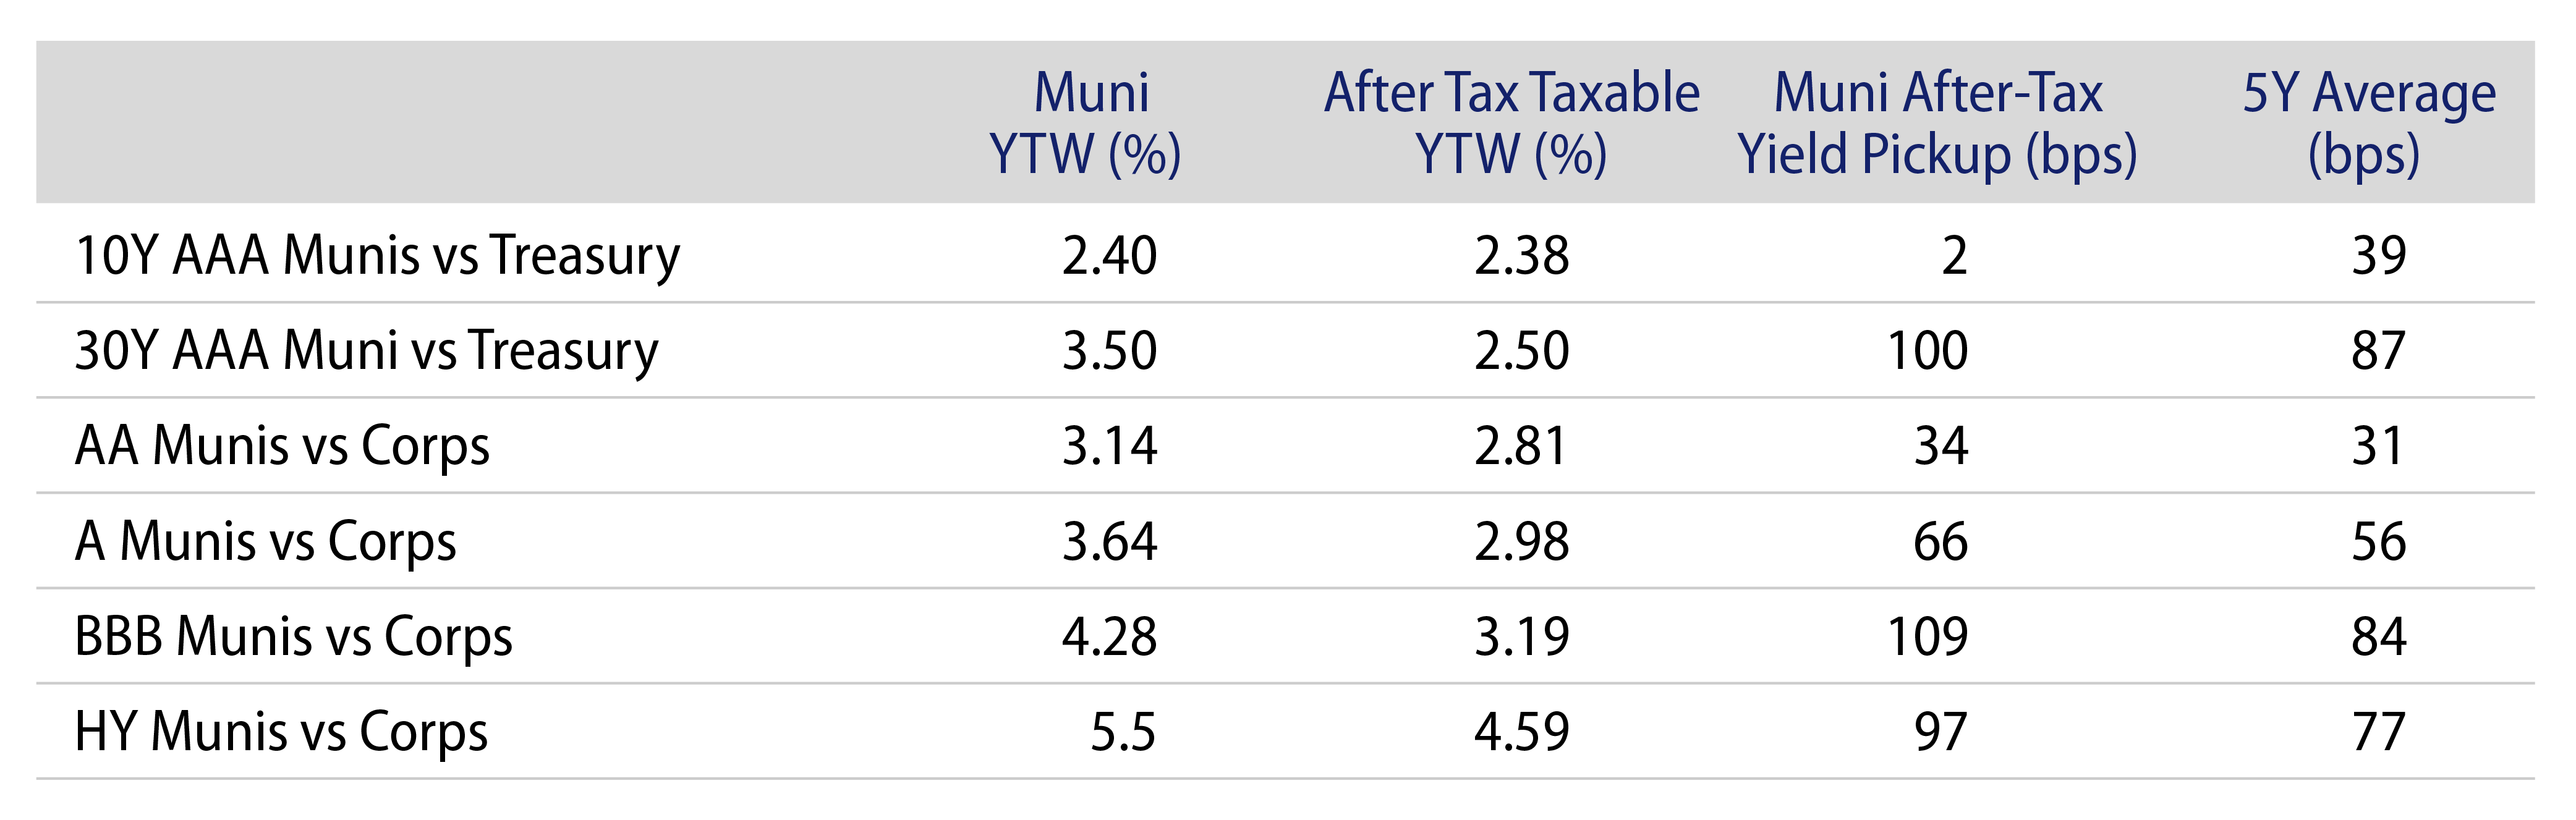
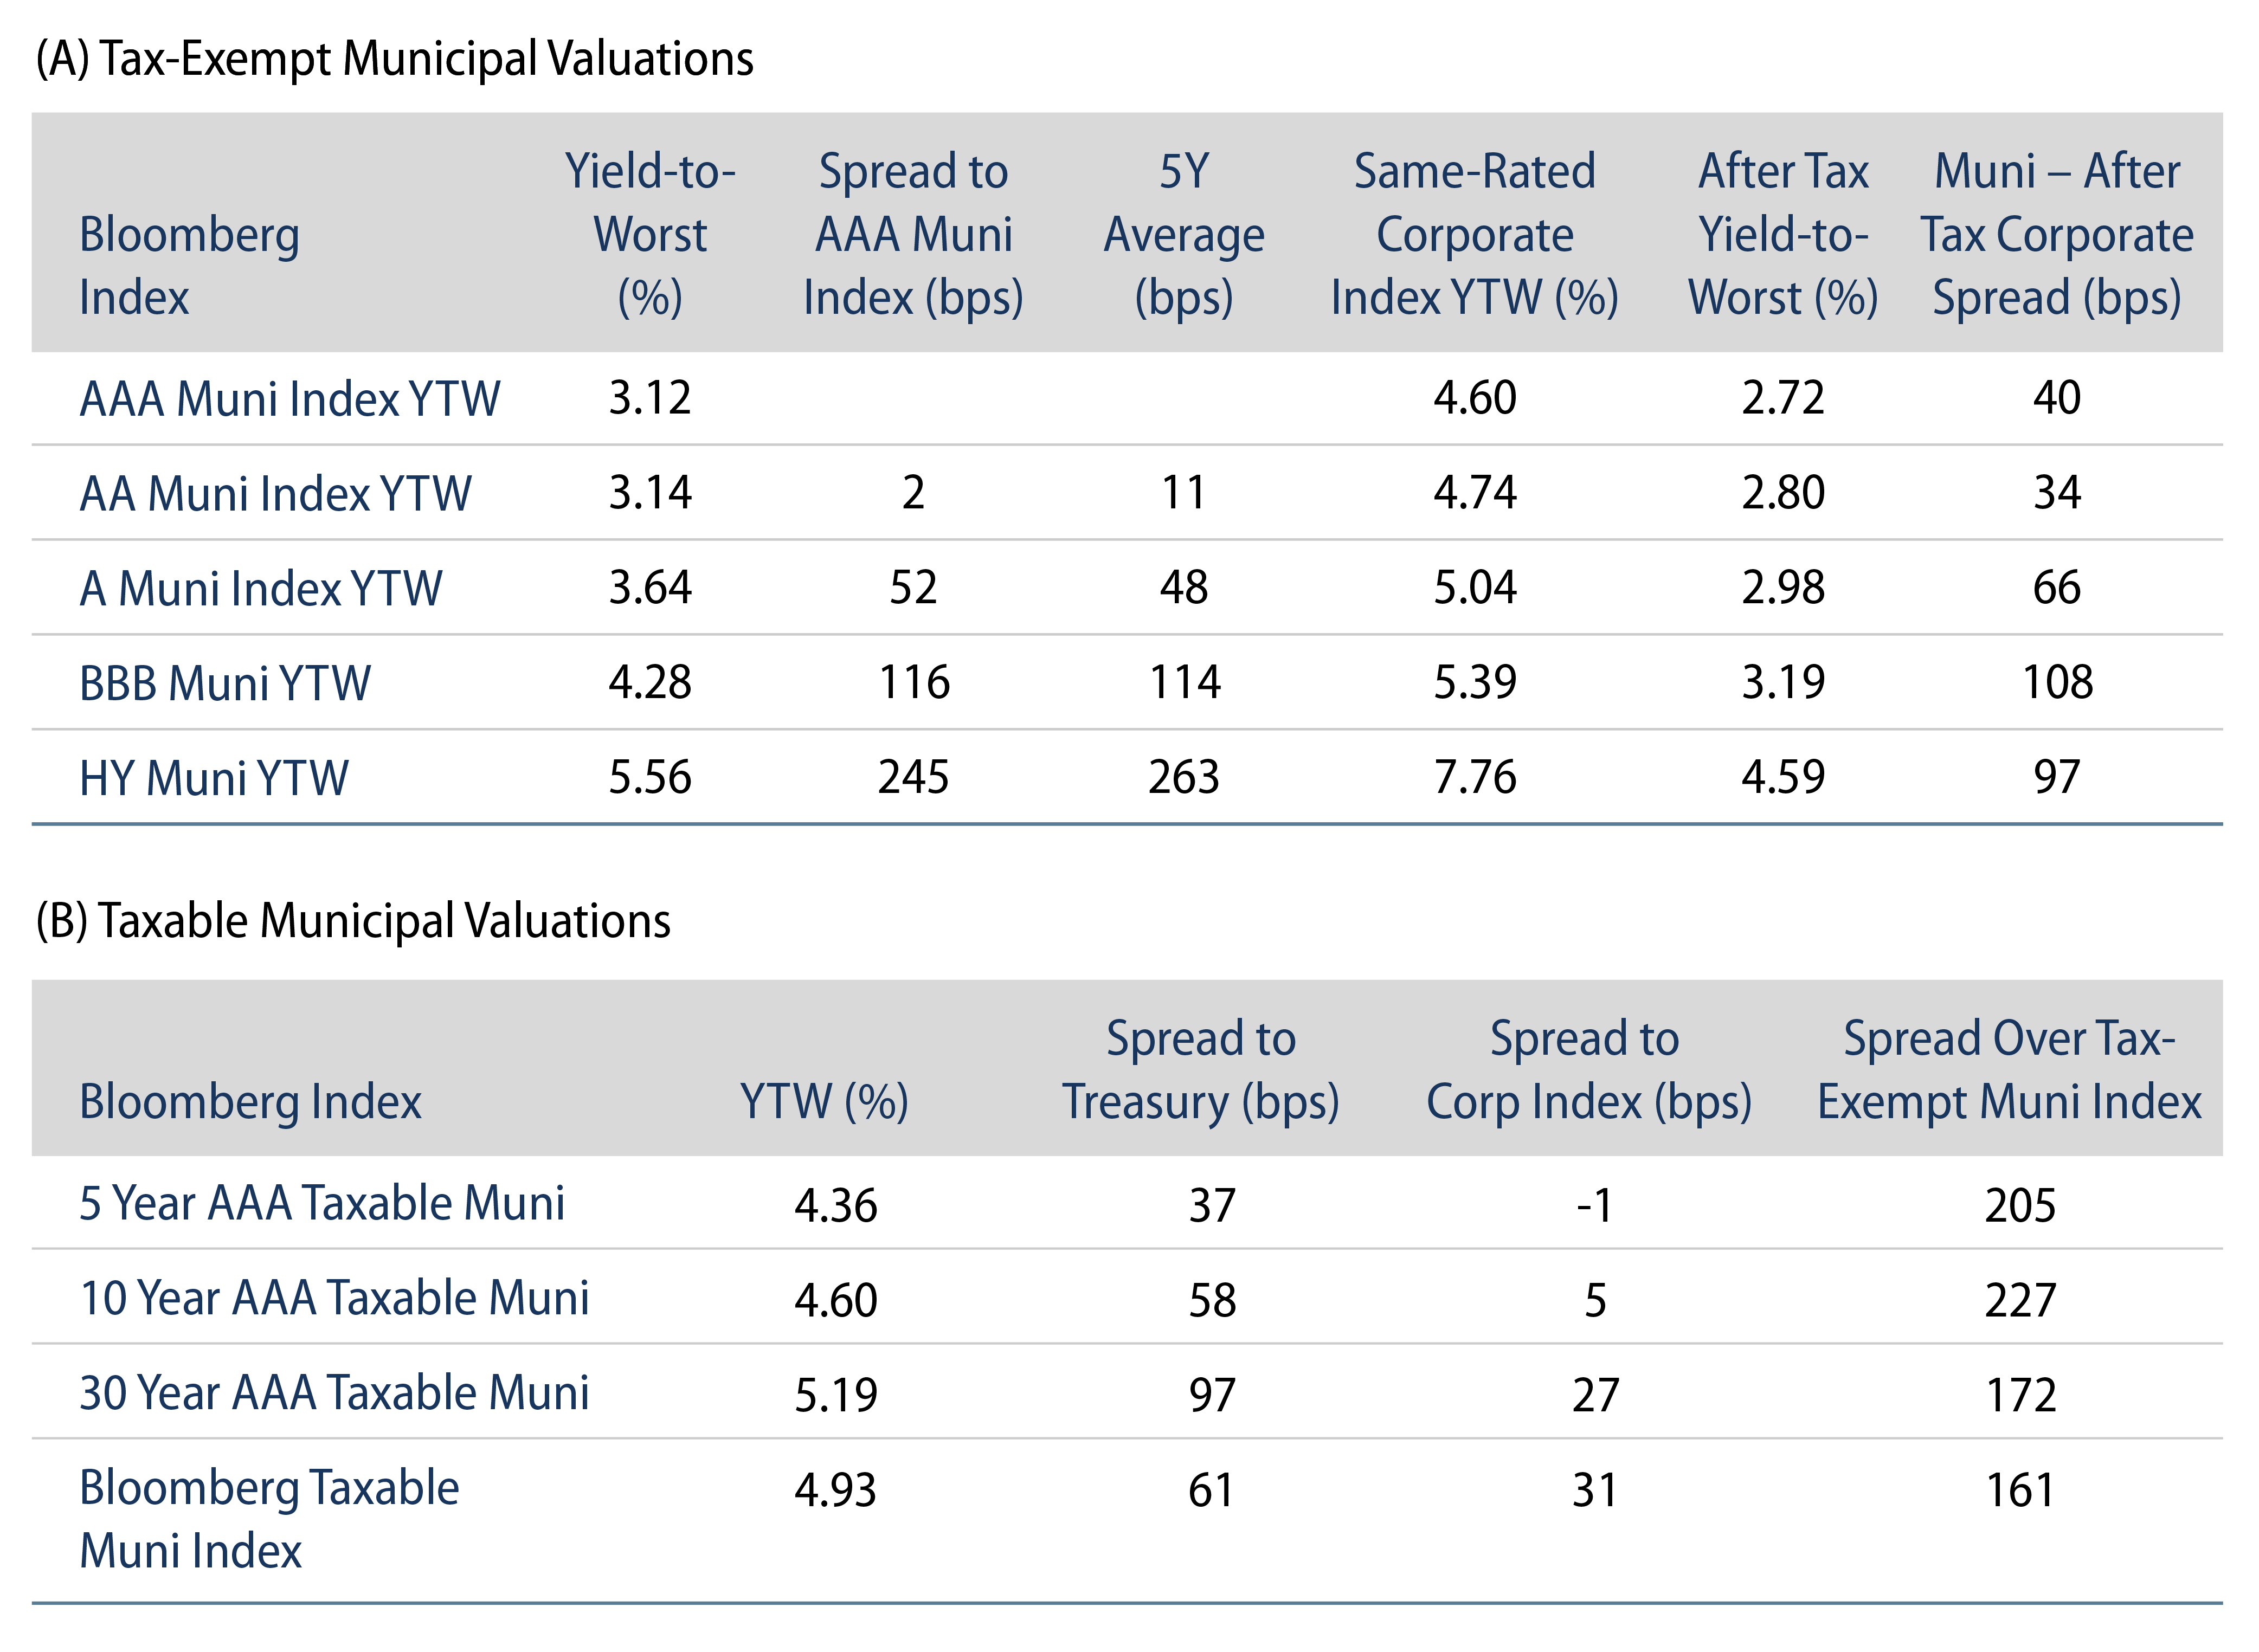
Theme #3: Munis offer attractive after-tax yield pickup versus long Treasuries and corporate credit.

Exhibit 7: Municipal vs. Taxable Fixed-Income Yields by Quality
Municipal vs. Taxable Fixed-Income Yields by Quality
Source: Western Asset, Bloomberg. As 02 Feb 24. Bloomberg BVAL AAA Muni Curve and US On-/Off-the-Run Sovereign Curve. After-tax yield considers top marginal tax rate of 40.8%. Select the image to expand the view.

投資一任契約および金融商品に係る投資顧問料(消費税を含む):
投資一任の場合は運用財産の額に対して、年率1.10%(税抜き1.00%)を上限とする運用手数料を、運用戦略ごとに定めております。 また、別途運用成果に応じてお支払いいただく手数料(成功報酬)を設定する場合があります。その料率は、運用成果の評価方法や固定報酬率の設定方法により変動しますので、手数料の金額や計算方法をこの書面に記載することはできません。
投資信託の場合は投資信託ごとに信託報酬が定められておりますので、目論見書または投資信託約款でご確認ください。

有価証券の売買又はデリバティブ取引の売買手数料を運用財産の中からお支払い頂きます。投資信託に投資する場合は信託報酬、管理報酬等の手数料が必要となります。これらの手数料には多様な料率が設定されているためこの書面に記載することはできません。デリバティブ取引を利用する場合、運用財産から委託証拠金その他の保証金を預託する場合がありますが、デリバティブ取引の額がそれらの額を上回る可能性があります。その額や計算方法はこの書面に記載することはできません。投資一任契約に基づき運用財産の運用を行った結果、金利、通貨の価格、金融商品市場における相場その他の指標に係る変動により、損失が生ずるおそれがあります。損失の額が、運用財産から預託された委託証拠金その他の保証金の額を上回る恐れがあります。個別交渉により、一部のお客様とより低い料率で投資一任契約を締結する場合があります。

©Western Asset Management Company Ltd 2024. 本資料の著作権は、ウエスタン・アセット・マネジメント株式会社およびその関連会社(以下「ウエスタン・アセット」という)に帰属するものであり、意図した受取人のみを対象として作成されたものです。本資料に記載の内容は、秘密情報及び専有情報としてお取り扱いください。ウエスタン・アセットの書面による事前の承諾なしに、全部又は一部を無断で複写、複製することや転載することを堅くお断りいたします。

過去の運用実績は将来の運用実績を示すものではありません。また、本資料は、将来の実績を予測または予想するものではありません。

本資料は、適格機関投資家、特定投資家、企業年金基金、公的年金等、豊富な投資経験と高度な専門知識とを備えたプロフェッショナルのお客様のみにご提供するものです。


本資料は情報の提供のみを目的としています。資料作成時点のウエスタン・アセットの見解を掲載したものであり、将来予告なしに変更する場合があります。また、リアルタイムの市場動向や運用に関する見解ではありません。

本資料で第三者のデータが使用されている場合、ウエスタン・アセットはそのデータが公表時点で正確であると信じていますが、それを保証するものではありません。ウエスタン・アセットの戦略・商品の受賞またはランキングが含まれている場合、これらは独立した第三者または業界出版物により公平な定量・定性情報に基づき決定されたものです。ウエスタン・アセットは、これらの第三者の標準的な業界サービスを利用したり、出版物を購読したりする場合がありますが、それらは、すべてのアセット・マネージャーが利用可能なものであり、ランキングや受賞に影響を与えるものではありません。

本資料に記載の戦略・商品には、元本の一部または全部の損失を含む大きなリスクが伴う場合があります。また、当該戦略や商品に投資することは大きな変動を伴なう可能性があり、投資家にはそのようなリスクを受け入れる経済力および意思を持つことが求められます。

特段の注記がない限り、本資料に記載の戦略のパフォーマンスはコンポジットのデータです。コンポジットではないその他のデータについては、当戦略の運用方針に最も近いと考えられる口座を、コンポジットの代表口座として掲載しています。つまり、代表口座は運用結果により選択されるものではありません。代表口座のポートフォリオ特性は、コンポジットやその他のコンポジット構成口座と異なる場合があります。これらの口座についての情報はご依頼に応じてご提供いたします。

本資料に記載している内容は、ウエスタン・アセットの投資家に対する投資助言ではありません。個別銘柄・発行体に関する一般的または具体的に言及する内容は、例としてご提示したものであり、購入または売却を推奨するものでもありません。また、ウエスタン・アセットの役職員及びお客様は、本資料に記載の有価証券を保有している可能性があります。 本資料は、会計、法務、税務、投資またはその他の助言の提供を意図したものではなく、またそれらに依存すべきではありません。お客様は、ウエスタン・アセットが提供する戦略・商品への投資を行うにあたり、経済的リスクやメリットなどについて助言が必要である場合は、ご自身の弁護士、会計士、投資家、税理士、その他のアドバイザーに相談して下さい。お客様は、居住国で適用される法令を遵守する責任を負います。

ウエスタン・アセットは世界有数の運用専門会社です。1971年の設立以来、債券運用に特化したアクティブ運用機関として最大規模の運用資産と運用チームを有しています。拠点は米国カリフォルニア州パサデナ、ニューヨーク、英国ロンドン、シンガポール、東京、豪メルボルン、ブラジル・サンパウロ、香港、スイス・チューリッヒにあり、フランクリン・リソーシズIncの完全子会社ですが、経営全般に独立性を保っており、次の6法人で構成されています。米国:ウエスタン・アセット・マネジメント・カンパニーLLC(米証券取引委員会(SEC)登録の投資顧問会社)。ブラジル・サンパウロ:ウエスタン・アセット・マネジメント・カンパニーDTVM Limitada(ブラジル証券取引委員会とブラジル中央銀行が認可・規制)。メルボルン:ウエスタン・アセット・マネジメント・カンパニーPty Ltd(事業者番号ABN 41 117 767 923、AFSライセンス303160)。シンガポール:ウエスタン・アセット・マネジメント・カンパニーPte. Ltd.(CMSライセンスCo. Reg. No. 200007692R、シンガポール通貨監督庁が監督)。日本:ウエスタン・アセット・マネジメント株式会社(金融商品取引業者、金融庁が規制)。英国:ウエスタン・アセット・マネジメント・カンパニーLimited(英金融行動監視機構(FCA)が認可(FRN145930)、規制)。本資料は英国ではFCAが定義する「プロフェッショナルな顧客」のみを対象とした宣伝目的に使用されます。許可された欧州経済領域 (EEA)加盟国へ配信する場合もあります。最新の承認済みEEA加盟国のリストは、ウエスタン・アセット(電話:+44 (0)20 7422 3000)までお問い合わせください。

詳細は当社ウエブサイトwww.westernasset.co.jpをご参照ください。
ウエスタン・アセット・マネジメント株式会社について
業務の種類: 金融商品取引業者(投資運用業、投資助言・代理業、第二種金融商品取引業)
登録番号: 関東財務局長(金商)第427号
加入協会: 一般社団法人日本投資顧問業協会(会員番号 011-01319)
一般社団法人投資信託協会