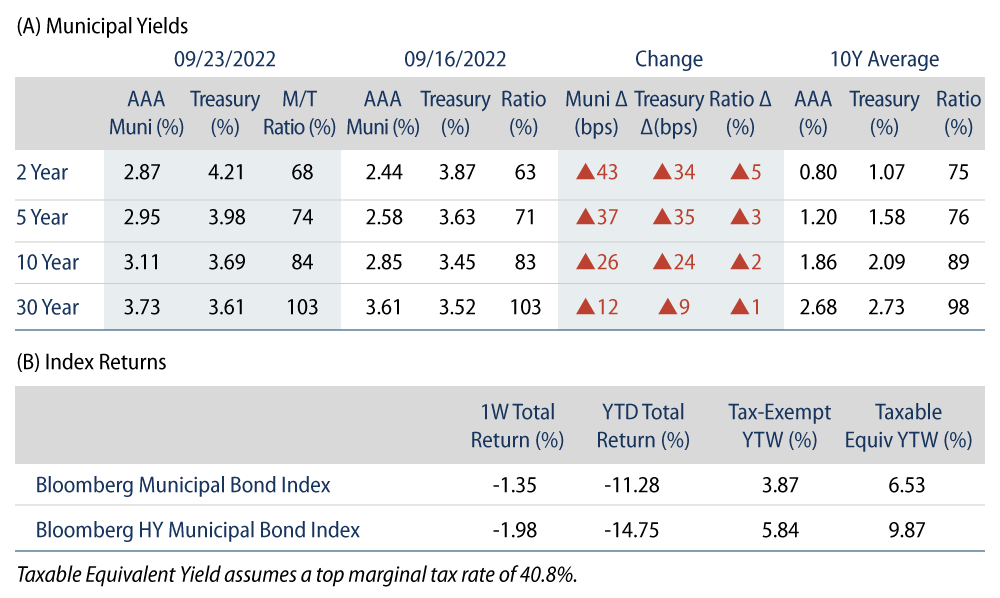
Municipals Posted Negative Returns
Municipals posted negative returns last week as rates moved higher with Treasuries. High-grade municipal yields moved 12-43 bps across the curve. Meanwhile, fund outflows continued amid a limited supply calendar. The Bloomberg Municipal Index returned -1.35% and the HY Muni Index returned -1.98%. This week we highlight challenged market conditions that could contribute to near-term market volatility.
Last Week’s New-Issue Calendar Was Limited as Fund Outflows Continued
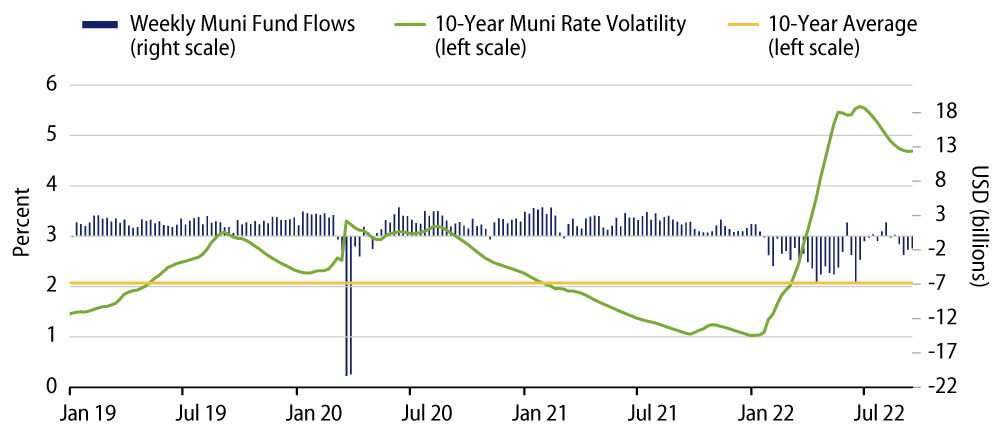
Fund Flows: During the week ending September 21, weekly reporting municipal mutual funds recorded $2 billion of net outflows, according to Lipper. Long-term funds recorded $1.3 billion of outflows, high-yield funds recorded $567 million of outflows and intermediate funds recorded $217 million of outflows. The week’s outflows extend year-to-date (YTD) outflows to $88 billion.
Supply: The muni market recorded $2 billion of new-issue volume, down 78% from the prior week. Total YTD issuance of $287 billion is 12% lower than last year’s levels, with tax-exempt issuance trending 2% lower year-over-year (YoY) and taxable issuance trending 44% lower YoY. This week’s new-issue calendar is expected to increase to $8 billion. Larger deals include $1.4 billion New York State UDC Personal Income Tax and $985 million Texas Water Development Board transactions.
This Week in Munis: Challenged Conditions Continue
Last month we highlighted the rising-rate conditions and elevated rate volatility that roiled the municipal markets throughout much of this year. While there were signs that declining rates and declining market volatility in July could lead to market stabilization, a return of rising rates and persistently high rate volatility in August and September have contributed to weak market conditions that again warrant caution.
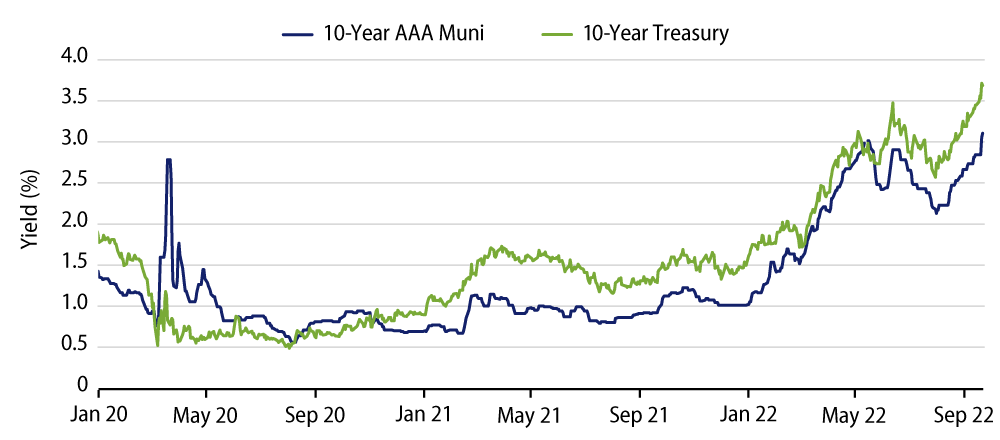
Municipal yields sharply increased with Treasuries. Since our post in August, the 10-year municipal yield increased sharply from 2.14% to 2.85%, the highest level since September 2013. Notably, municipal yields had either lagged or overshot the path of Treasury rate increases from 2020 through the 1H22. However, in August and September, muni rate increases have been more correlated to Treasuries, signaling that forward-looking muni performance could be more dependent on Treasury rates in the back half of the year.
Elevated rate volatility could further challenge market technicals. Municipal rate volatility began to decline in July, but remains well above historical averages. While we have observed municipals typically outperform high quality fixed-income during rising-rate periods, municipal demand tends to wane during periods of heavy rate volatility. For a market increasingly dependent on supply and demand technicals, a rebound of municipal demand appears to remain contingent on stabilizing rate volatility.
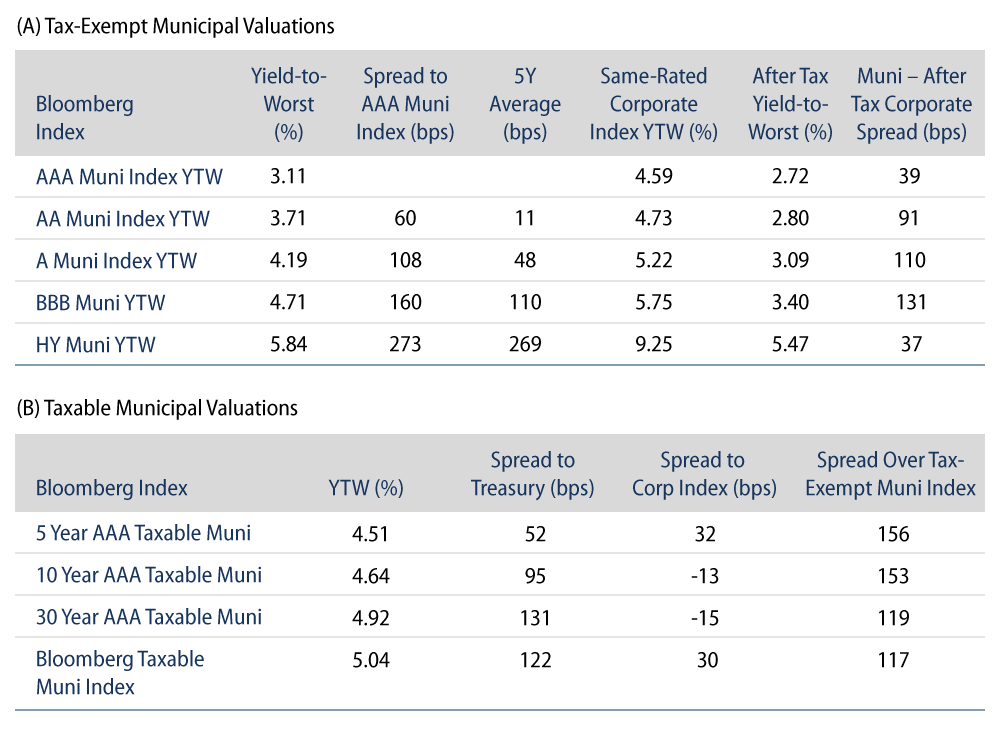
Negative price action has compounded structural vulnerabilities. The aggressive move in both rates and rate volatility has rightfully challenged municipal valuations. The majority of the municipal securities include embedded call options. As rates rise, the probability that a bond will be called will decline, and as such, the underlying bond’s price will decline so that the yield and duration reflect the respective yield-to-maturity and maturity date, rather than the yield-to-call and the call date. For lower-coupon municipal issues, these price declines are compounded as a portion of a bond’s accretion can be subject to ordinary income tax per de minimis regulations.
Rising municipal rates have certainly offered better relative value opportunities for municipal investors. However, we anticipate an uncertain inflationary environment, elevated rate volatility and structural risks that have re-emerged in the past two months to warrant caution within a municipal allocation. We believe portfolio flexibility is key in this climate, and active managers that seek to value these risks and opportunities stand to benefit during these periods of extended market volatility.