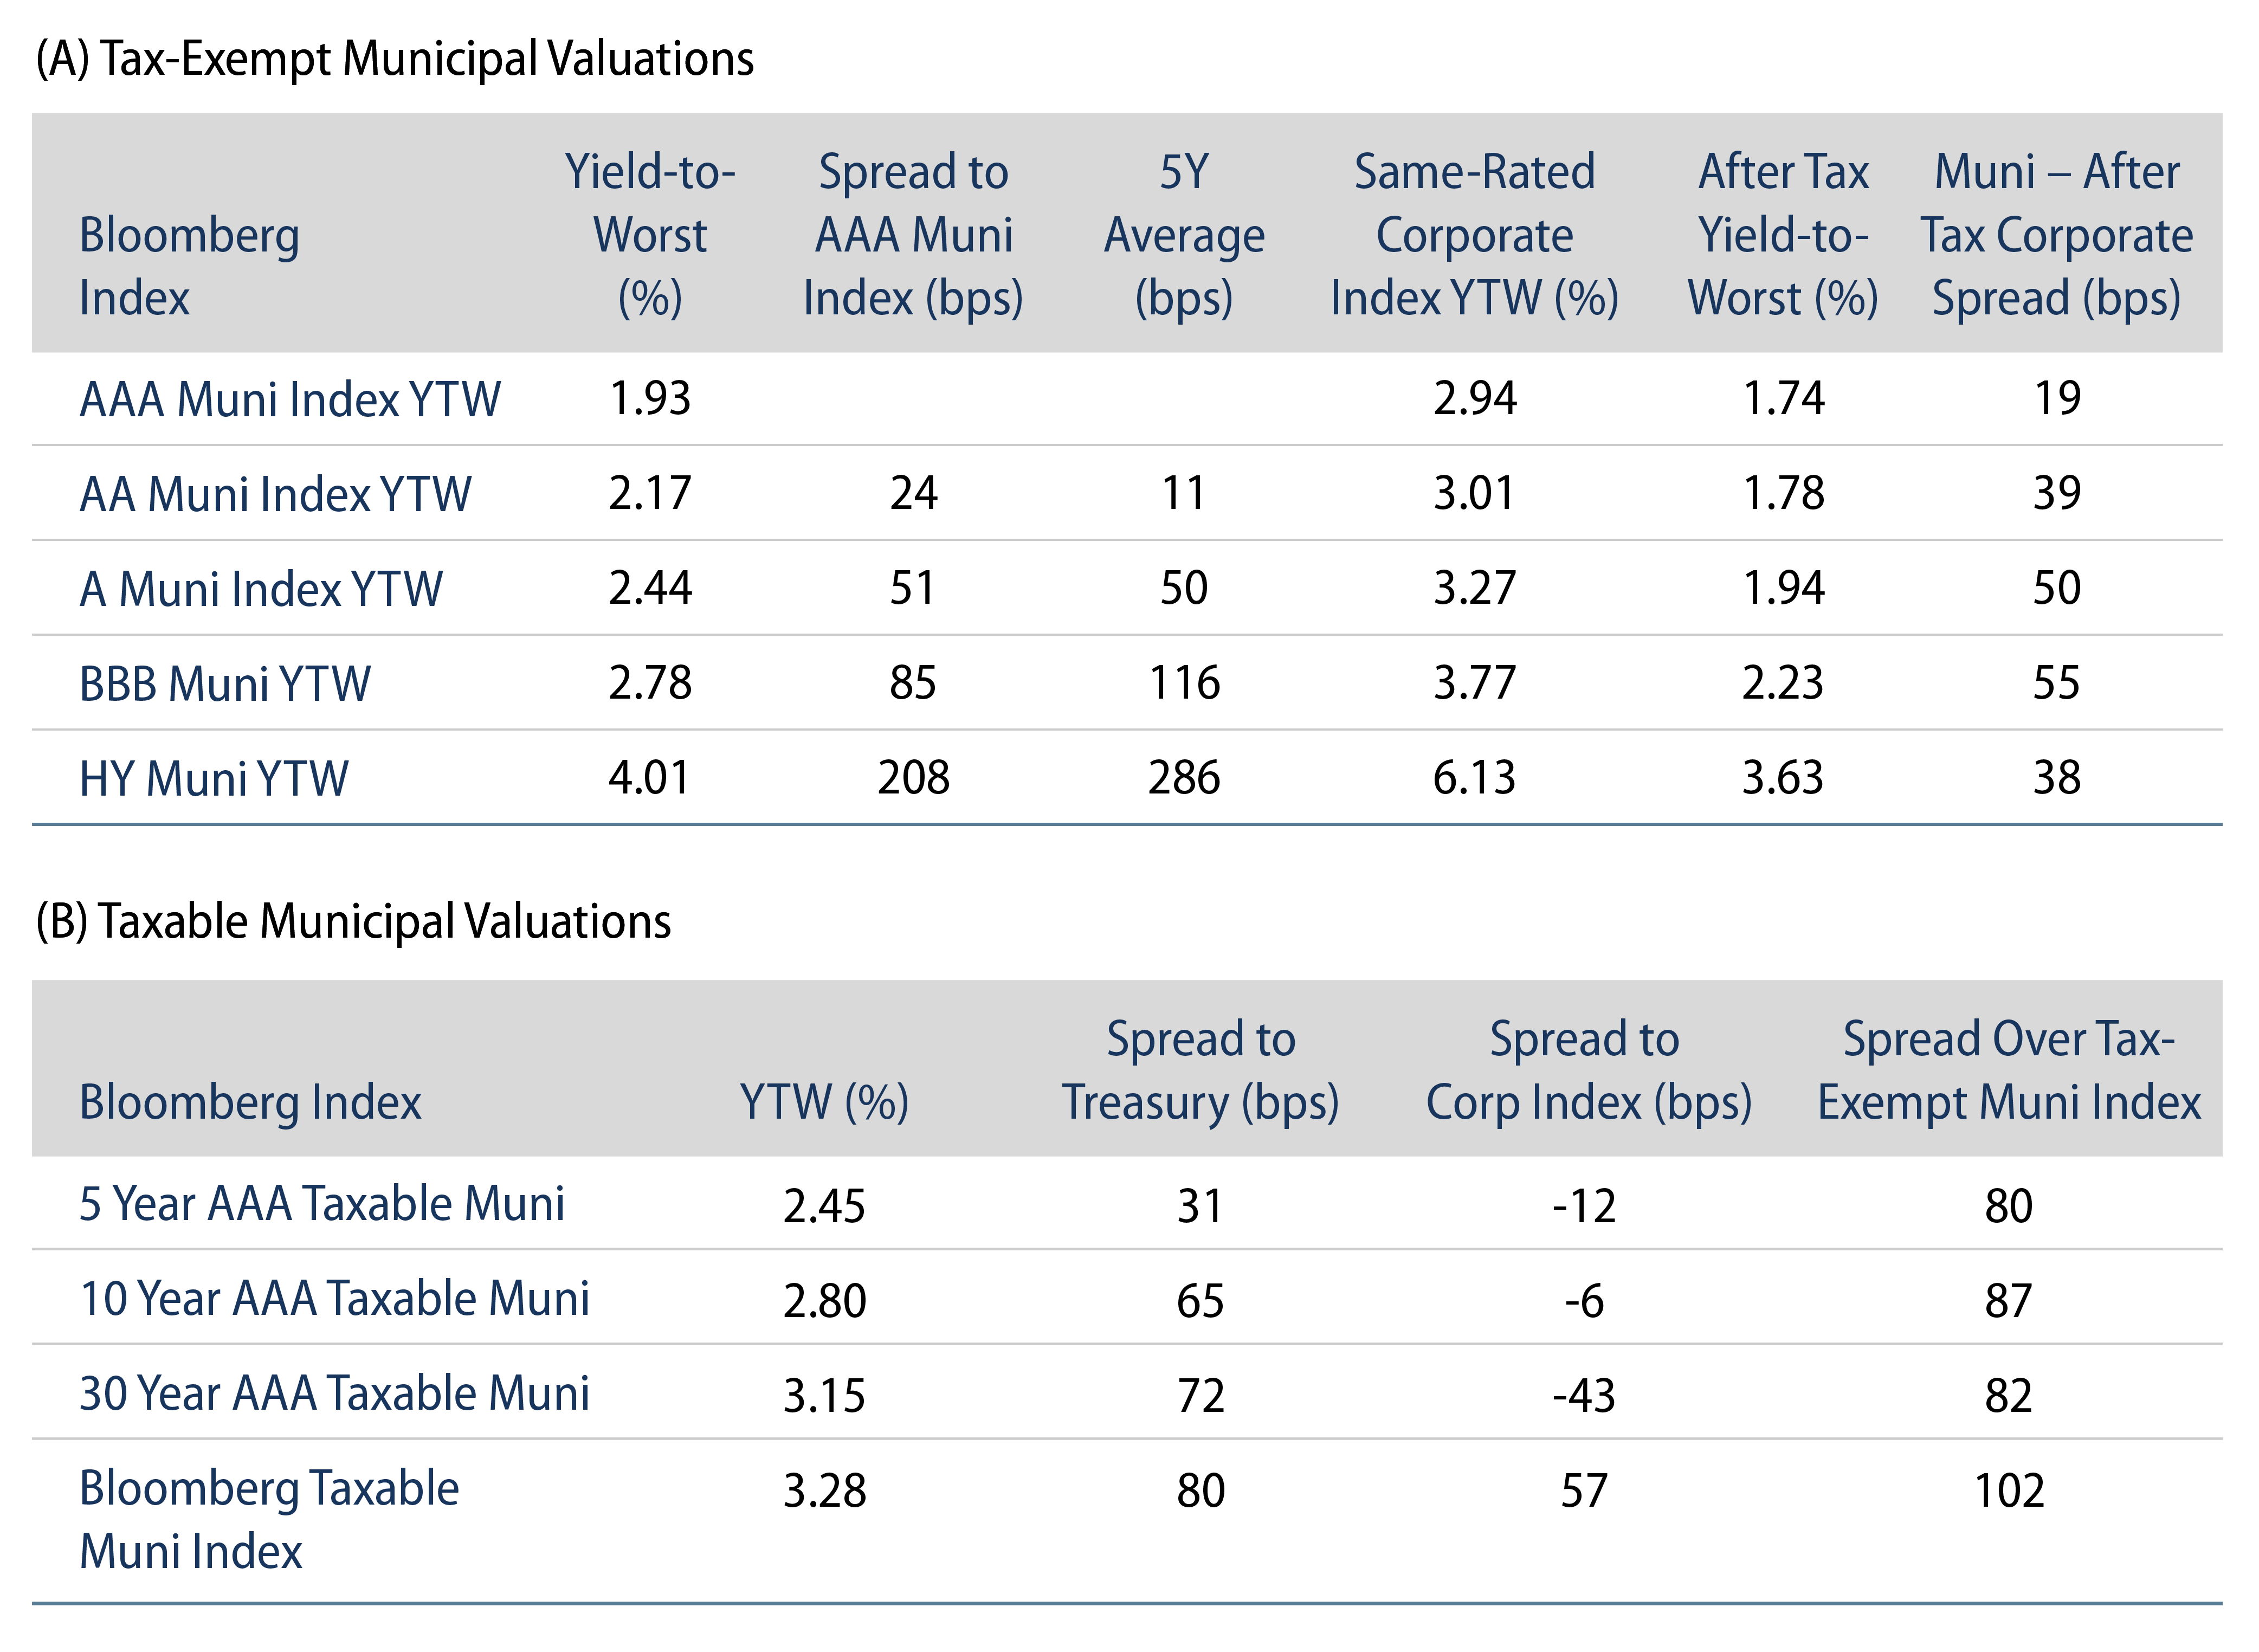
Municipal Returns Were Negative for the Week
US municipals experienced another volatile week and posted negative returns as high-grade municipal yields moved 7-9 bps higher across the curve. Muni yields trailed Treasuries higher, but outperformed in short and intermediate maturities. Municipal mutual funds recorded outflows for a 10th consecutive week. The Bloomberg Municipal Index returned -0.51%, while the HY Muni Index returned -0.42%. This week we highlight the impact high gas prices could have on the transportation sector.
Market Technicals Remain Weak as Outflows Persist
Fund Flows: During the week ending March 16, weekly reporting municipal mutual funds recorded $2.1 billion of outflows, according to Lipper. Long-term funds recorded $1.4 billion of outflows, high-yield funds recorded $569 million of outflows and intermediate funds recorded $331 million of outflows. The week’s fund outflows extend the current outflow streak to 10 consecutive weeks, contributing to $18.3 billion of year-to-date (YTD) net outflows.
Supply: The muni market recorded $6.8 billion of new-issue volume, down 44% from the prior week. Total YTD issuance of $83 billion is 6% higher from last year’s levels, with tax-exempt issuance trending 25% higher year-over-year (YoY) and taxable issuance trending 41% lower YoY. This week’s new-issue calendar is expected to increase to $9 billion. Largest deals include $891 New York City General Obligation and $595 million Illinois Finance Authority (Northshore-Edward-Elmhurst Health Credit Group) transactions.
This Week in Munis: Energy Price Impact on the Transportation Sector
Following last week’s discussion on the potential implications of higher energy prices on state and local budgets, this week we explore how record-high, headline grabbing gas prices could impact various revenue-backed municipal sectors. Arguably the most impacted sector is the transportation sector, which comprises 16% of the Bloomberg Municipal Index. While the transportation sector represents the largest revenue-backed sector of the market, the sector spans across various subsectors including toll roads, mass transit and airports, all of which we expect will have varying demand impacts associated with higher oil prices.
Toll Roads
At face value, it may seem like higher gas prices would lead to less driving and less revenue for toll road providers. However, the academic consensus is that demand for vehicle mile traveled (VMT) with respect to gasoline prices is highly inelastic in the short term, and only slightly more elastic over the long run. These demand dynamics can be attributable to the fact the majority of driving is commuter-driven, and not discretionary. Considering long-term price elasticity of -0.09* for vehicle miles traveled and a permanent increase in average gasoline price from $2.50 to $5.00, long-term VMT would be expected to fall by just 5.8%. While not insignificant, we do not deem this a material concern for the sector, which maintains generally strong coverage levels and autonomous rate setting flexibility.
Mass Transit
Conversely, mass transit demand is estimated to have demand elasticity of 0.12** (note that this a positive number rather than a negative), indicating that an increase in gasoline prices would be expected to increase ridership. Considering the same $2.50 to $5.00 per gallon permanent increase in gasoline prices we would expect to see an increase of 8.3% in ridership. An increase in demand for mass transit would be welcome considering most transit agencies are still struggling to increase ridership in a post-Covid world changed by work location and commuting habits.
Airlines
Legacy US carriers no longer “hedge” rising fuel costs, and instead pass along higher fuel prices to consumers. Over the past 10 years, airline fuel expenses ranged between 20% and 25% of airlines’ total operating costs. The recent spike in energy prices could cause fuel prices to rise to almost one-third of total operating costs, contributing to significant fare increases. Air travel is estimated to have a price elasticity of demand of -1.2***, according to NASA. Assuming a 10% increase in fares is passed along to the consumer, we would expect to see air travel demand fall by 10.8%, which is concerning but for the most part manageable in our view, given the liquidity of major US carriers including more than $14 billion of cash on the balance sheet at Delta, $15 billion at American Airlines and $20 billon at United.
While higher oil prices will have varying impacts on these transportation subsectors, Western Asset is not expecting elevated fuel prices to have a materially negative effect on the credit quality of most municipal transportation issuers. However, as a global investment manager with robust macro and analytical resources, we assess demand prospects and utilize them as inputs in identifying demand trends that can potentially lead to fundamental relative value within the transportation sector at the subsector and issuer levels.
Western Asset demand calculations reflect “arc elasticity” calculation methodology from elasticity measures provided in the following studies:
*Lawrence Berkeley National Laboratory; Elasticity of Vehicle Miles of Travel to Changes in the Price of Gasoline and the Cost of Driving in Texas; June 28, 2021
**American Public Transportation Association; Public Transportation Protects Americans From Gas Price Volatility; May 2012
***NASA; An Airline-Based Multilevel Analysis of Airfare Elasticity of Passenger Demand; 2002


