Macros, Markets and Munis
Municipals posted positive returns last week and outperformed taxable fixed-income as markets focused on the Federal Open Market Committee meeting. The Federal Reserve held its target rate range steady at 3.50%-3.75% but delivered a hawkish tone. Three Committee members dissented in favor of a 25-basis-point rate increase, reinforcing higher-for-longer expectations. Second-quarter real GDP grew at a 1.5% annualized rate, down from 2.1% in the first quarter and below consensus expectations. June core Personal Consumption Expenditures (PCE) inflation moderated to 0.1% month-over-month (MoM) from 0.3% in May but remained elevated at 3.3% year-over-year (YoY). Oil prices declined more than 10% despite the ongoing US-Iran conflict. The Treasury curve steepened as yields fell 4 basis points (bps) in shorter maturities and rose 12 bps in the longest maturities. High-grade municipal yields were relatively unchanged and generally outperformed taxable fixed-income. Meanwhile, supply remained elevated as the forward calendar increased. This week we touch on historic July weakness in the muni market.
Supply Remained Elevated Amid a Building Forward Calendar
Fund Flows ($761 million of net inflows): During the week ending July 29, weekly reporting municipal mutual funds recorded $761 million of net inflows, marking a 15th consecutive week of inflows, according to Lipper. The intermediate-term category led demand with $801 million of inflows, while the short-term category recorded $59 million. The long-term category reported a second consecutive week of outflows, totaling $74 million. Last week’s inflows bring year-to-date (YTD) inflows to $59 billion.
Supply (YTD supply of $352 billion; up 9% YoY): The muni market recorded $11 billion of new -issue supply last week, down 7% from the prior week’s level. YTD new-issue supply of $352 billion is 9% higher than the prior record-issuance year, with tax-exempt issuance up 10% YoY and taxable issuance up 1%. This week’s calendar is expected to jump to $19 billion. Largest deals include $1.5 billion State of New York and $1.1 billion Intermountain Healthcare Obligated Group (CO) transactions.
This Week in Munis: Historic July Weakness
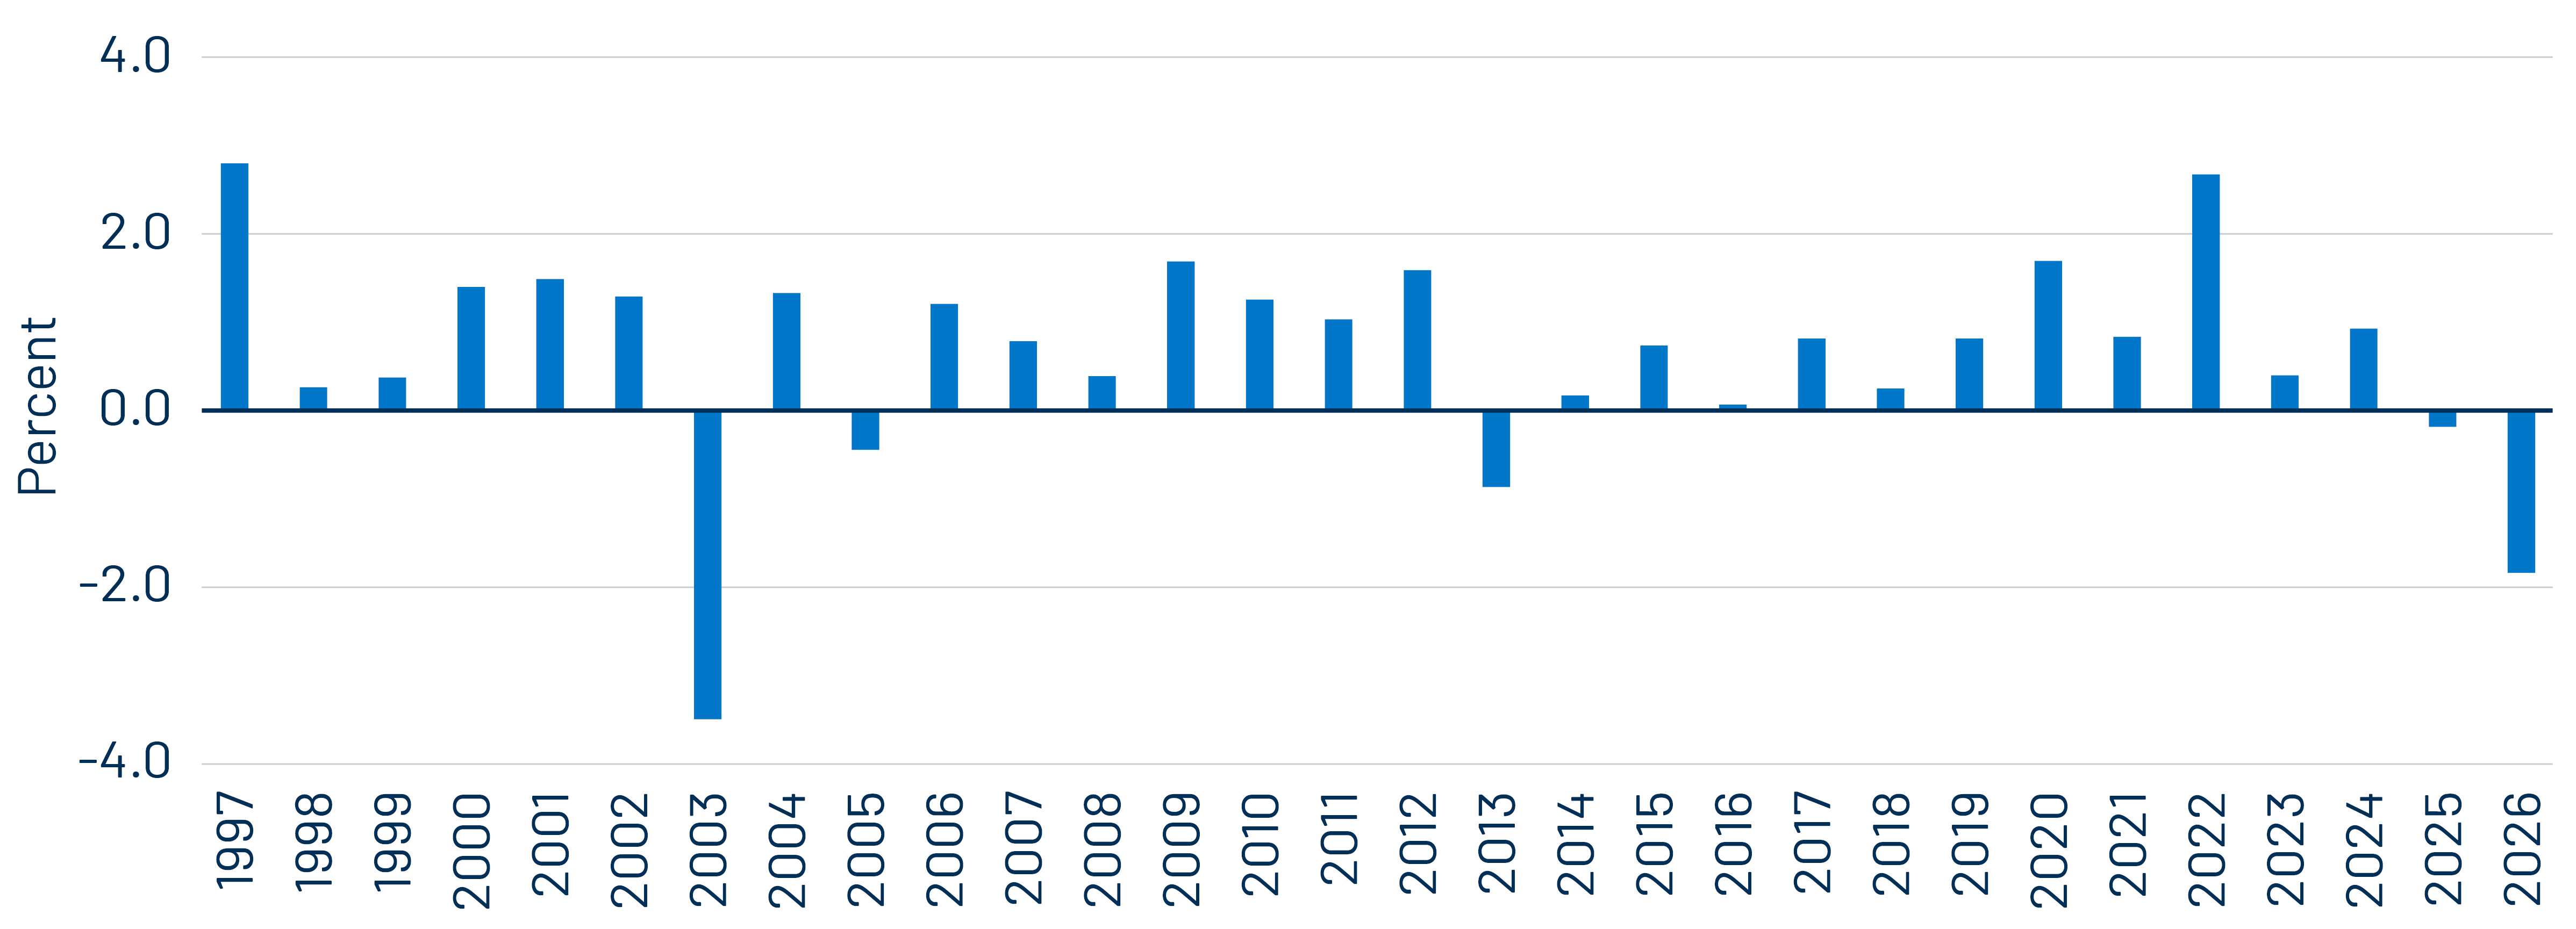
Municipals posted their weakest July return in more than two decades. The Bloomberg Municipal Bond Index returned -1.85%, underperforming most investment-grade fixed-income sectors and marking just the fifth negative July return over the past 30 years. July is typically supported by lighter issuance and strong reinvestment demand. Longer-duration bonds lagged amid persistent inflation uncertainty and elevated supply, while higher-quality cohorts also underperformed as continued credit-spread tightening favored lower-rated segments. Despite the July decline, the Bloomberg Municipal Bond Index return remained positive at 0.43% YTD, compared with returns of -0.69% for the U.S. Aggregate, -0.84% for the Treasury Index and -0.83% for the Corporate Index.
Munis Posted the Weakest Returns in Over Two Decades in July
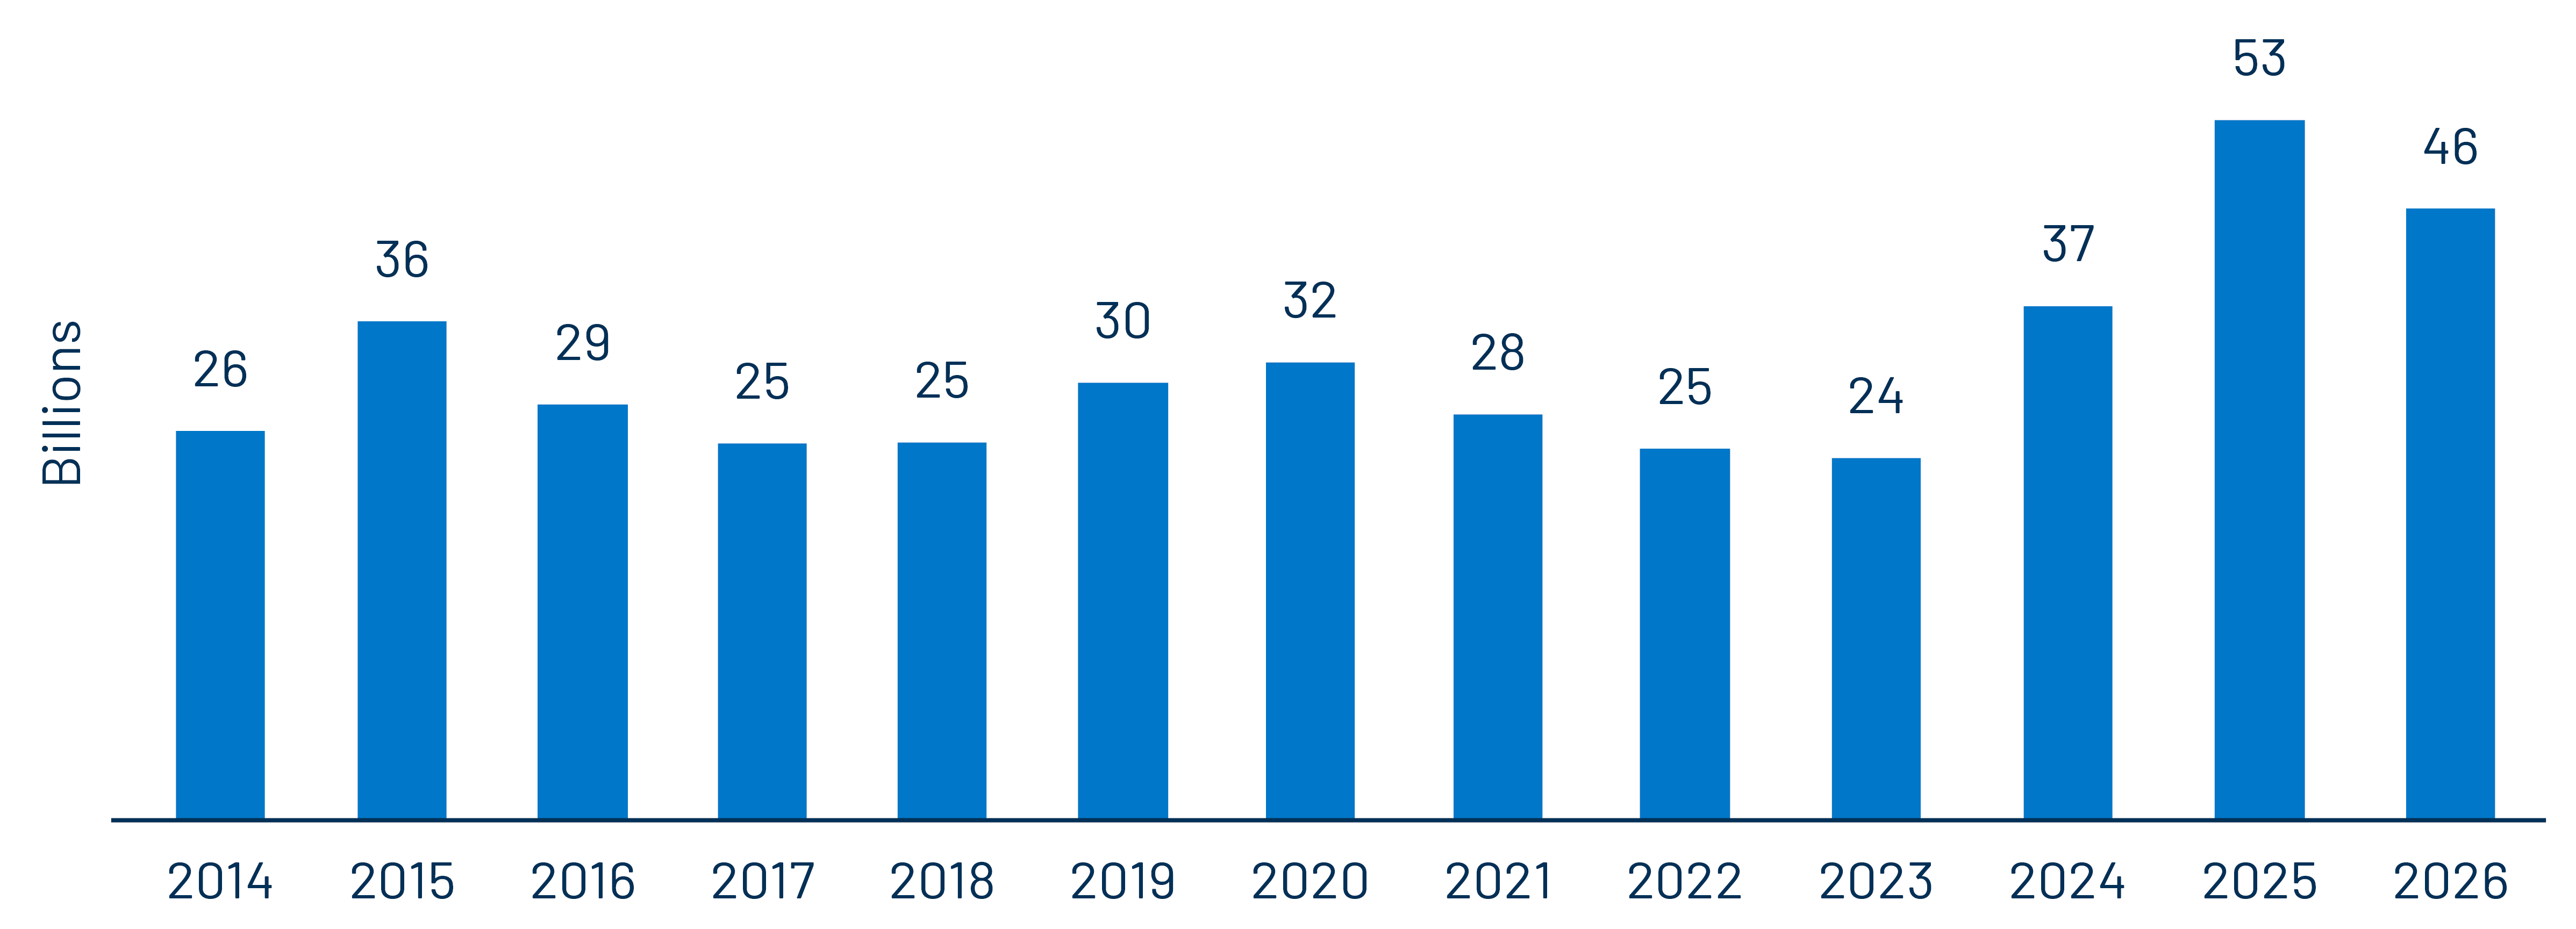
Elevated issuance and a rising forward calendar outweighed otherwise steady fund demand. July municipal issuance totaled approximately $47 billion, down 25% from June but still 28% above the prior 10-year July average. The Bloomberg 30-day forward supply calendar increased from $12.5 billion at the beginning of the month to $24 billion by month-end, underscoring the persistent pace of record issuance in 2026. Meanwhile, combined Lipper and ICI estimates indicate that municipal funds recorded more than $9 billion of net inflows during July, roughly in line with June.
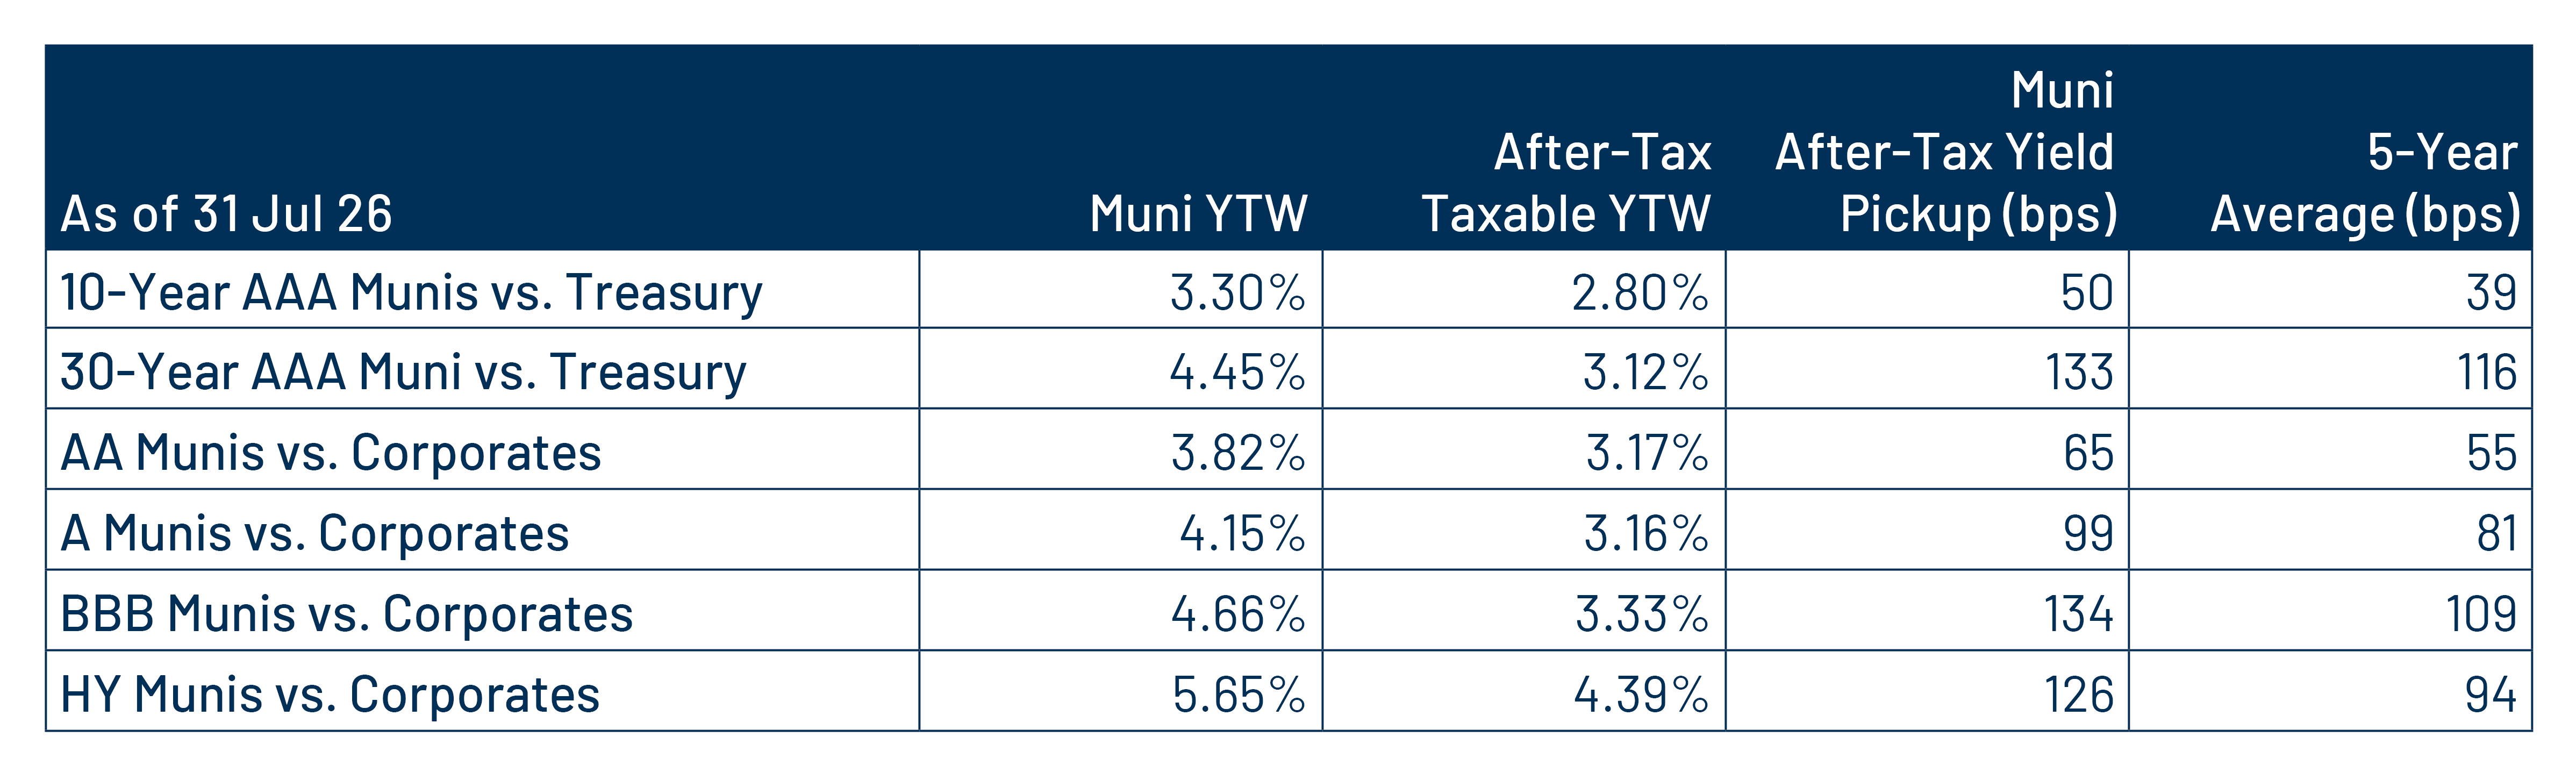
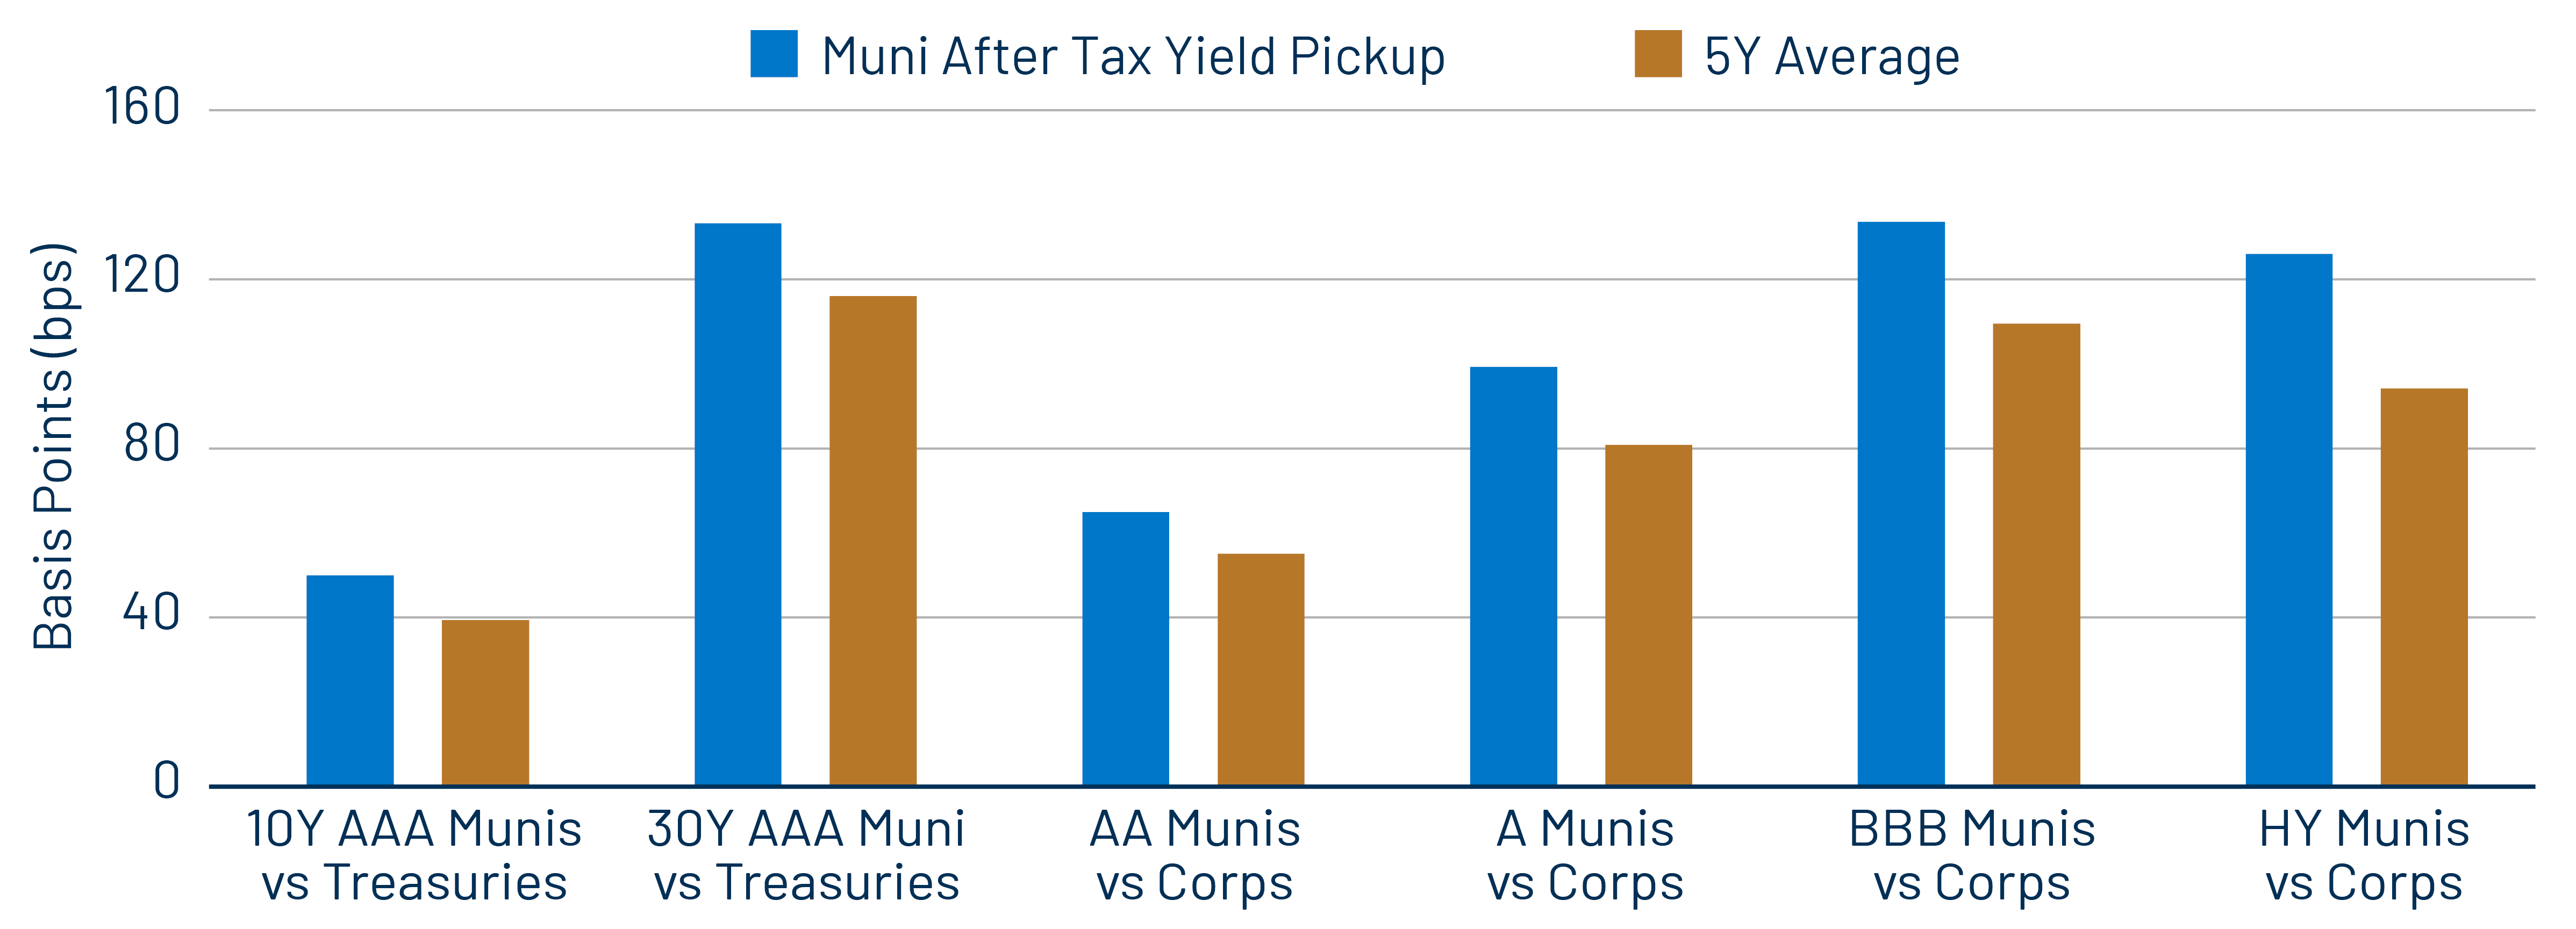
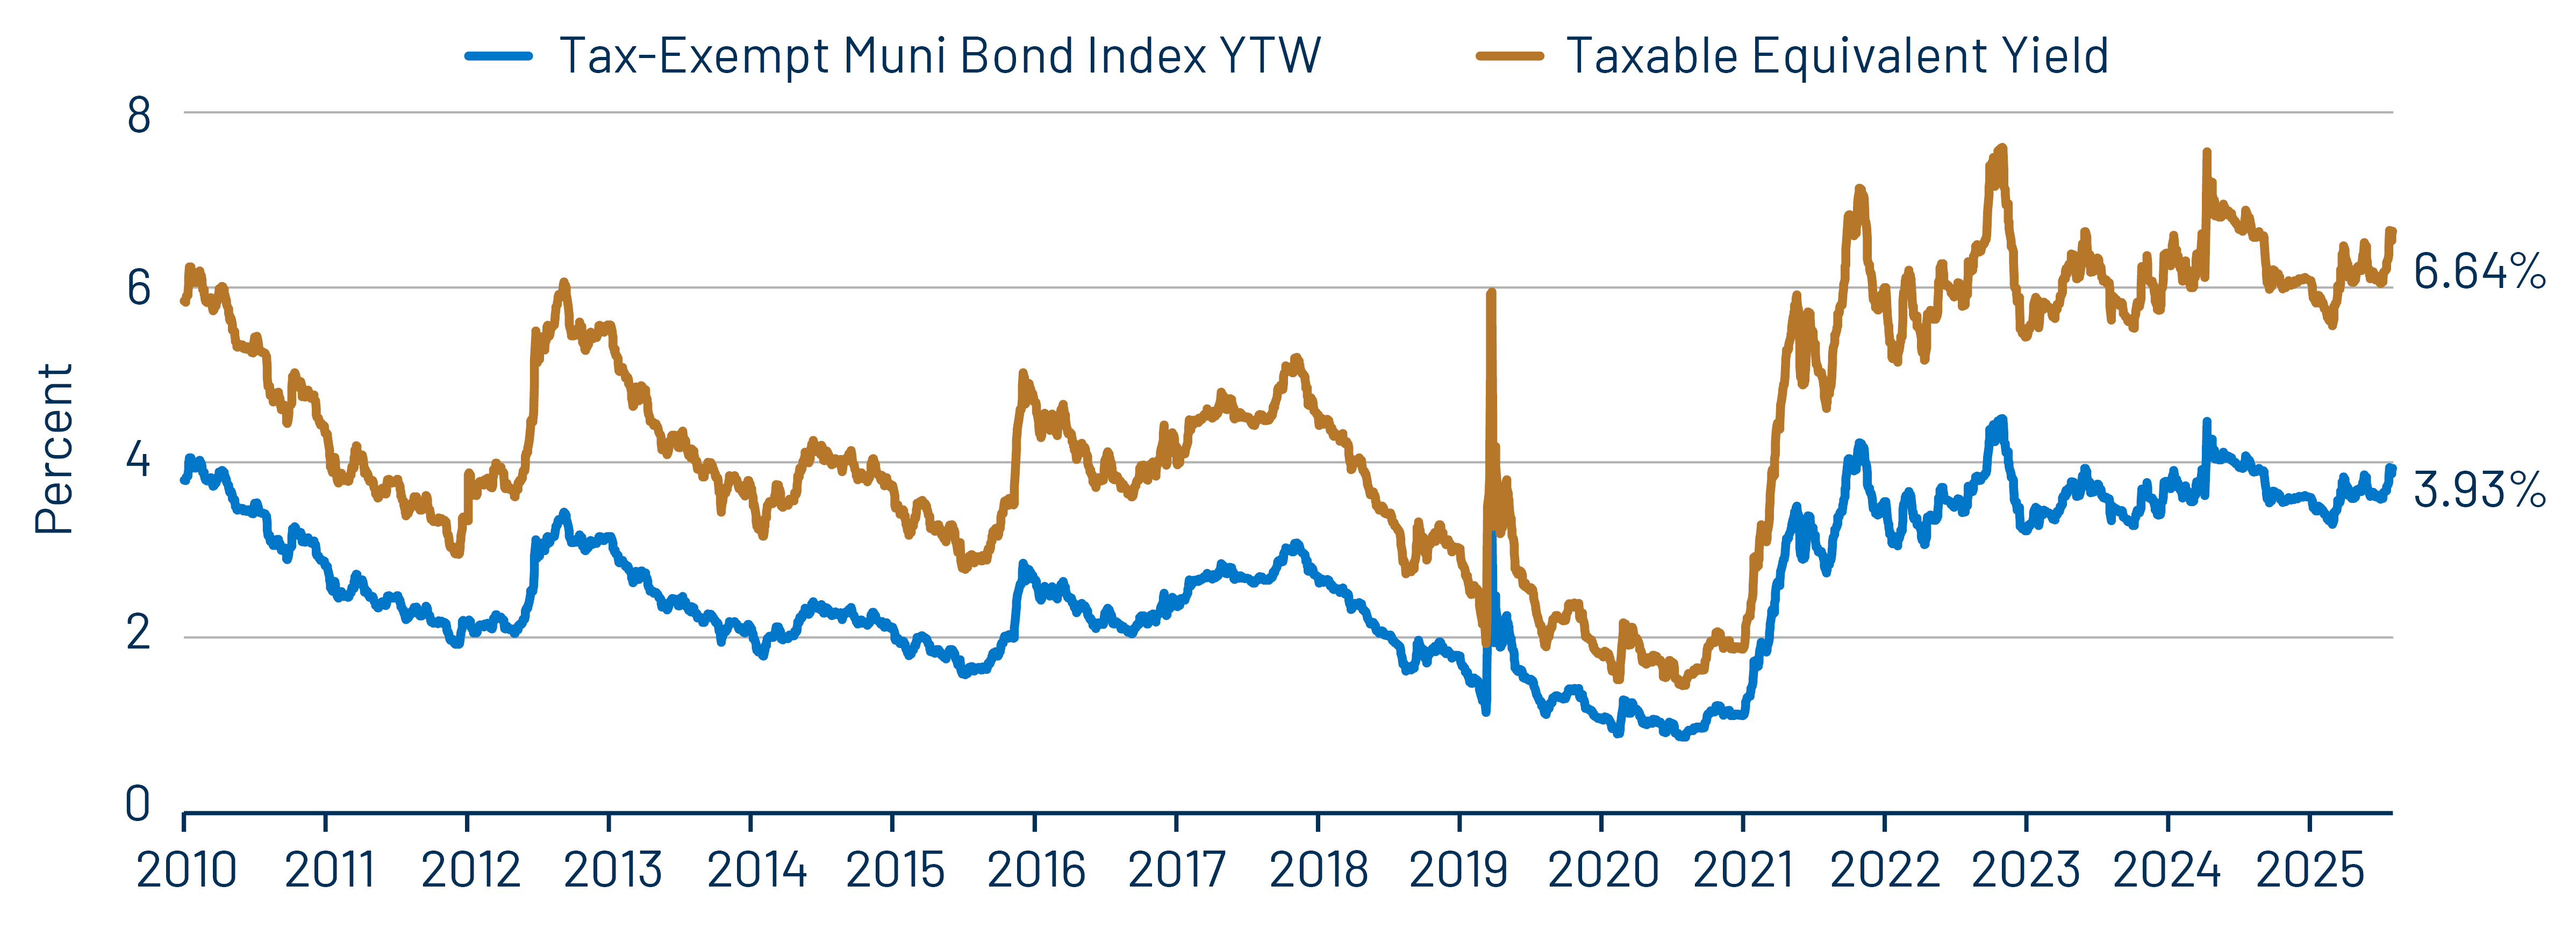
The July selloff lifted municipal tax-exempt income levels and improved relative valuations. The Bloomberg Municipal Bond Index yield-to-worst rose to a year-to-date high of 3.93%, equivalent to 6.64% on a taxable-equivalent basis for investors subject to the highest marginal tax rate. That compares favorably with yields of 4.57% for the Bloomberg U.S. Treasury Index and 5.46% for the Bloomberg Corporate Index. After-tax yield advantages across maturities and credit-quality cohorts remain above their five-year averages, supporting more attractive entry points for the municipal asset class, in our view, amid continued economic uncertainty.
Municipal Credit Curves and Relative Value
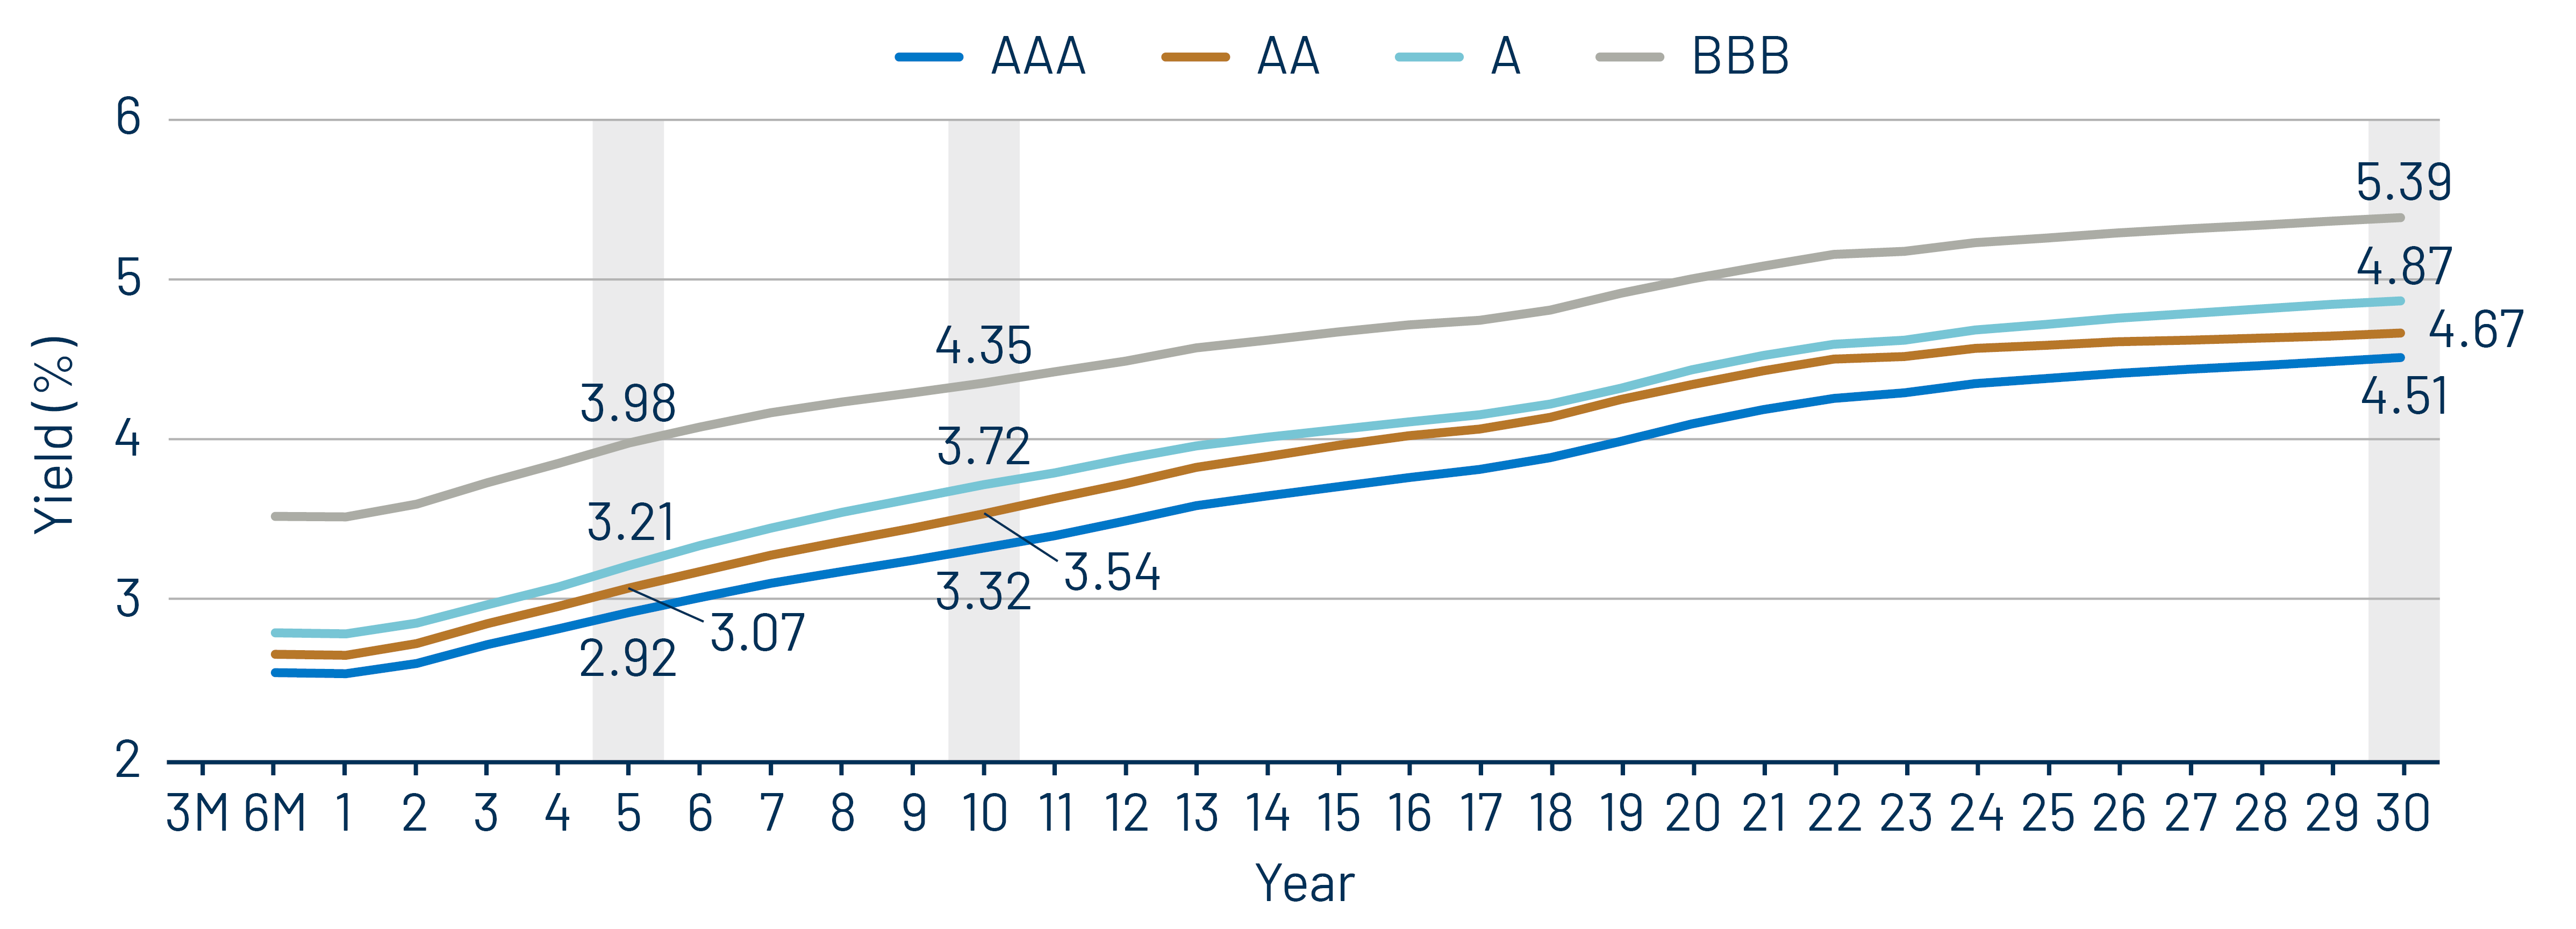
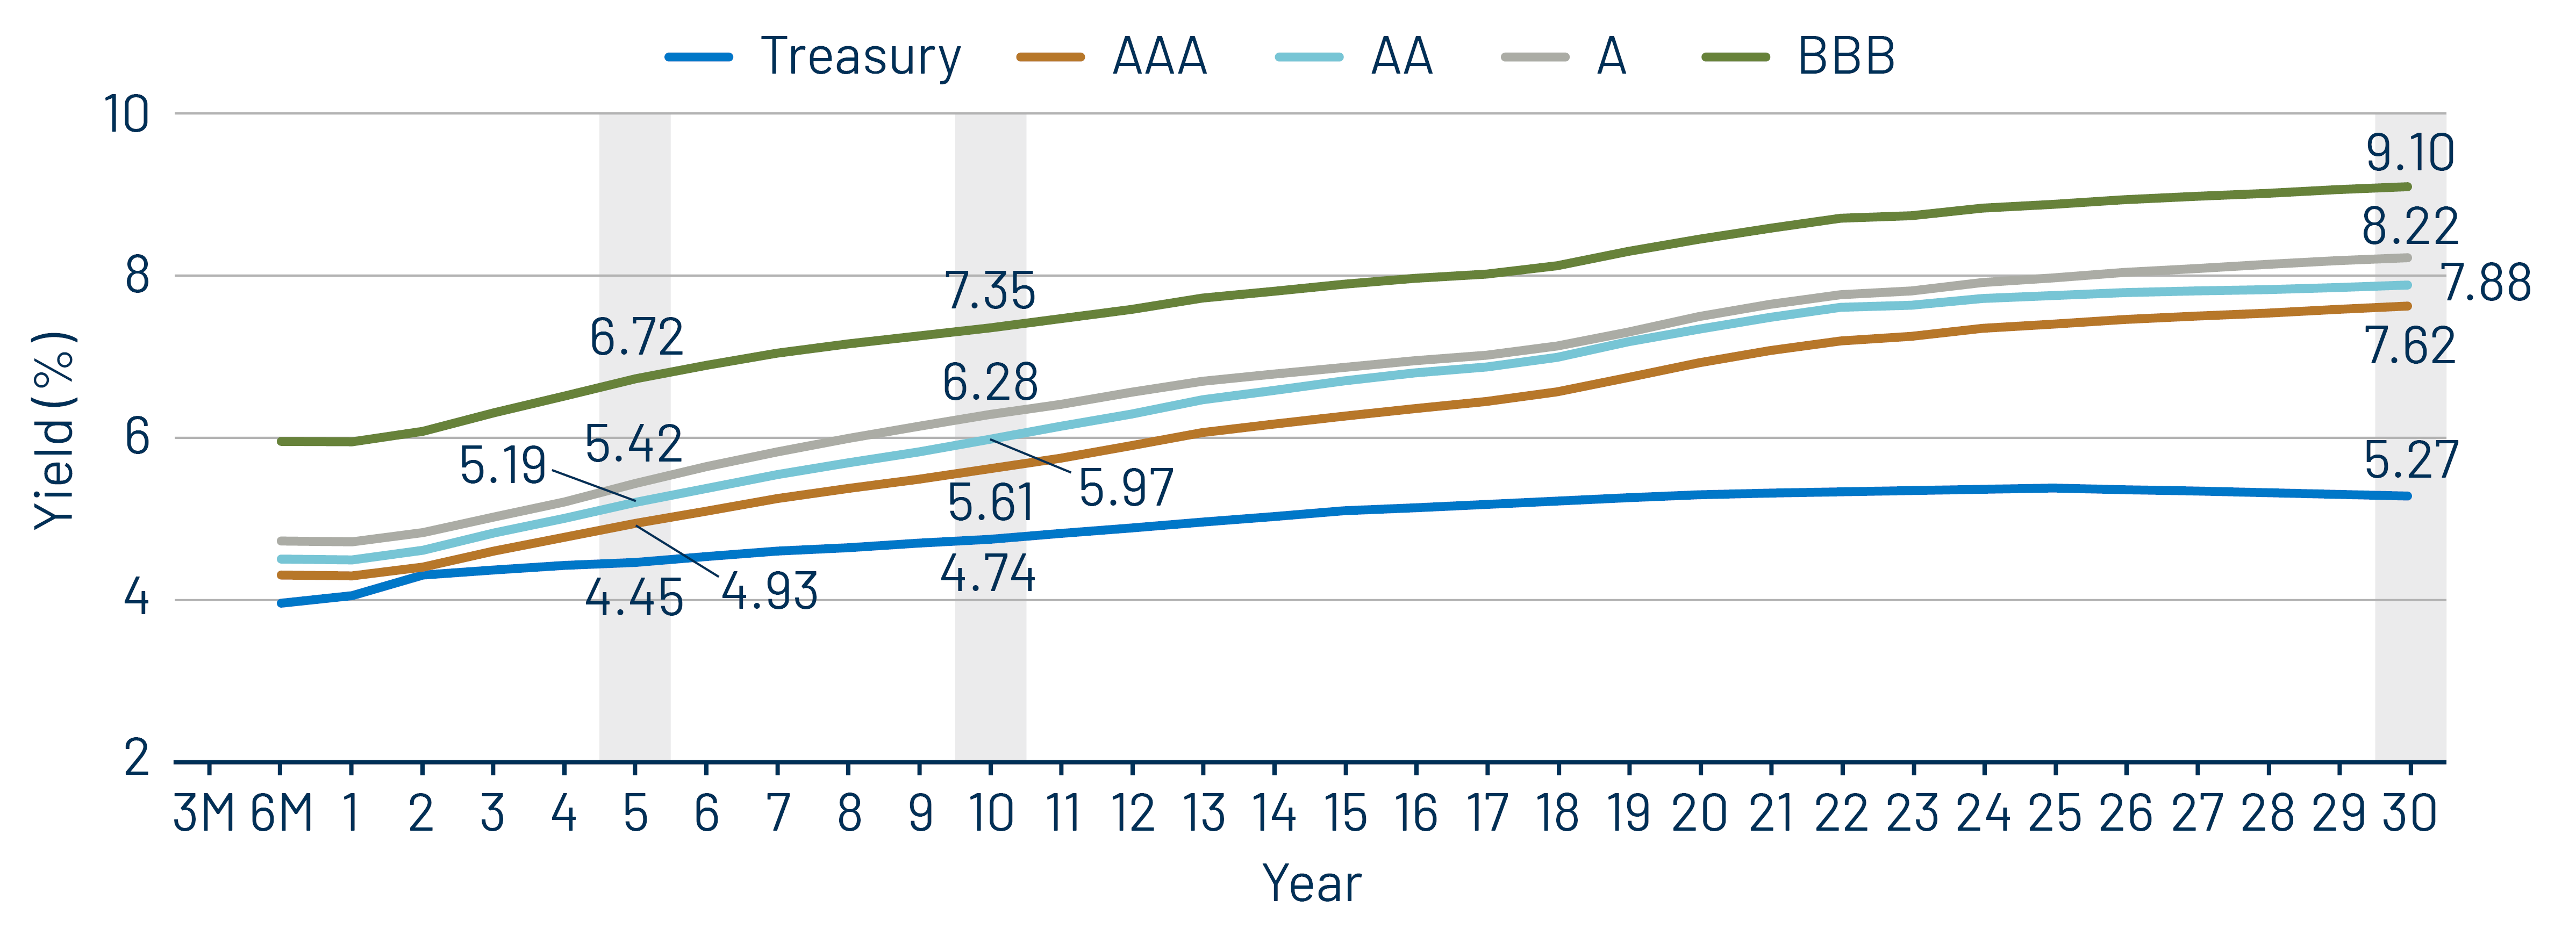
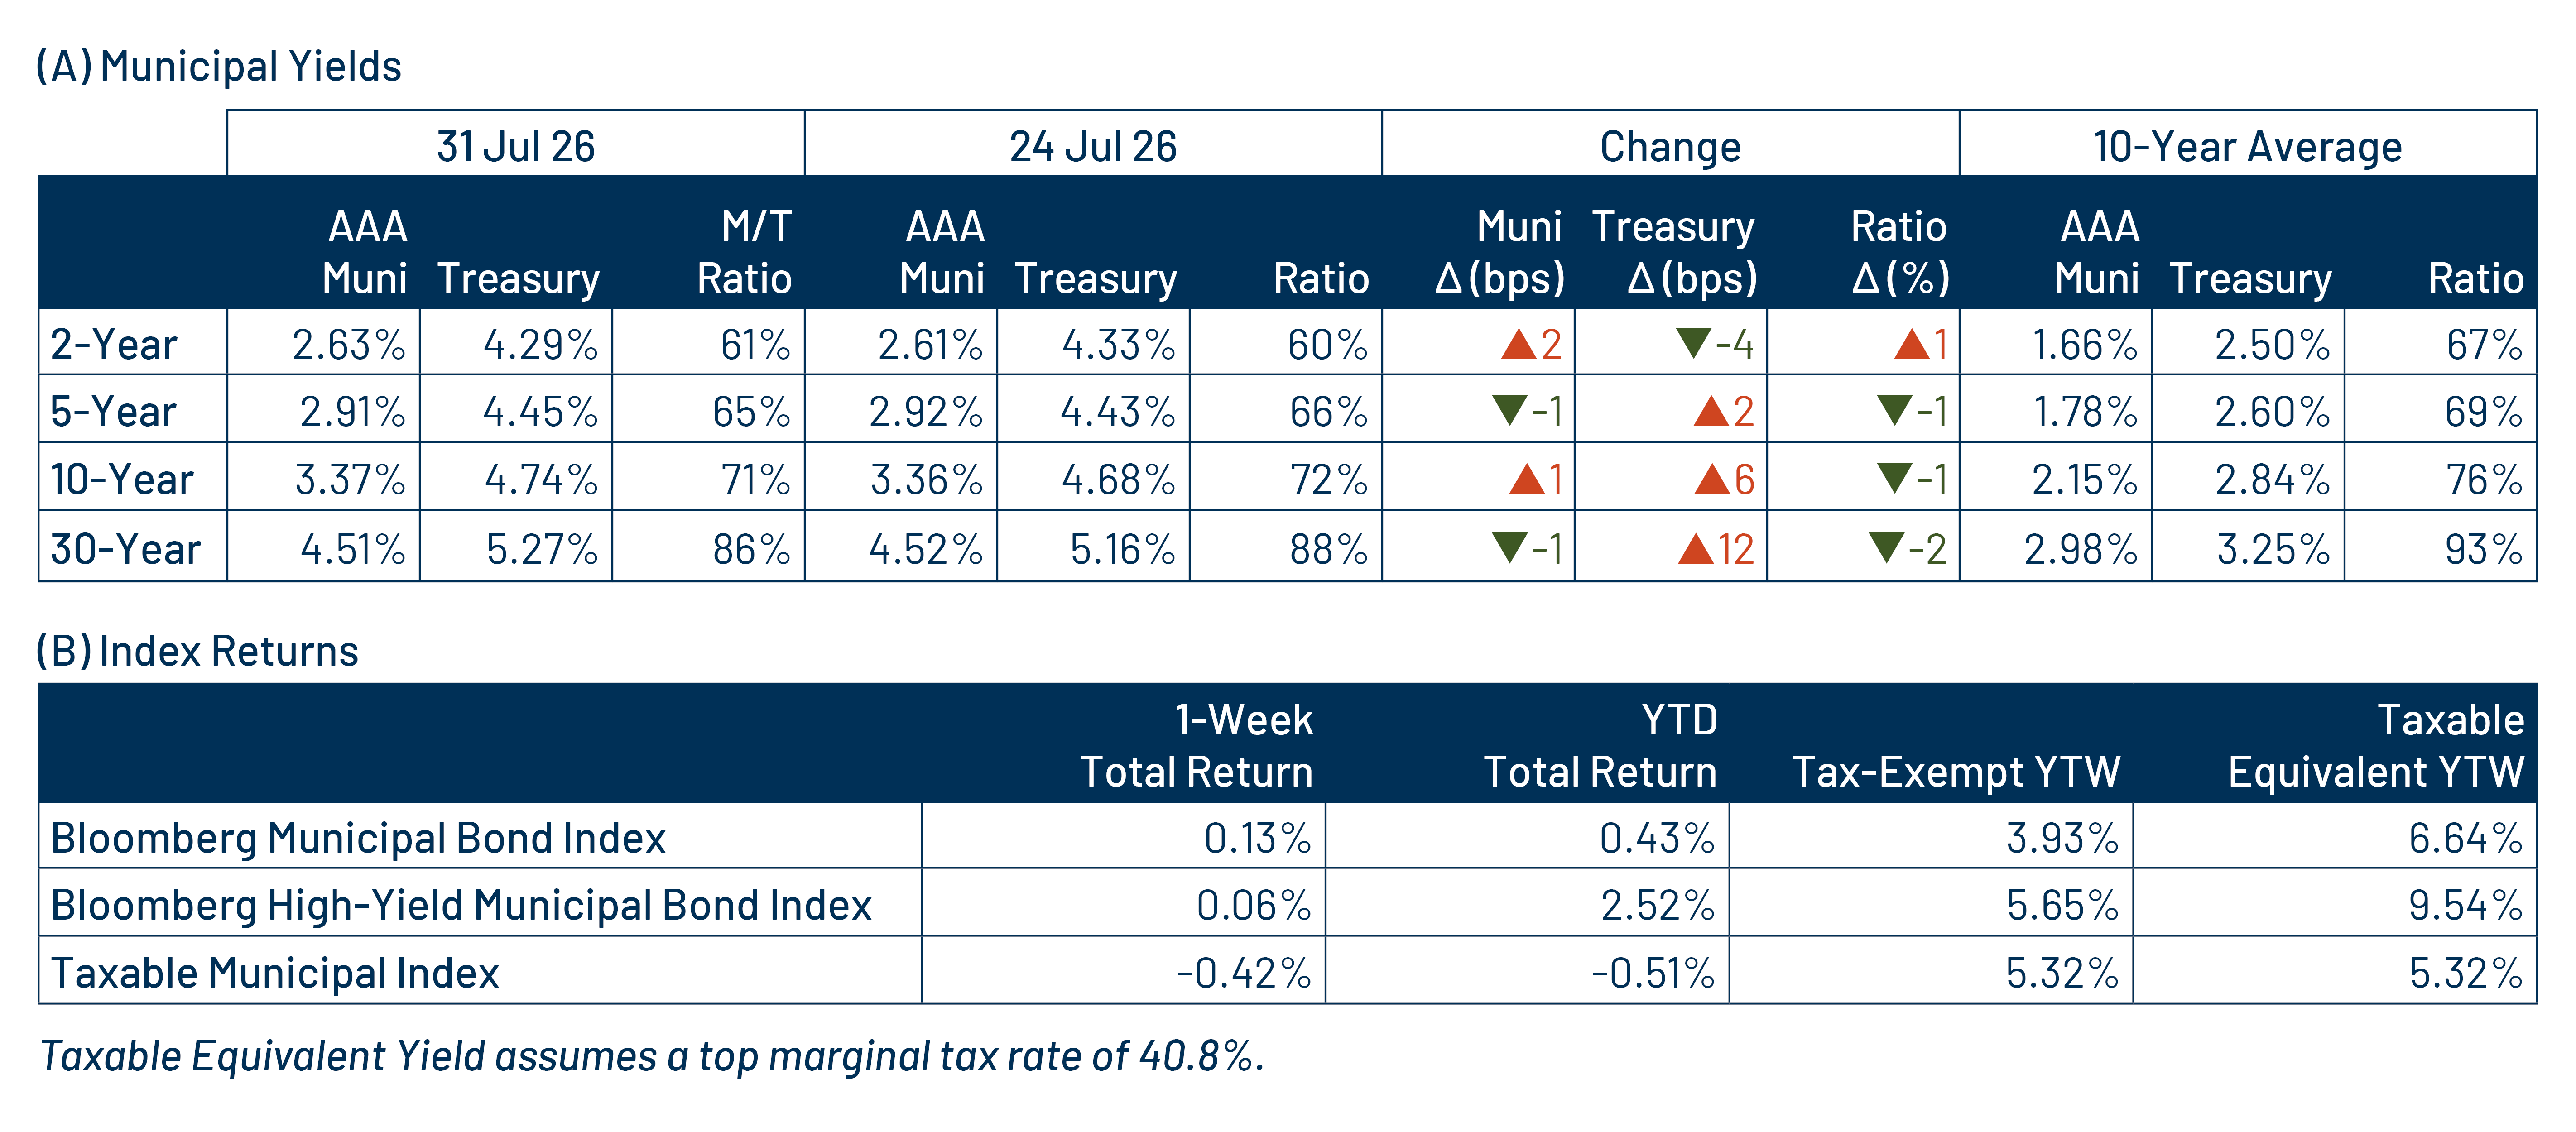
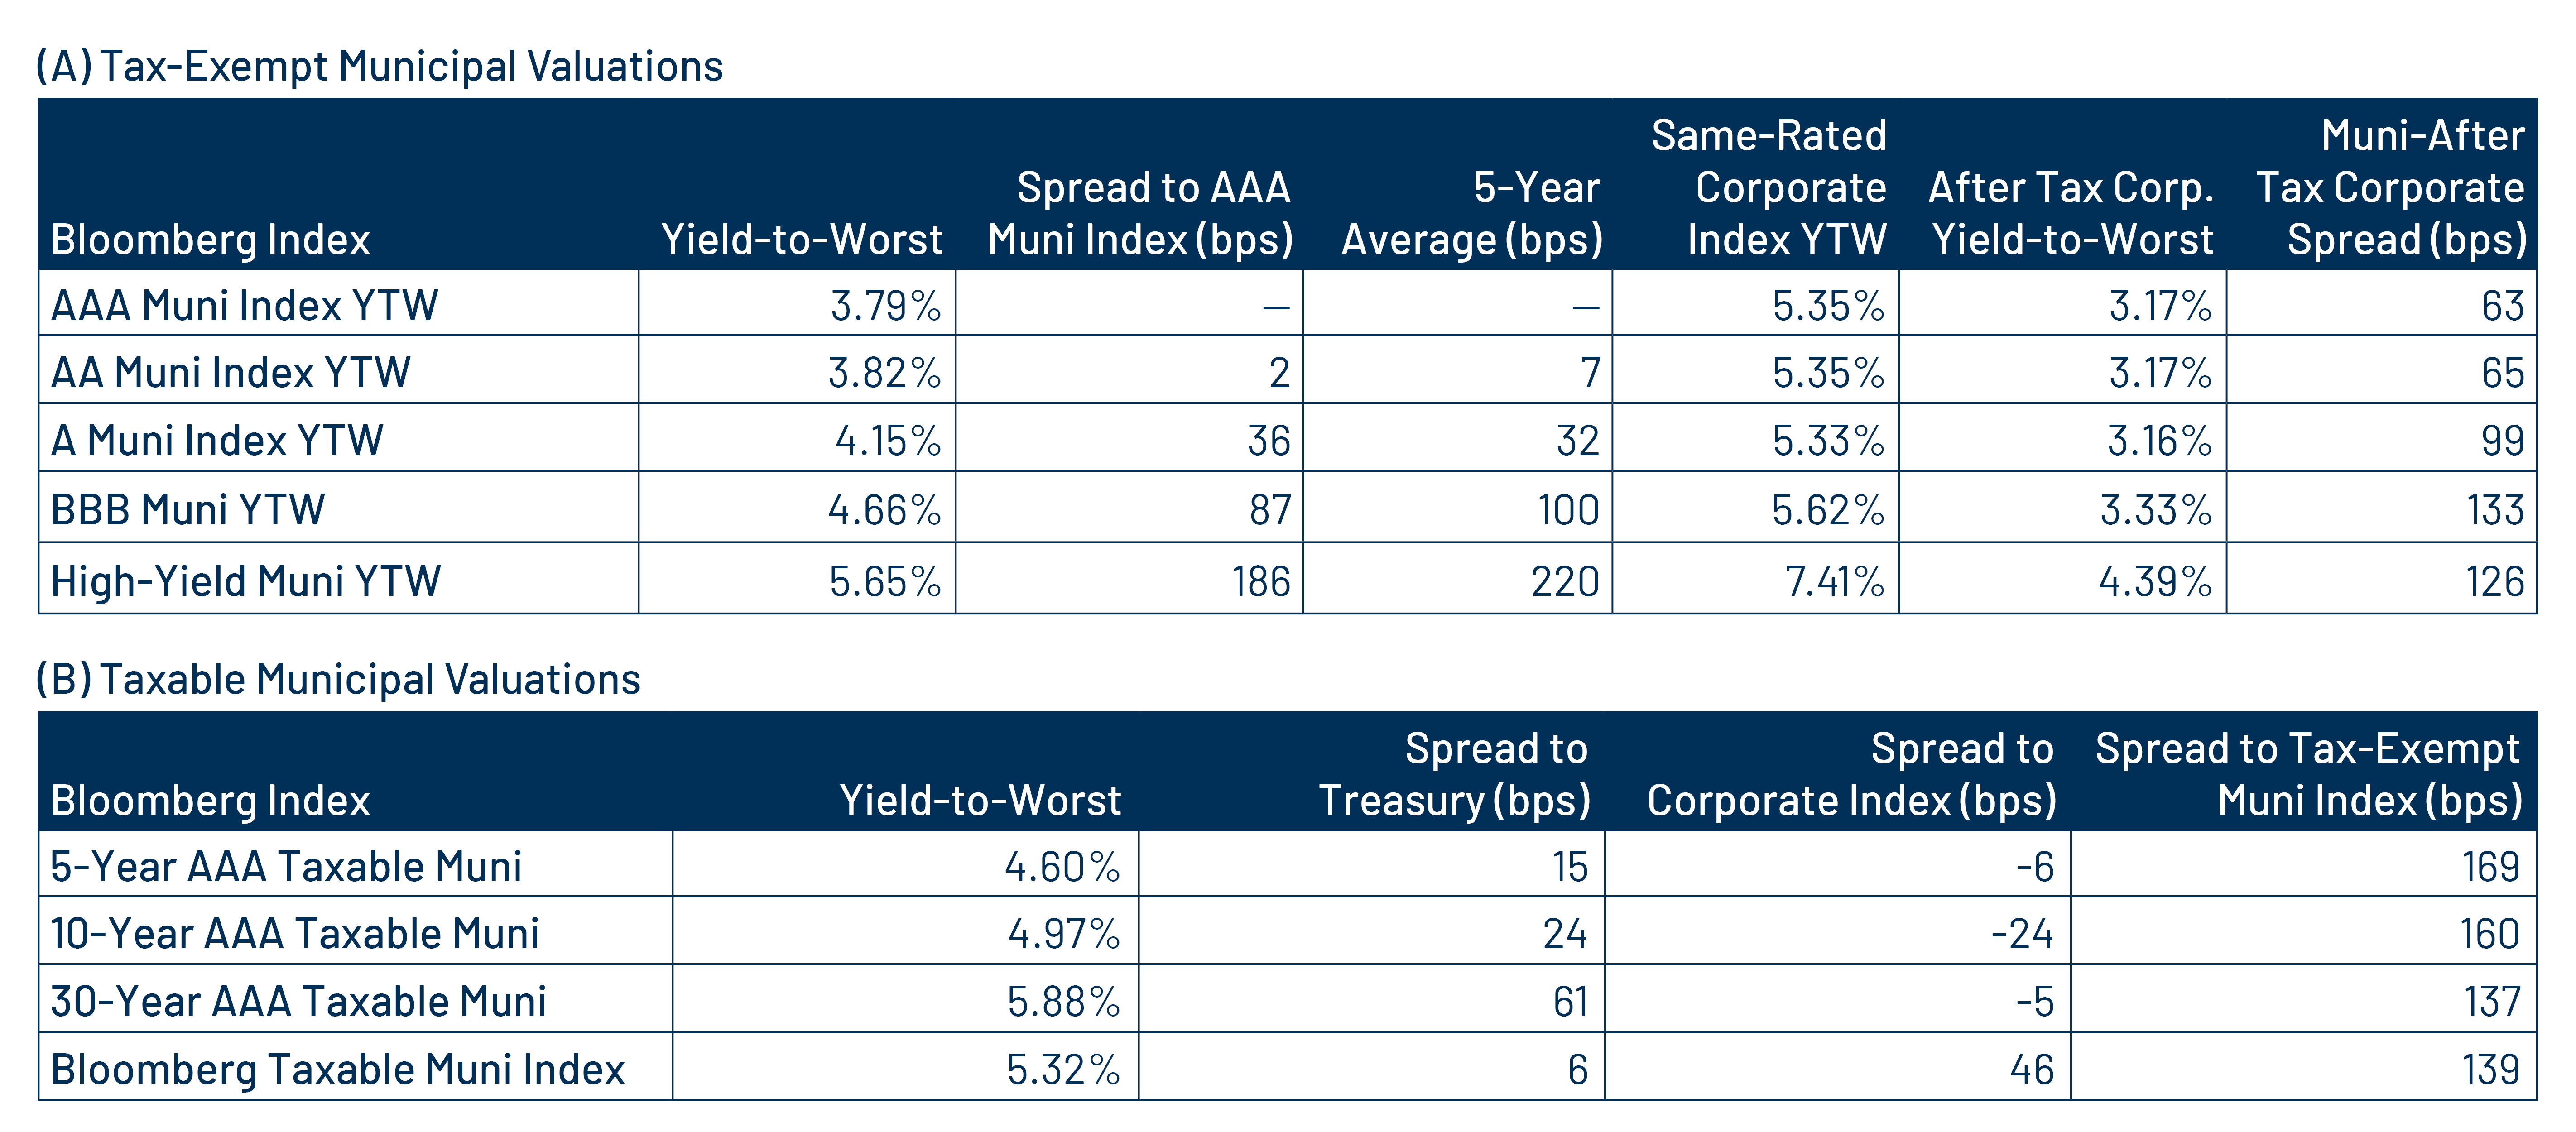
Theme 1: Municipal taxable-equivalent yields remain elevated relative to historical averages.
Theme 2: Munis offer attractive after-tax yield pickup vs. taxable alternatives.
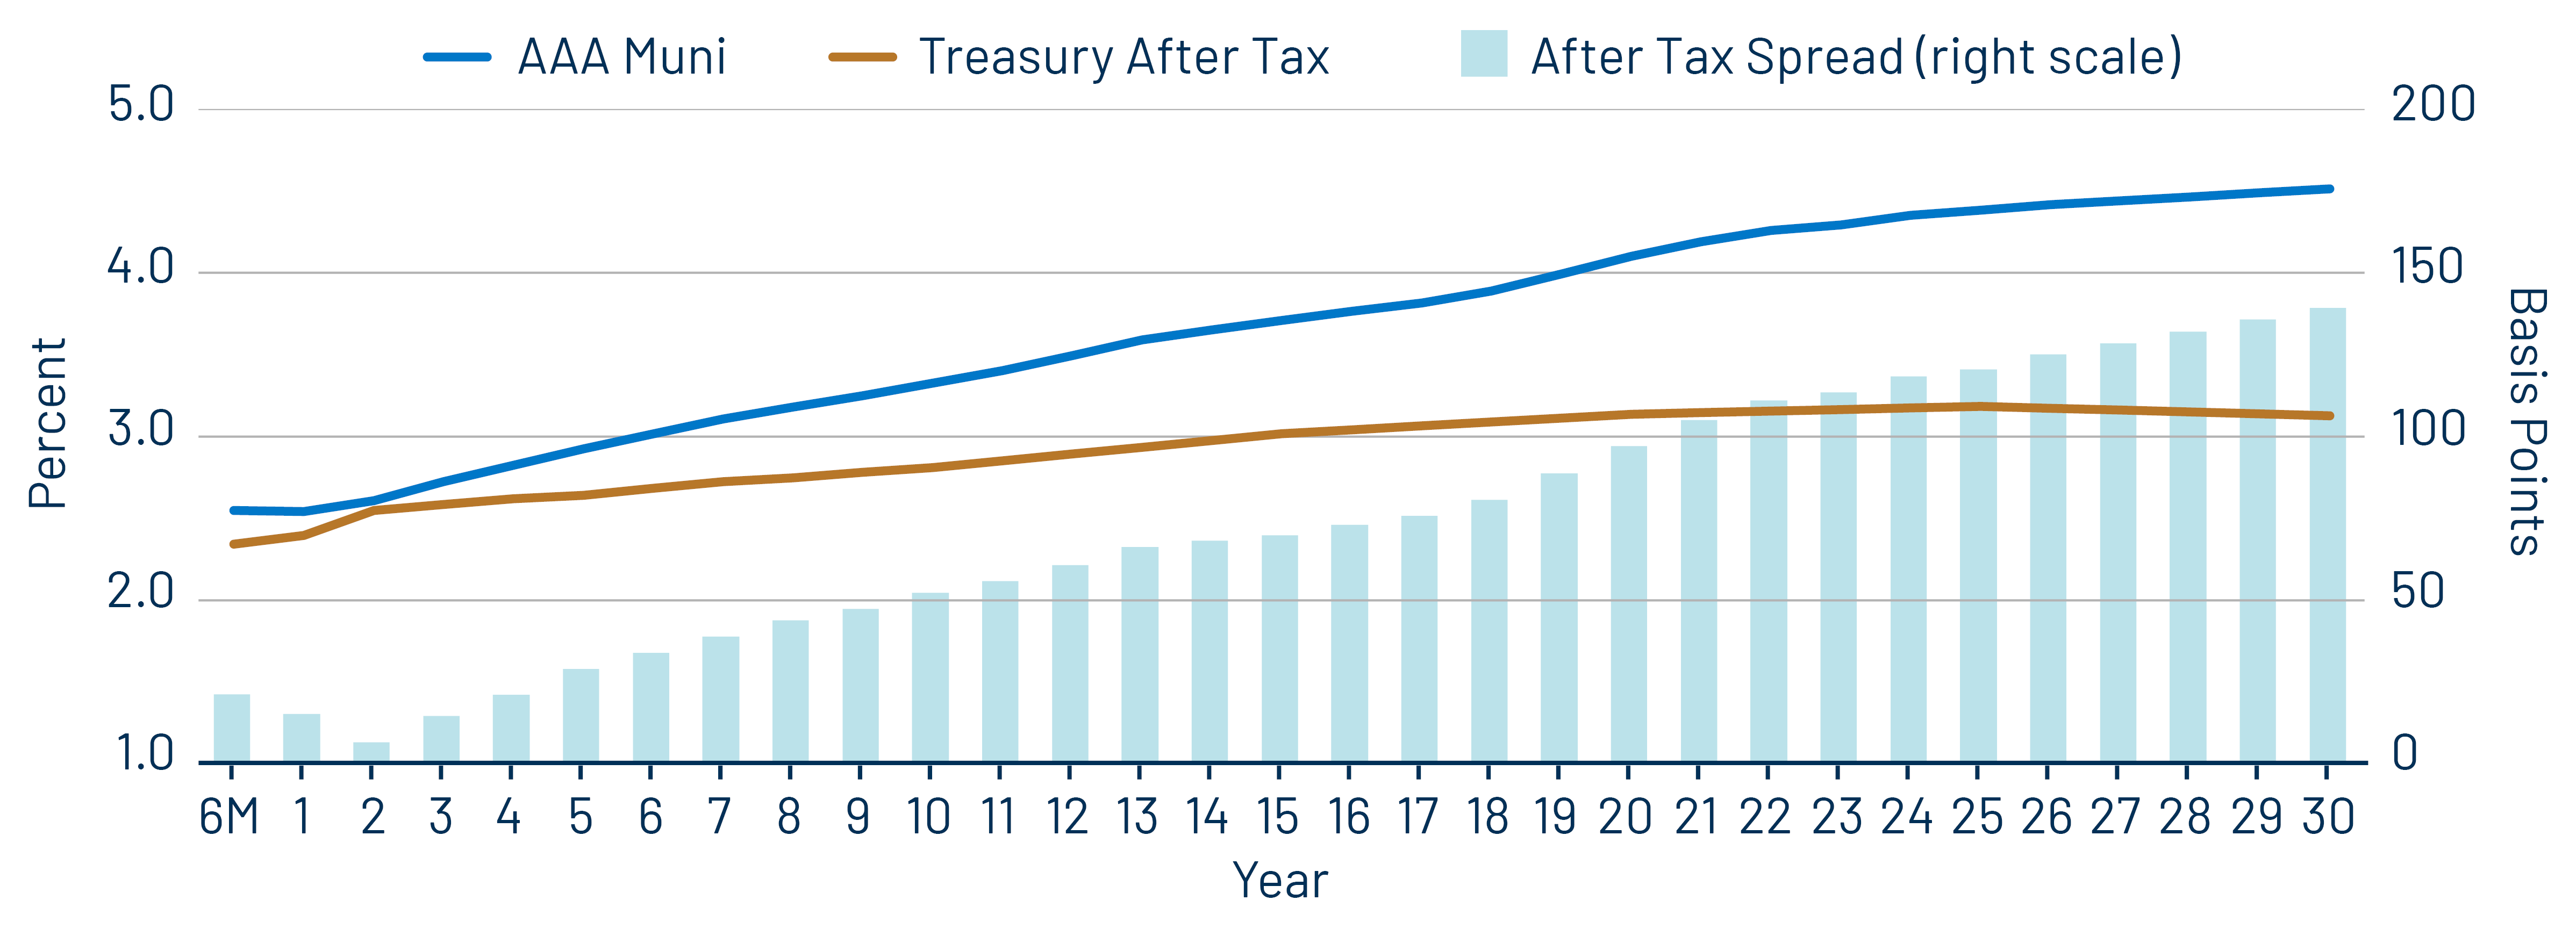
Theme 3: The muni curve remains steep and offers relative value in longer maturities.