マーケット・ブログ
MARKETS
30 September 2025

Weekly Municipal Monitor—Long-End Rallies

By Sam Weitzman

Macros, Markets and Munis

Munis posted negative returns and underperformed taxable fixed-income last week as Treasuries moved higher across the yield curve. High-grade munis moved higher in sympathy with Treasuries but generally underperformed as technicals weakened amid fund outflows and an elevated supply. From an economic data perspective, inflation showed signs of continued cooling last week with core Personal Consumption Expenditures (PCE) increasing 0.2% month-over-month in August, down from 0.3% the prior month. However, stronger-than-anticipated data associated with increasing home sales, higher durable goods orders and upward revisions to 2Q25 GDP data quelled fixed-income market optimism and lowered the elevated expectations of year-end rate cuts. This week we touch on the long-end rally observed so far this month.

Technicals Weaken Amid Heavy New-Issue Supply and Modest Fund Outflows

Fund Flows ($18 million of net outflows): During the week ending September 24, weekly reporting municipal mutual funds recorded a modest $18 million of net outflows, according to Lipper. Long-term funds recorded the majority of the outflow at $346 million. Intermediate and short-term categories recorded $255 million and $29 million of inflows, respectively. Last week’s outflows led year-to-date (YTD) inflows lower to $29 billion.

Supply (YTD supply of $431 billion; up 21% YoY): The muni market recorded $18 billion of new-issue supply last week, over double the prior-week’s level. YTD new-issue supply of $431 billion is 21% higher than the prior year, with tax-exempt issuance up 22% year-over-year (YoY) and taxable issuance up 1% from prior year levels. This week’s calendar is expected to decline to $9 billion. The largest deals include $1.7 billion Texas Transportation Financing Corporation and $813 million Los Angeles Department of Water and Power (Power System) transactions.

This Week in Munis: Long-End Rallies

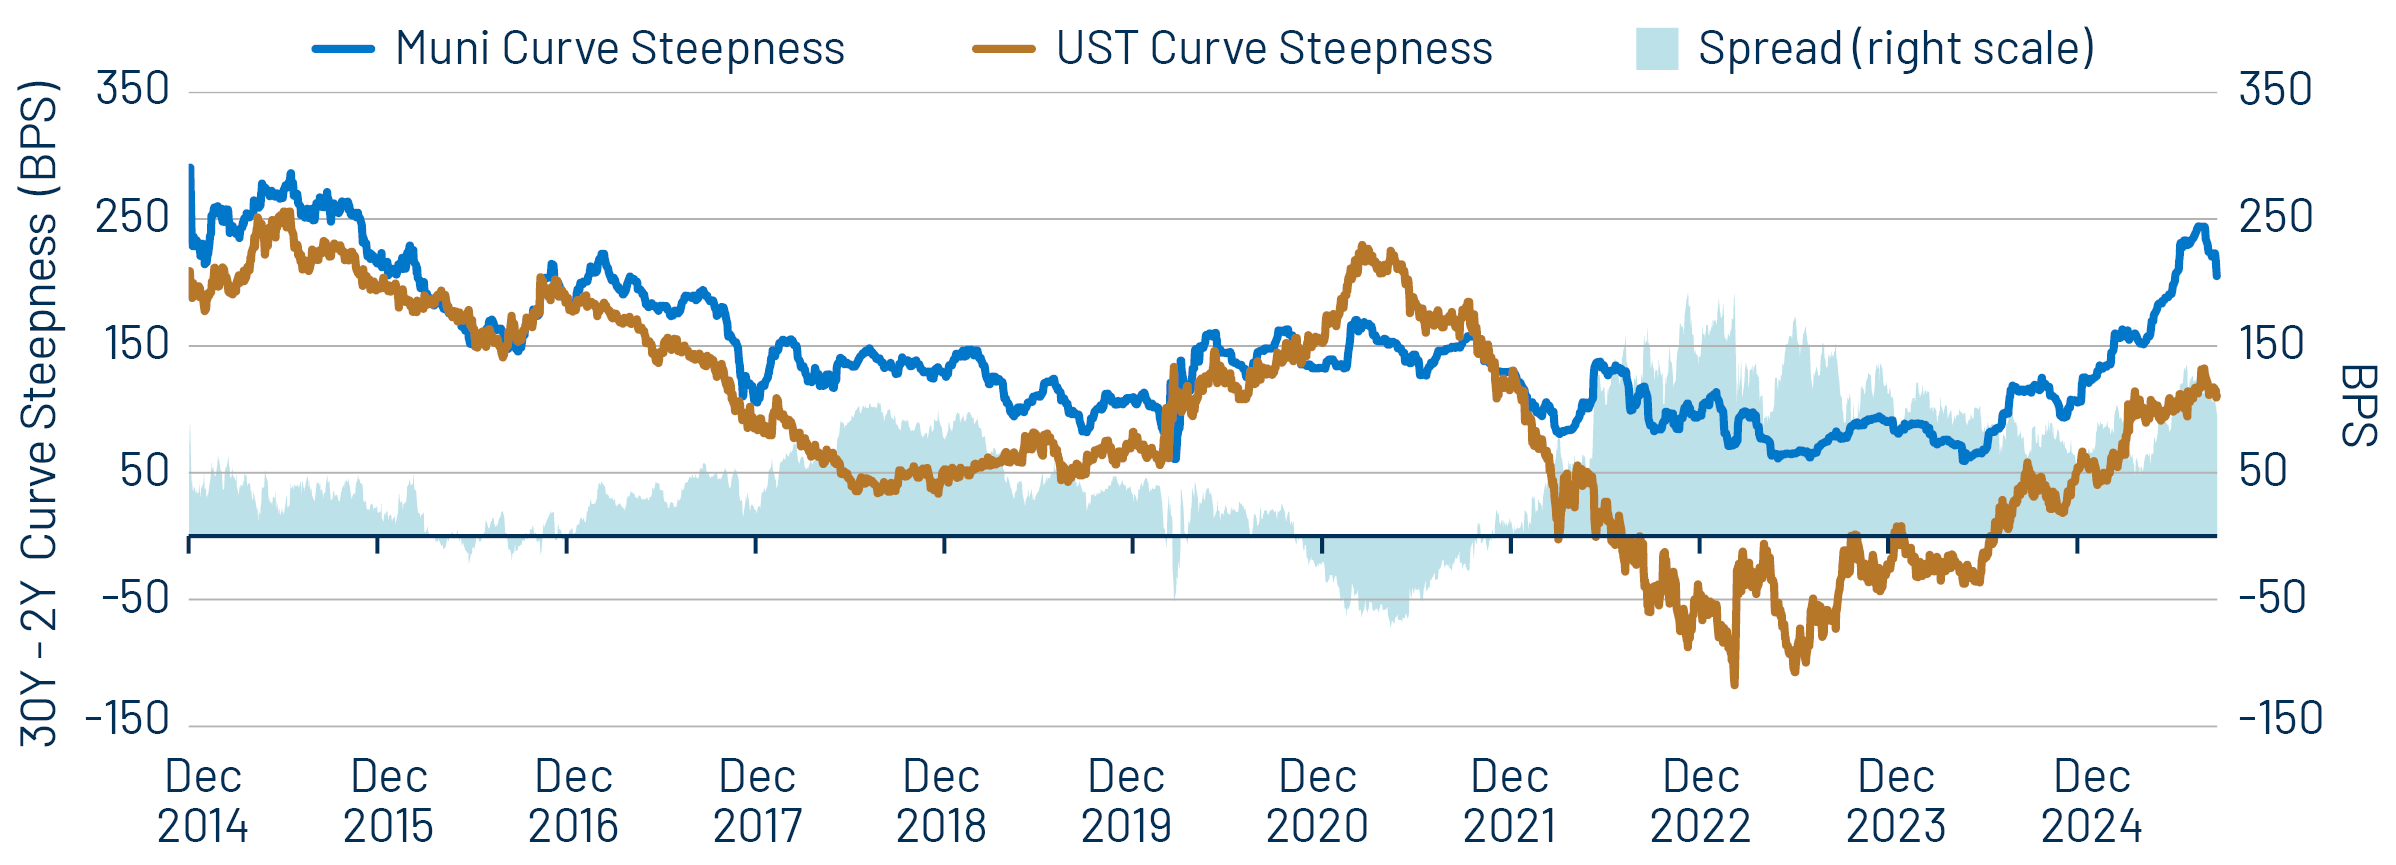
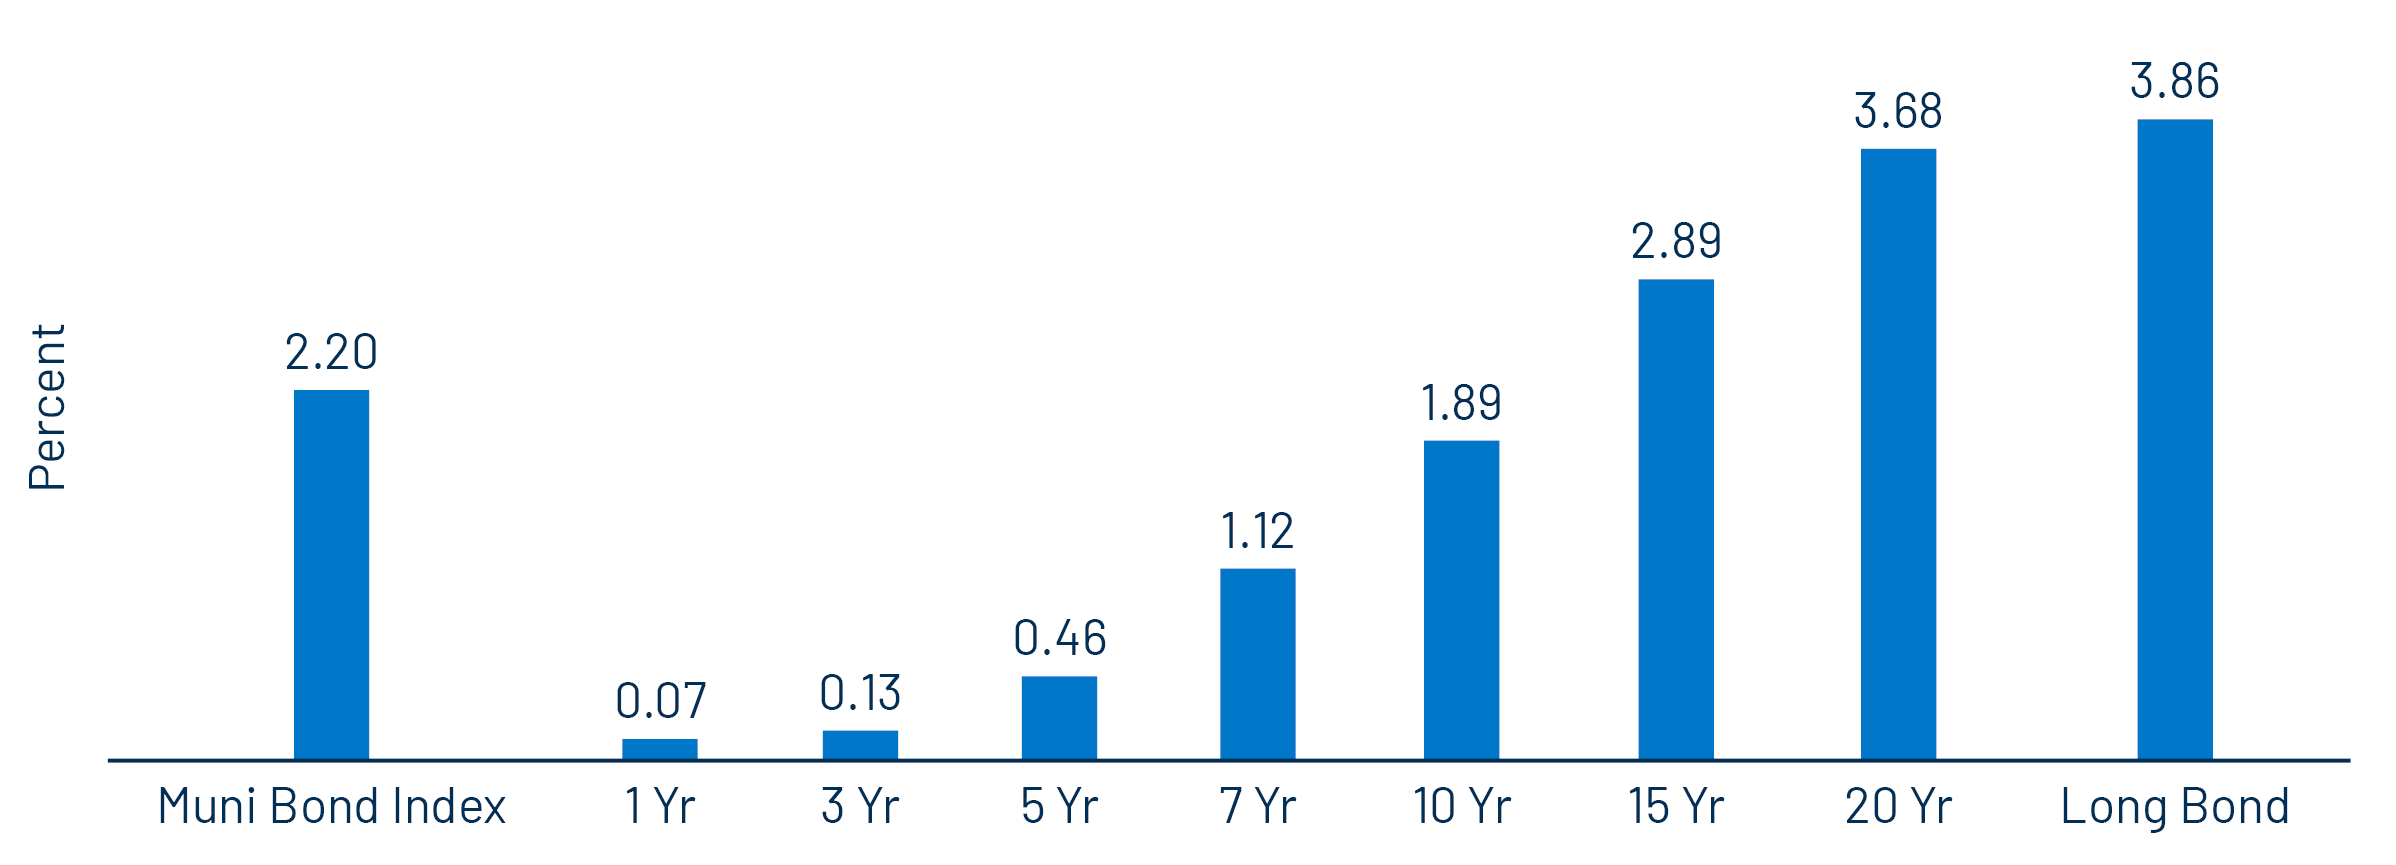
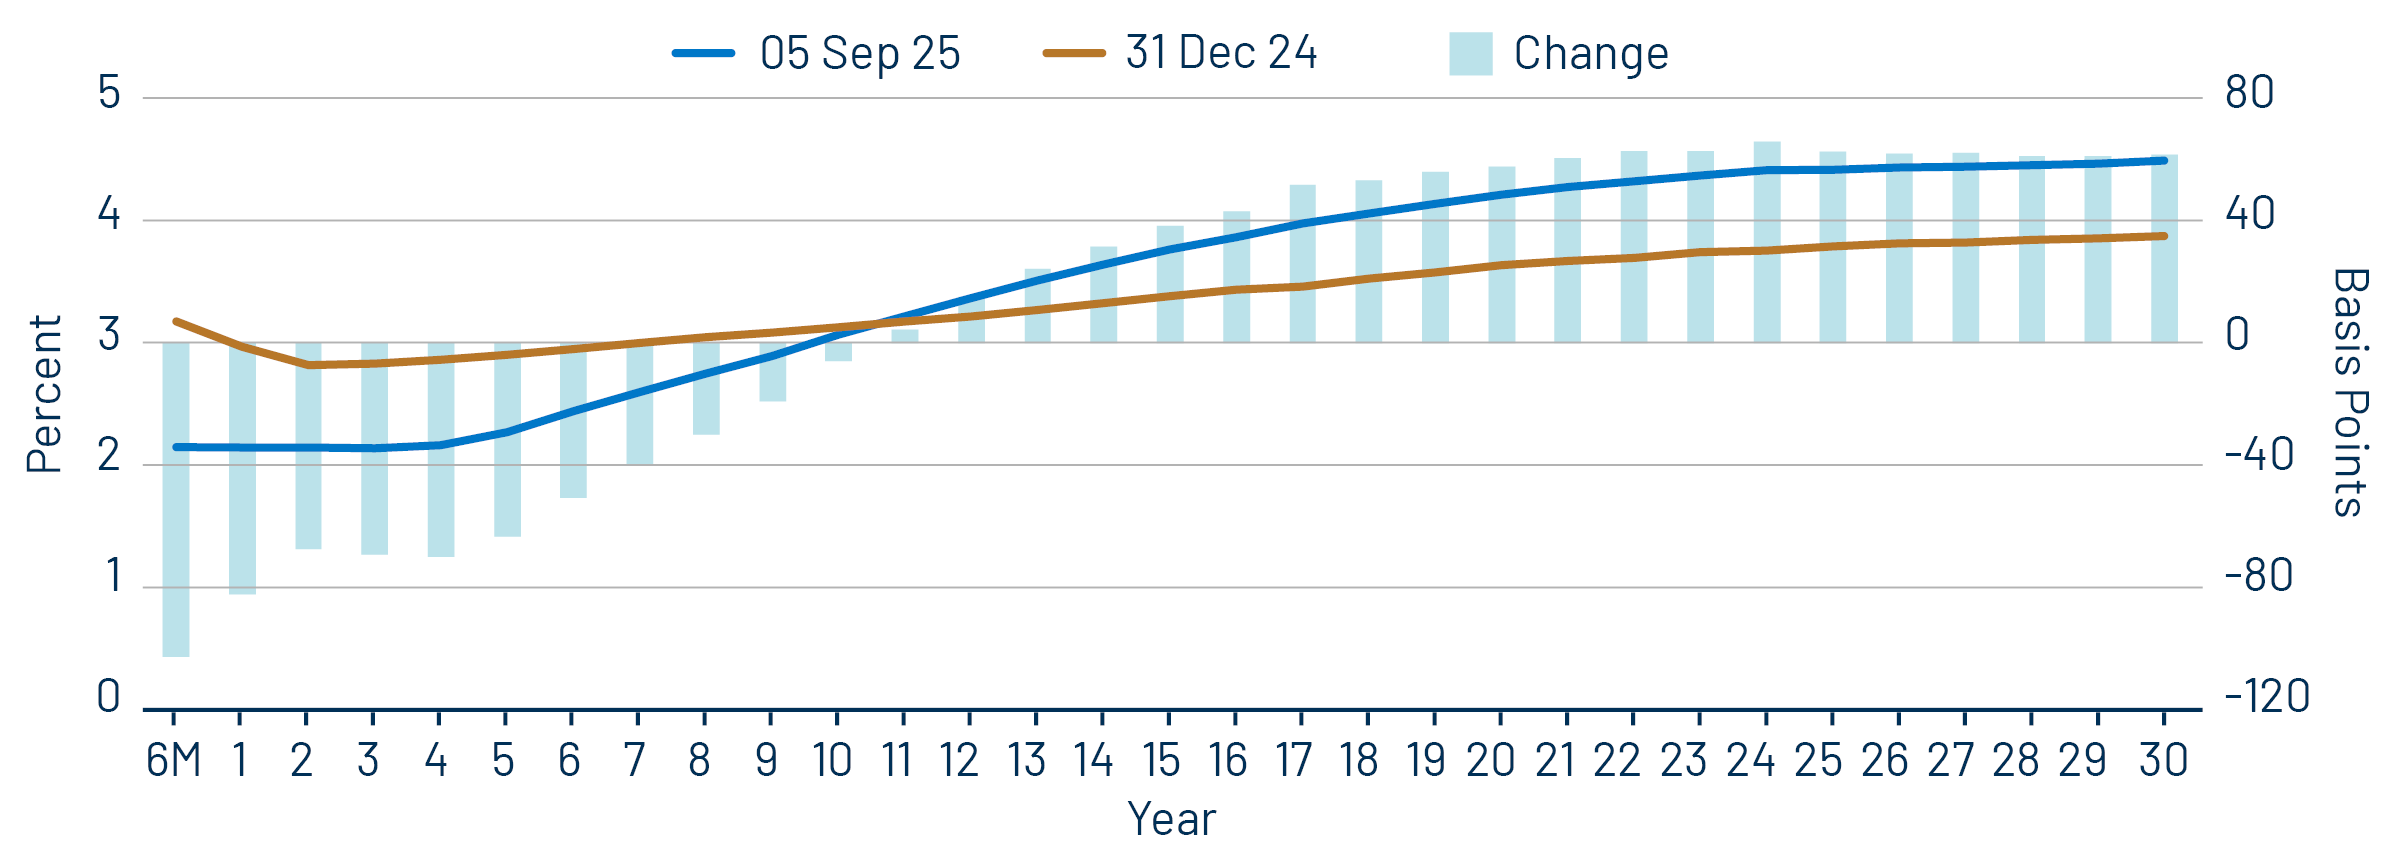
A key theme in the municipal bond market this year has been the steepening yield curve, which diverged from trends in other fixed-income markets. From the start of January through August, the Bloomberg BVAL callable AAA Municipal Yield Curve moved 61 bps lower in 2-year maturities and 77 bps higher in 30-year tenors, leading the 2s30s spread to 244 basis points (bps), well above its 10-year average of 136 bps. By comparison, the Treasury curve moved lower in most maturities during the same period. As a result of the curve steepening, YTD returns varied widely through August 31, the Bloomberg 5-Year Municipal Bond Index returned 4.01%, while the Bloomberg Long Bond Index returned -3.59%.

Exhibit 1: Muni Curve Steepness Has Outpaced Treasury Curve Steepness in Recent Years
Muni Curve Steepness Has Outpaced Treasury Curve Steepness in Recent Years
Source: Bloomberg, Western Asset. As of 26 Sep 25. Treasury Curve Steepness: Yield difference between the 30-year and 2-year tenors of the US On-/Off-the-Run Sovereign Curve. Muni Curve Steepness: Yield difference between the 30-year and 2-year tenors of the Bloomberg Valuation Service (BVAL) Callable AAA Muni Curve. Select the image to expand the view.

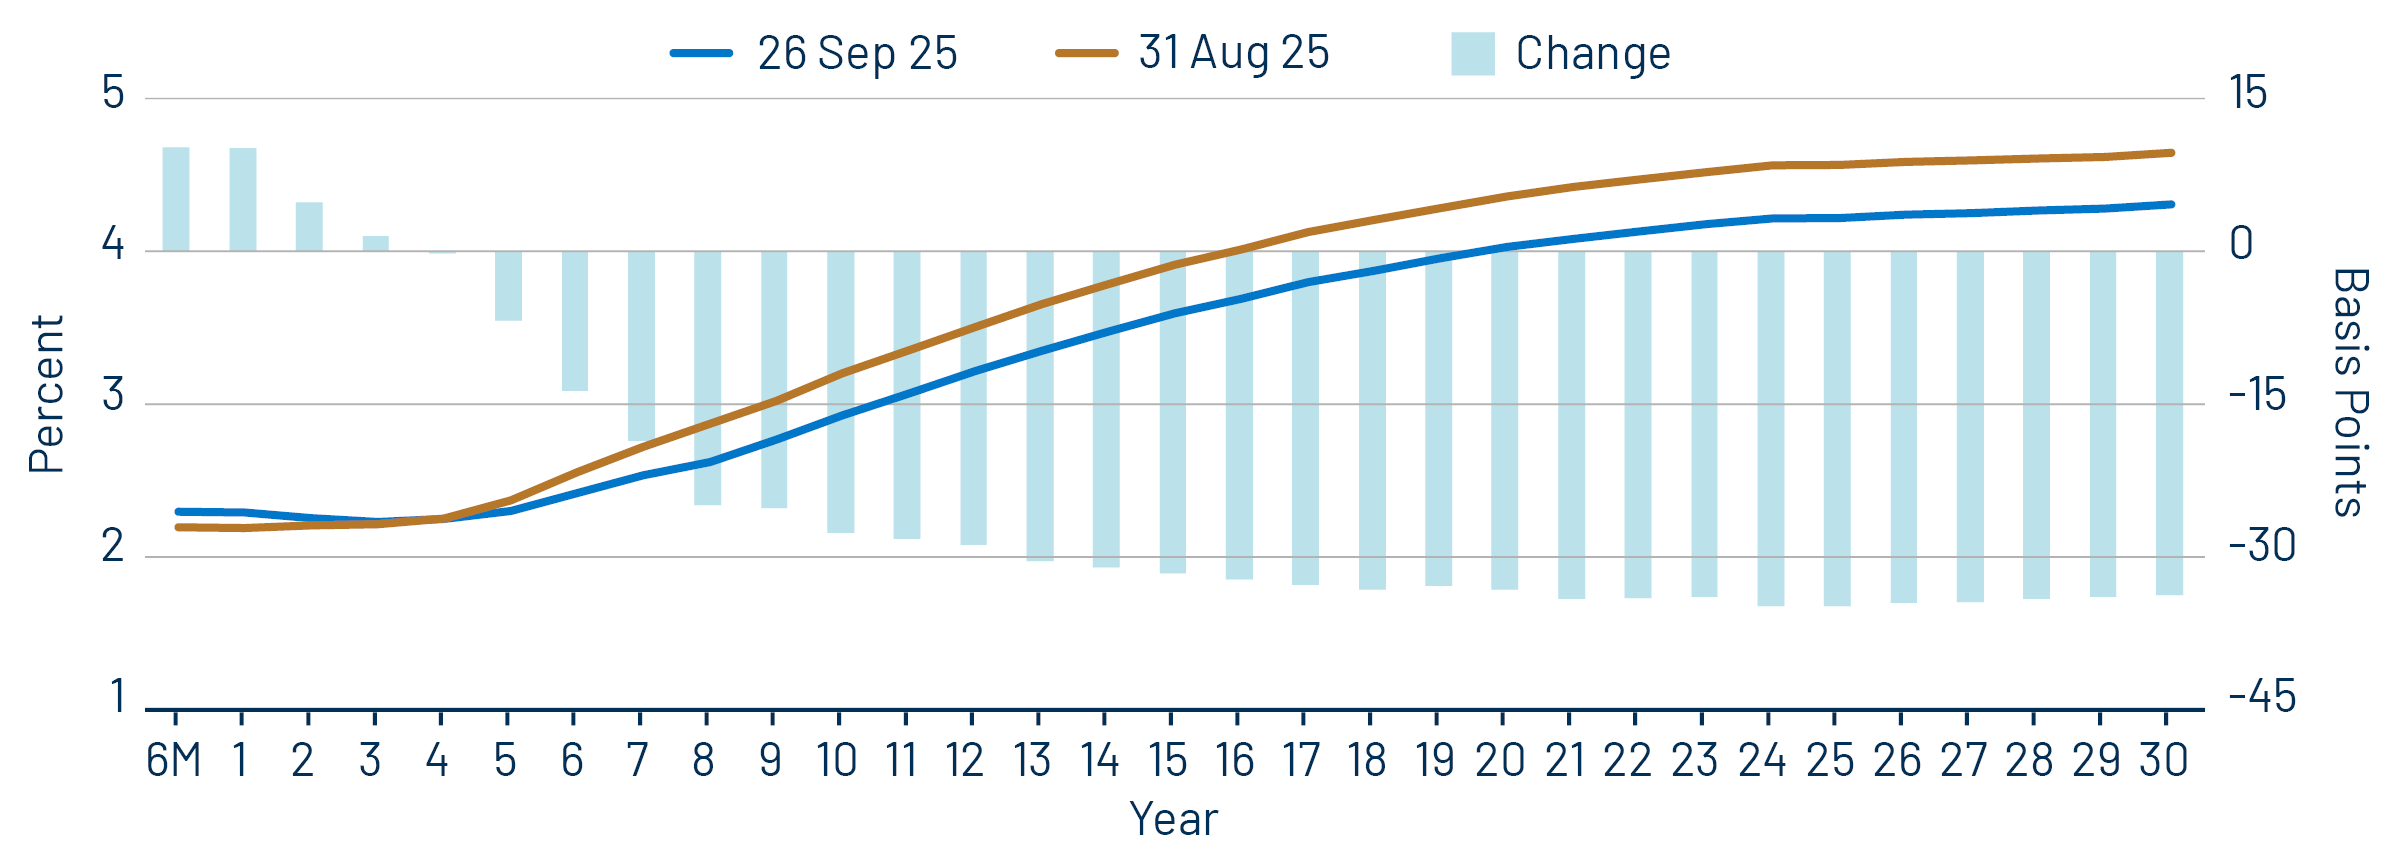
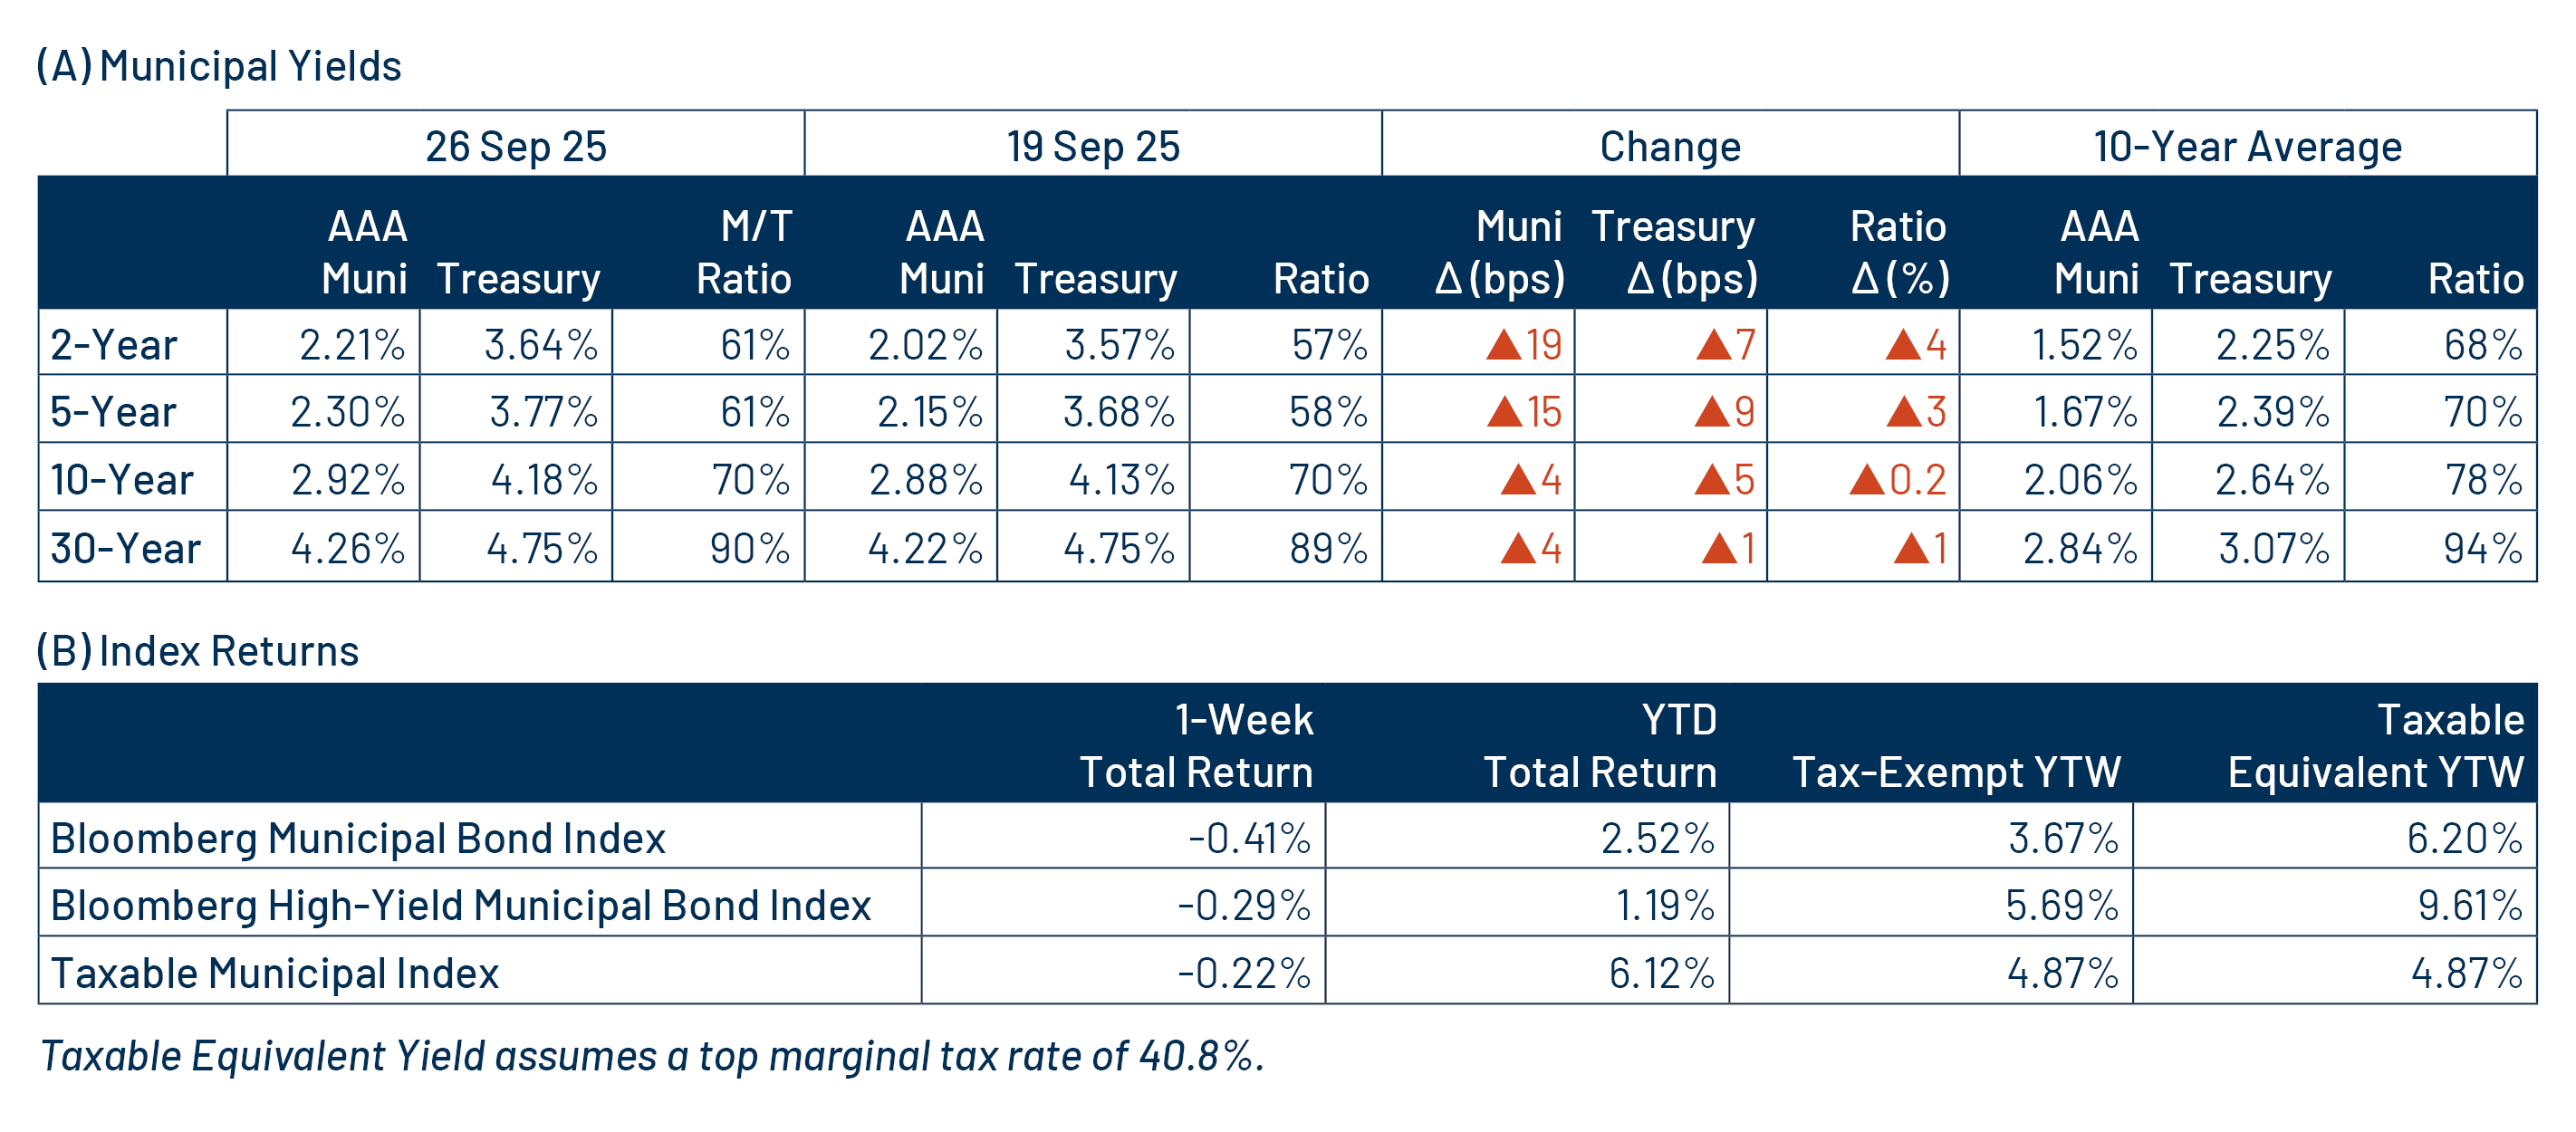
As the Federal Reserve (Fed) telegraphed a rate cut in September, the municipal bond yield curve significantly reversed the steepening observed earlier in the year. From September 1 to September 26, the AAA municipal yield curve 2-year yield rose 5 bps to 2.26% while the 30-year yield fell 34 bps to 4.31%. As a result of the curve flattening, longer maturities outperformed, with the Bloomberg Long Municipal Bond Index (22+ Year) returning 4.07% for the month to date, retracing all the negative performance accumulated by the index this year. Meanwhile, the Bloomberg 1-Year Muni Bond Index significantly underperformed, returning just 0.07% during the month.

Exhibit 2: AAA Municipal Yield Curve
AAA Municipal Yield Curve
Source: Bloomberg, Western Asset. As of 26 Sep 25. BVAL AAA Muni Curve and US On-/Off-the-Run Sovereign Curve. Indices are unmanaged and one cannot directly invest in them. They do not include fees, expenses or sales charges. Past performance is not an indicator or a guarantee of future results. Select the image to expand the view.
Exhibit 3: September Municipal Index Performance (Month to Date)
September Municipal Index Performance (Month to Date)
Source: Bloomberg, Municipal Bond Indices. As of 26 Sep 25. Select the image to expand the view.

The strong performance of longer-term munis is indicative of investors seeking higher income ahead of anticipated Fed rate cuts. According to Lipper, the long category municipal mutual funds recorded more flows than any other category in 2025. Western Asset believes that longer maturities continue to offer attractive relative value for long-term investors, considering elevated absolute muni yield levels and rolldown opportunities from the curve, which remains relatively steep versus taxable fixed-income markets.

Municipal Credit Curves and Relative Value

Exhibit 4: Muni Credit Curves
Muni Credit Curves
Source: Bloomberg, Western Asset. As of 26 Sep 25. BVAL Municipal Credit Indices (AAA, AA, A, BBB, respectively) and US Sovereign Curves. Taxable-Equivalent Muni Credit Curves consider the top marginal effective tax rate of 40.8%. AA Muni is represented by the US General Obligation AA Muni BVAL Yield Curve. The BVAL curve is populated with pricing from uninsured AA General Obligation bonds. A Muni is represented by the US General Obligation A Muni BVAL Yield Curve. The BVAL curve is populated with pricing from uninsured A General Obligation bonds. BBB Muni is represented by the US General Obligation BBB Muni BVAL Yield Curve. The BVAL curve is populated with pricing from uninsured BBB General Obligation bonds. Indices are unmanaged and one cannot directly invest in them. They do not include fees, expenses or sales charges. Past performance is not an indicator or a guarantee of future results. Select the image to expand the view.
Exhibit 5: Taxable-Equivalent Muni Credit Curves
Taxable-Equivalent Muni Credit Curves
Source: Bloomberg, Western Asset. As of 26 Sep 25. BVAL Municipal Credit Indices (AAA, AA, A, BBB, respectively) and US Sovereign Curves. Taxable-Equivalent Muni Credit Curves consider the top marginal effective tax rate of 40.8%. AA Muni is represented by the US General Obligation AA Muni BVAL Yield Curve. The BVAL curve is populated with pricing from uninsured AA General Obligation bonds. A Muni is represented by the US General Obligation A Muni BVAL Yield Curve. The BVAL curve is populated with pricing from uninsured A General Obligation bonds. BBB Muni is represented by the US General Obligation BBB Muni BVAL Yield Curve. The BVAL curve is populated with pricing from uninsured BBB General Obligation bonds. Indices are unmanaged and one cannot directly invest in them. They do not include fees, expenses or sales charges. Past performance is not an indicator or a guarantee of future results. Select the image to expand the view.
Exhibit 6: AAA Munis vs. Treasuries
AAA Munis vs. Treasuries
Source: Muni Yields: Thomson Reuters MMD, Treasury Yields: Bloomberg. As of 26 Sep 25. Past performance is not a guarantee of future results. It is not possible to invest directly in an index. Select the image to expand the view.
Exhibit 7: Tax-Exempt and Taxable Muni Valuations
Tax-Exempt and Taxable Muni Valuations
Source: Bloomberg, Western Asset. As of 26 Sep 25. Yield-to-worst (YTW) is the lowest potential yield that can be received on a bond without the issuer actually defaulting. AAA, AA, A, BBB Corporate Indices; After-Tax Yield assumes a top effective tax rate of 40.8%. Taxable Muni Index Corporate comparable used is the Global Corporate Aggregate (ex. BBB) to better align credit quality and duration. Select the image to expand the view.

Western Asset Key Themes for Muni Investors

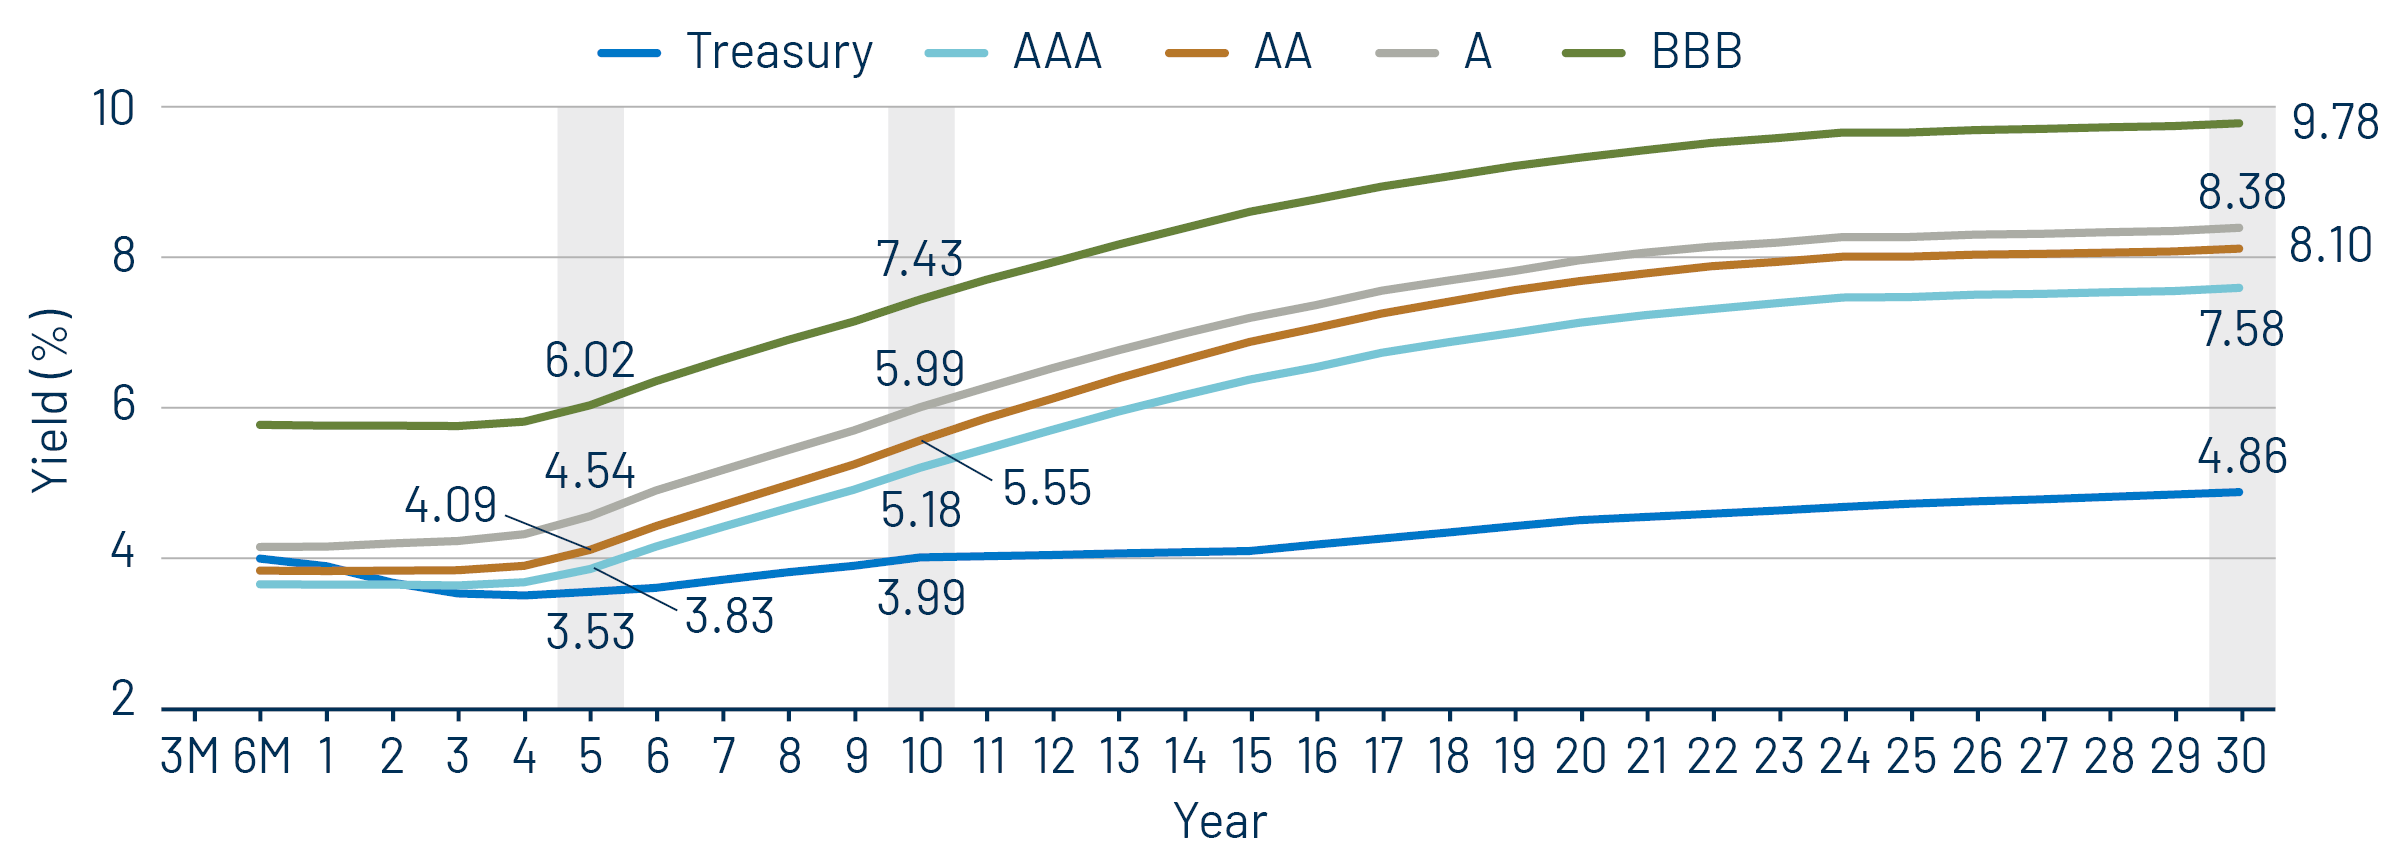
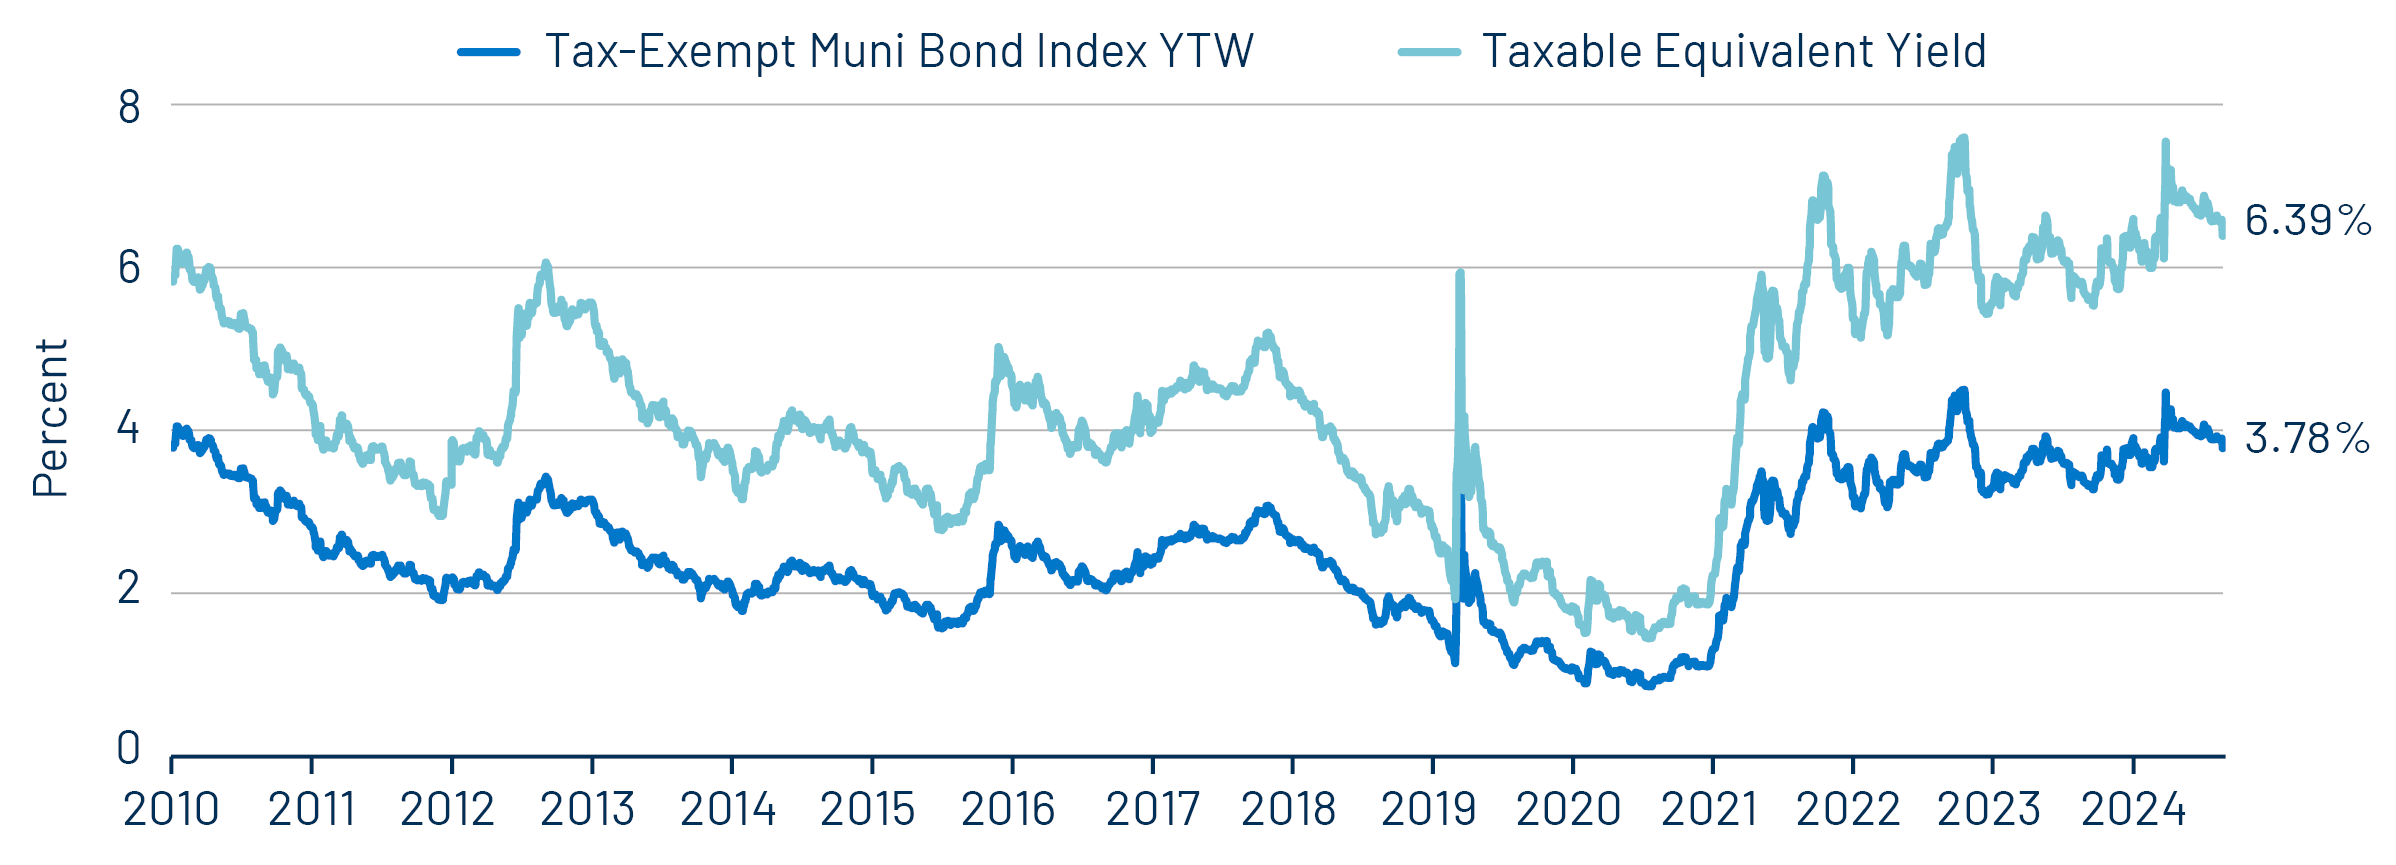
Theme #1: Municipal taxable-equivalent yields and income opportunities remain near decade-high levels.

Exhibit 8: Muni and Taxable-Equivalent Muni Yield-to-Worst
Muni and Taxable-Equivalent Muni Yield-to-Worst
Source: Bloomberg, Western Asset. As of 26 Sep 25. Bloomberg Municipal Bond Index yield considering highest marginal tax rate of 40.8%. Indexes are unmanaged and one cannot directly invest in them. They do not include fees, expenses or sales charges. Past performance is not an indicator or a guarantee of future results. Select the image to expand the view.

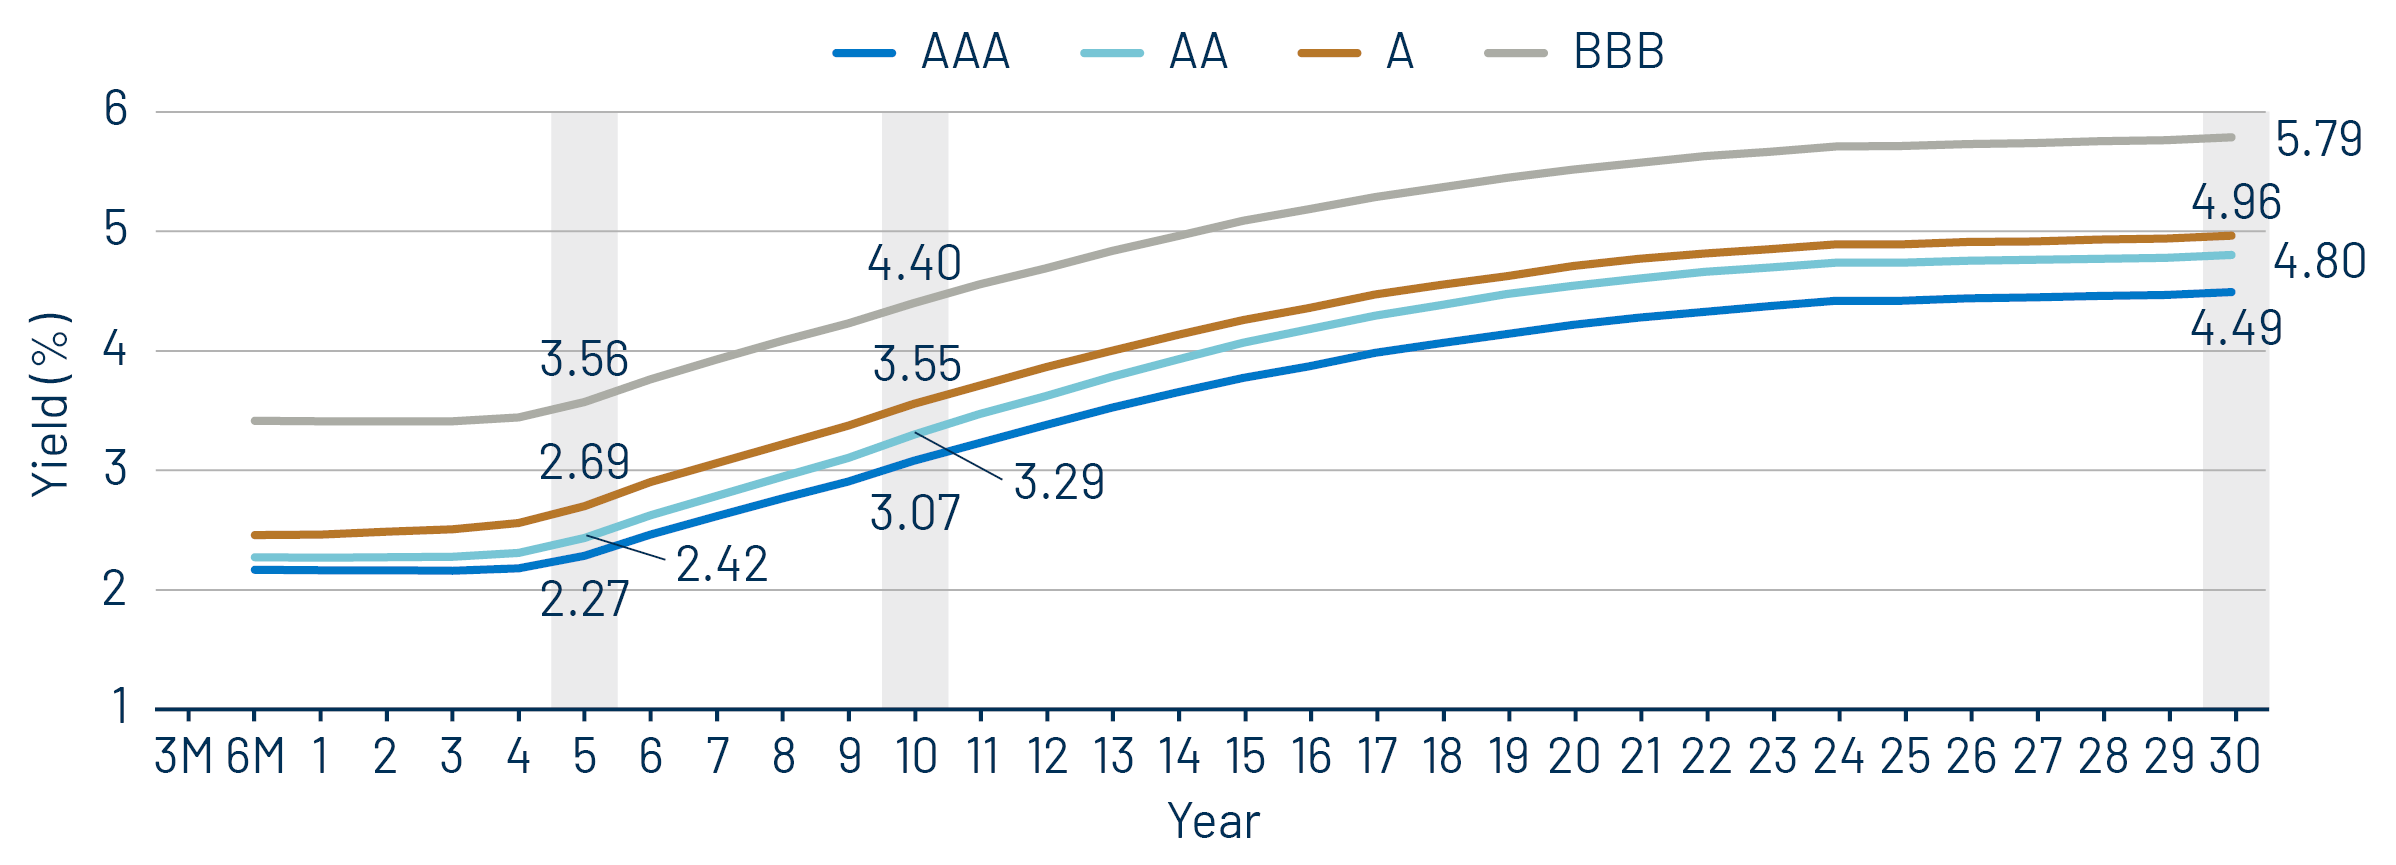
Theme #2: The AAA muni curve has steepened this year, offering better value in intermediate and longer maturities.

Exhibit 9: AAA Municipal vs. Treasury Yield Curves
AAA Municipal vs. Treasury Yield Curves
Source: Bloomberg, Western Asset. As of 26 Sep 25. BVAL AAA Muni Curve and US On-/Off-the-Run Sovereign Curve. Indexes are unmanaged and one cannot directly invest in them. They do not include fees, expenses or sales charges. Past performance is not an indicator or a guarantee of future results. Select the image to expand the view.

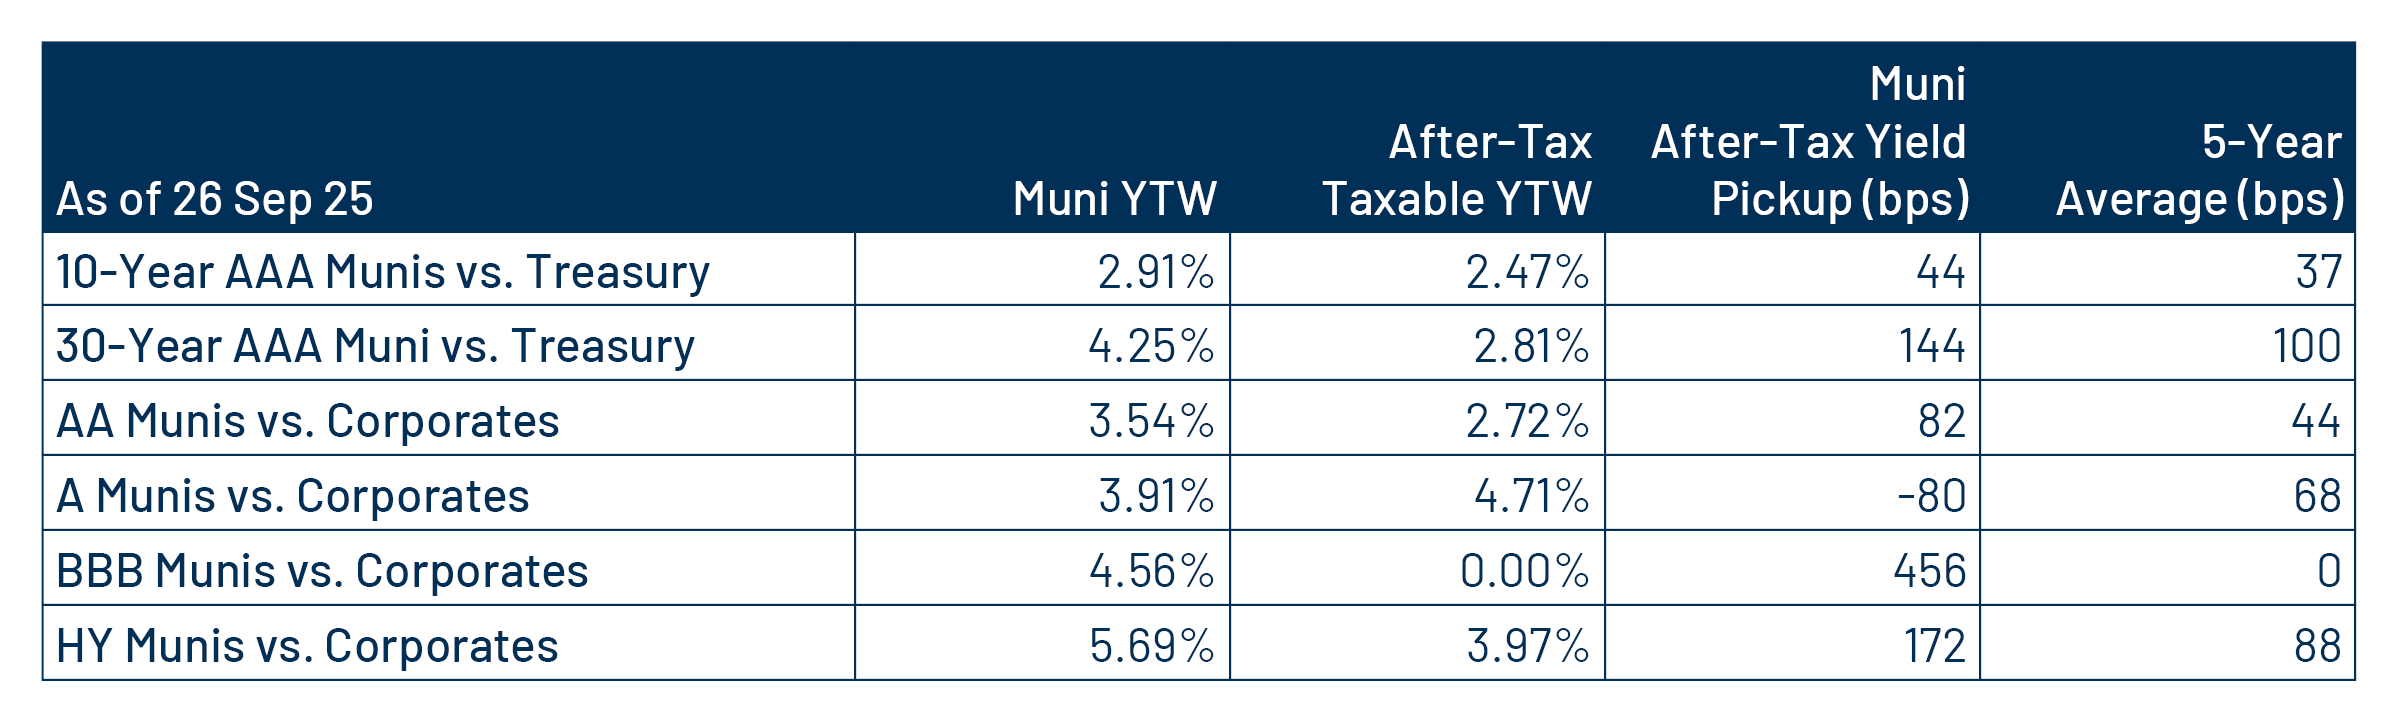
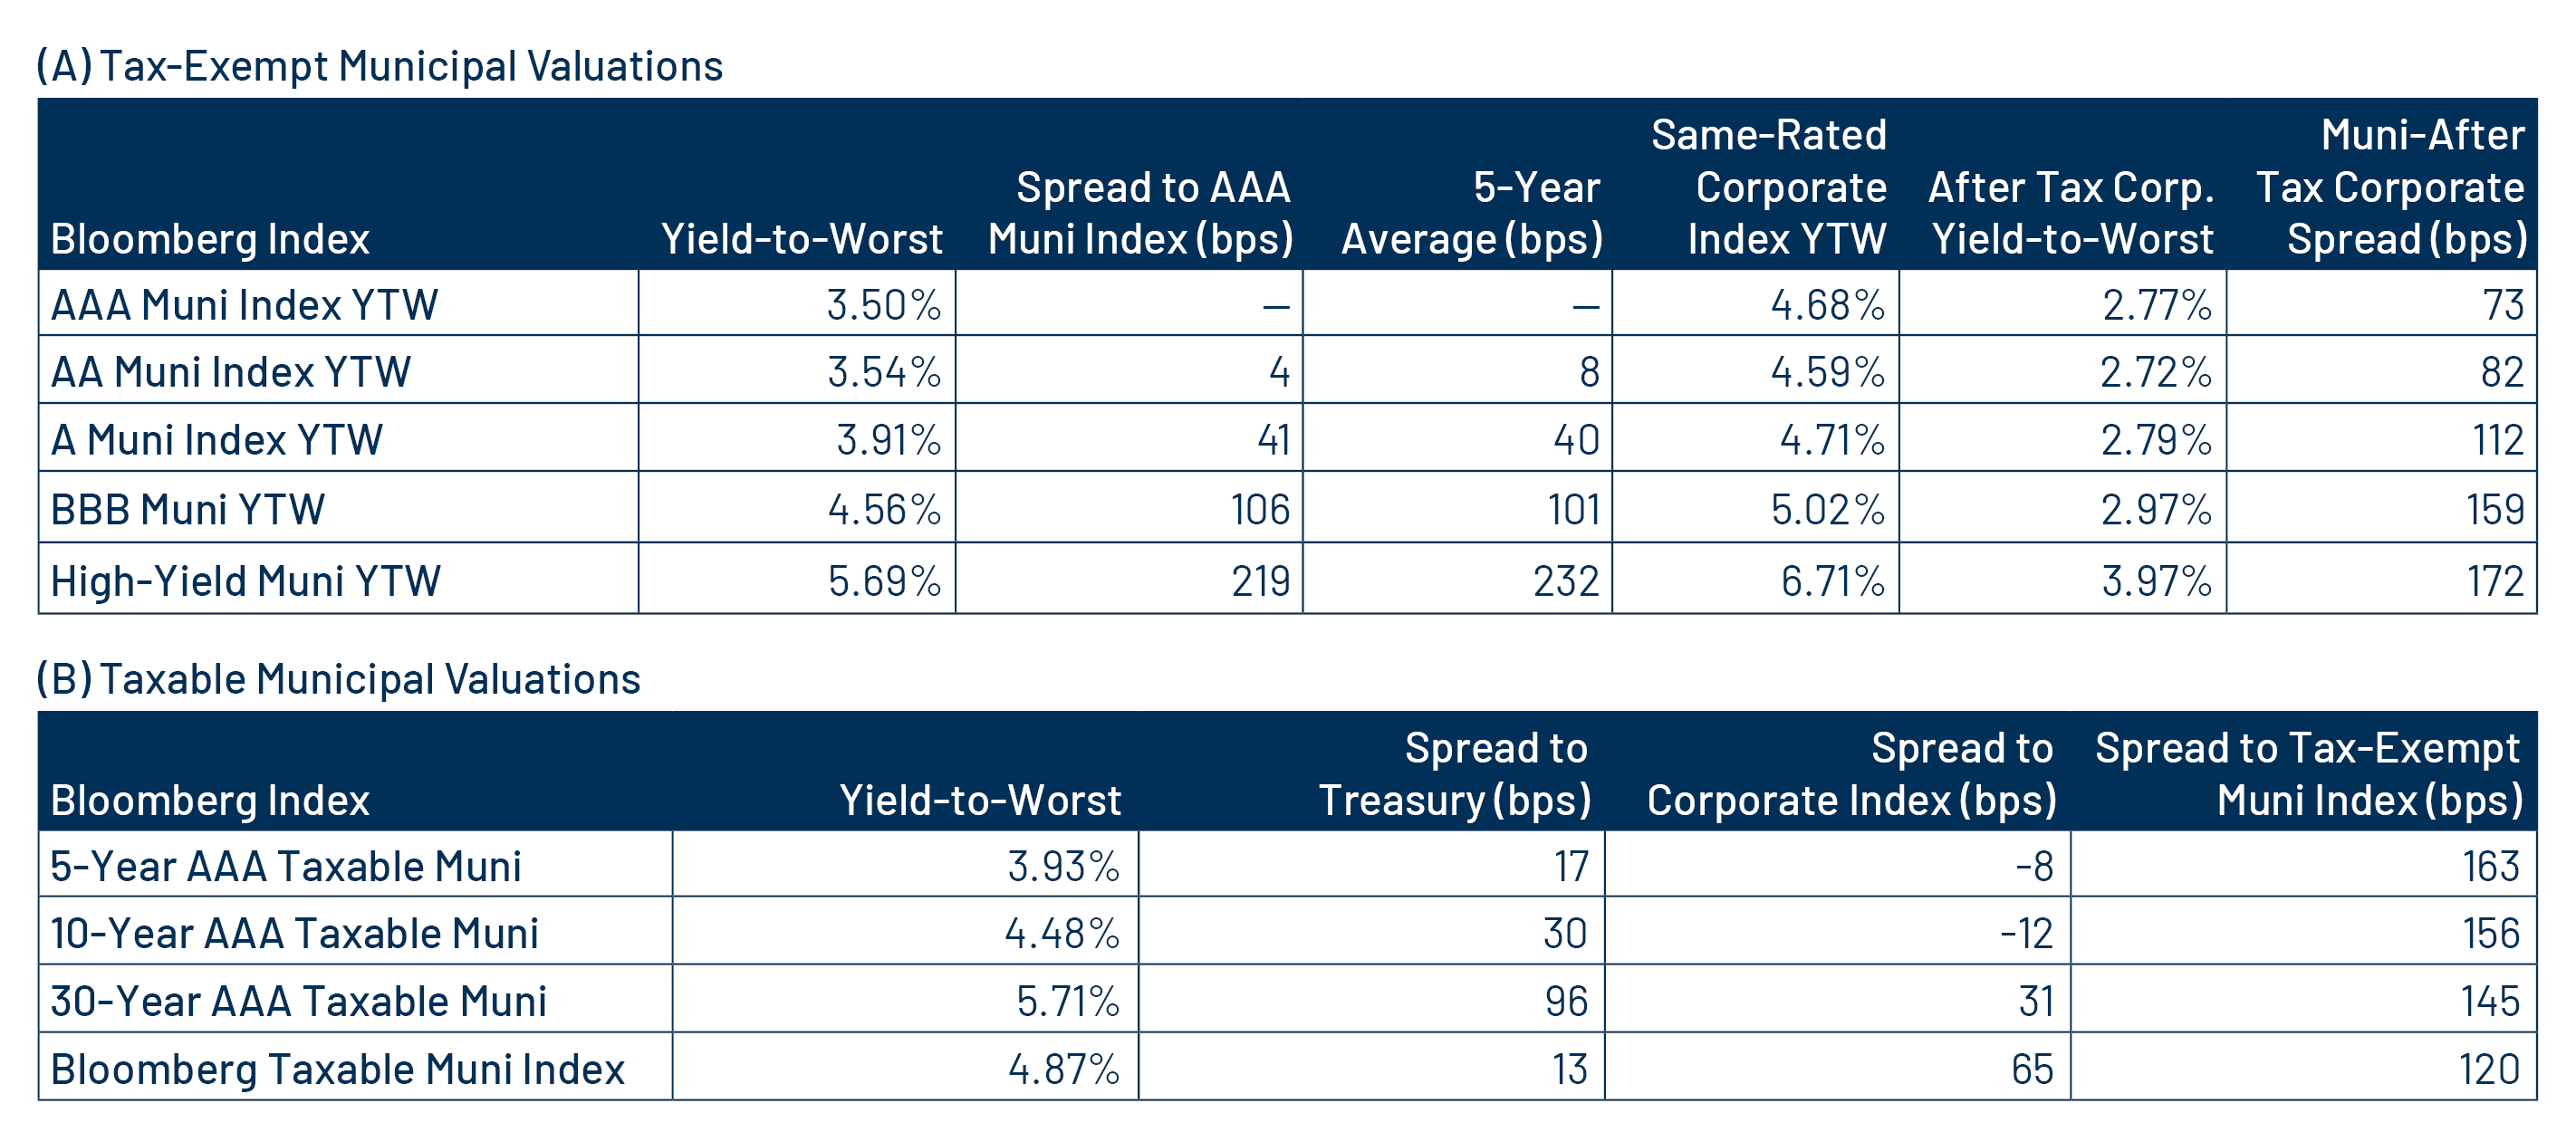
Theme #3: Munis offer attractive after-tax yield compared to taxable alternatives.

Exhibit 10: Municipal vs. Taxable Fixed-Income Yields by Quality
Municipal vs. Taxable Fixed-Income Yields by Quality
Source: Western Asset, Bloomberg. As of 26 Sep 25. 10- and 30-Year comparison reflects Bloomberg Valuation Service (BVAL) AAA Muni Curve and US On-/Off-the-Run Sovereign Curve. AA Muni reflects the Bloomberg AA Muni Bond Index. A Muni reflects the Bloomberg A Muni Bond Index. BBB Muni reflects the Bloomberg BBB Muni Bond Index. HY Muni reflects the Bloomberg High Yield Muni Bond Index. AA Corp reflects the Bloomberg AA Corporate Bond Index. A Corp reflects the Bloomberg A Corporate Bond Index. BBB Corp reflects the Bloomberg BBB Corporate Bond Index. After-tax yield considers the top marginal tax rate of 40.8%. Indexes are unmanaged and one cannot directly invest in them. They do not include fees, expenses or sales charges. Past performance is not an indicator or a guarantee of future results. Select the image to expand the view.

投資一任契約および金融商品に係る投資顧問料(消費税を含む):
投資一任の場合は運用財産の額に対して、年率1.1%(税抜き1.0%)を上限とする運用手数料を、運用戦略ごとに定めて おります。 また、別途運用成果に応じてお支払いいただく手数料(成功報酬)を設定する場合があります。
その料率は、運用成果の評価方法や固定報酬率の設定方法により変動しますので、手数料の金額や計算方法をこの書 面に記載することはできません。

投資信託の場合は投資信託ごとに信託報酬が定められておりますので、目論見書または投資信託約款でご確認くださ い。有価証券の売買又はデリバティブ取引の売買手数料を運用財産の中からお支払い頂きます。投資信託に投資する 場合は信託報酬、管理報酬等の手数料が必要となります。これらの手数料には多様な料率が設定されているためこの 書面に記載することはできません。デリバティブ取引を利用する場合、運用財産から委託証拠金その他の保証金を預託 する場合がありますが、デリバティブ取引の額がそれらの額を上回る可能性があります。その額や計算方法はこの書面に 記載することはできません。投資一任契約に基づき運用財産の運用を行った結果、金利、通貨の価格、金融商品市場に おける相場その他の指標に係る変動により、損失が生ずるおそれがあります。損失の額が、運用財産から預託された委 託証拠金その他の保証金の額を上回る恐れがあります。個別交渉により、一部のお客様とより低い料率で投資一任契約 を締結する場合があります。

©Western Asset Management Company Ltd 2025. 本資料の著作権は、ウエスタン・アセット・マネジメント株式会 社およびその関連会社(以下「ウエスタン・アセット」という)に帰属するものであり、意図した受取人のみを対象として 作成されたものです。本資料に記載の内容は、秘密情報及び専有情報としてお取り扱いください。ウエスタン・アセット の書面による事前の承諾なしに、全部又は一部を無断で複写、複製することや転載することを堅くお断りいたします。

過去の運用実績は将来の運用実績を示すものではありません。また、本資料は、将来の実績を予測または予想するも のではありません。

本資料は、適格機関投資家、特定投資家、企業年金基金、公的年金等、豊富な投資経験と高度な専門知識とを備えたプ ロフェッショナルのお客様のみにご提供するものです


本資料は情報の提供のみを目的としています。資料作成時点のウエスタン・アセットの見解を掲載したものであり、将来 予告なしに変更する場合があります。また、リアルタイムの市場動向や運用に関する見解ではありません。

本資料で第三者のデータが使用されている場合、ウエスタン・アセットはそのデータが公表時点で正確であると信じてい ますが、それを保証するものではありません。ウエスタン・アセットの戦略・商品の受賞またはランキングが含まれている 場合、これらは独立した第三者または業界出版物により公平な定量・定性情報に基づき決定されたものです。ウエスタ ン・アセットは、これらの第三者の標準的な業界サービスを利用したり、出版物を購読したりする場合がありますが、それ らは、すべてのアセット・マネージャーが利用可能なものであり、ランキングや受賞に影響を与えるものではありません。

本資料に記載の戦略・商品には、元本の一部または全部の損失を含む大きなリスクが伴う場合があります。また、当該 戦略や商品に投資することは大きな変動を伴なう可能性があり、投資家にはそのようなリスクを受け入れる経済力およ び意思を持つことが求められます。

特段の注記がない限り、本資料に記載の戦略のパフォーマンスはコンポジットのデータです。コンポジットではないその他 のデータについては、当戦略の運用方針に最も近いと考えられる口座を、コンポジットの代表口座として掲載しています。 つまり、代表口座は運用結果により選択されるものではありません。代表口座のポートフォリオ特性は、コンポジットやそ の他のコンポジット構成口座と異なる場合があります。これらの口座についての情報はご依頼に応じてご提供いたします。

本資料に記載している内容は、ウエスタン・アセットの投資家に対する投資助言ではありません。個別銘柄・発行体に関 する一般的または具体的に言及する内容は、例としてご提示したものであり、購入または売却を推奨するものでもありま せん。また、ウエスタン・アセットの役職員及びお客様は、本資料に記載の有価証券を保有している可能性があります。

本資料は、会計、法務、税務、投資またはその他の助言の提供を意図したものではなく、またそれらに依存すべきでは ありません。お客様は、ウエスタン・アセットが提供する戦略・商品への投資を行うにあたり、経済的リスクやメリットな どについて助言が必要である場合は、ご自身の弁護士、会計士、投資家、税理士、その他のアドバイザーに相談して下さ い。お客様は、居住国で適用される法令を遵守する責任を負います。

ウエスタン・アセットは世界有数の運用専門会社です。1971年の設立以来、債券運用に特化したアクティブ運用機関として 最大規模の運用資産と運用チームを有しています。拠点は米国カリフォルニア州パサデナ、ニューヨーク、英国ロンドン、 シンガポール、東京、豪メルボルン、ブラジル・サンパウロ、香港、スイス・チューリッヒにあり、フランクリン・リソーシズInc の完全子会社ですが、経営全般に独立性を保っており、次の6法人で構成されています。米国:ウエスタン・アセット・マネ ジメント・カンパニーLLC(米証券取引委員会(SEC)登録の投資顧問会社)。ブラジル・サンパウロ:ウエスタン・アセット・マネジメント・カンパニーLtda.(ブラジル証券取引委員会が規制)。メルボルン:ウ エスタン・アセット・マネジメント・カンパニーPty Ltd(事業者番号ABN 41 117 767 923、AFSライセンス303160)。シンガ ポール:ウエスタン・アセット・マネジメント・カンパニーPte. Ltd(. CMSライセンスCo. Reg. No. 200007692R、シンガポール 通貨監督庁が監督)。日本:ウエスタン・アセット・マネジメント株式会社(金融商品取引業者、金融庁が規制)。英国:ウ エスタン・アセット・マネジメント・カンパニーLimited(英金融行動監視機構(FCA)が認可(FRN145930)、規制)。本資料 は英国ではFCAが定義する「プロフェッショナルな顧客」のみを対象とした宣伝目的に使用されます。許可された欧州経 済領域 (EEA)加盟国へ配信する場合もあります。最新の承認済みEEA加盟国のリストは、ウエスタン・アセット(電話:+44 (0)20 7422 3000)までお問い合わせください。詳細は当社ウエブサイトwww.westernasset.co .jpをご参照ください。
ウエスタン・アセット・マネジメント株式会社について
業務の種類: 金融商品取引業者(投資運用業、投資助言・代理業、第二種金融商品取引業)
登録番号: 関東財務局長(金商)第427号
加入協会: 一般社団法人日本投資顧問業協会(会員番号 011-01319)
一般社団法人投資信託協会