Municipals Posted Negative Returns Last Week
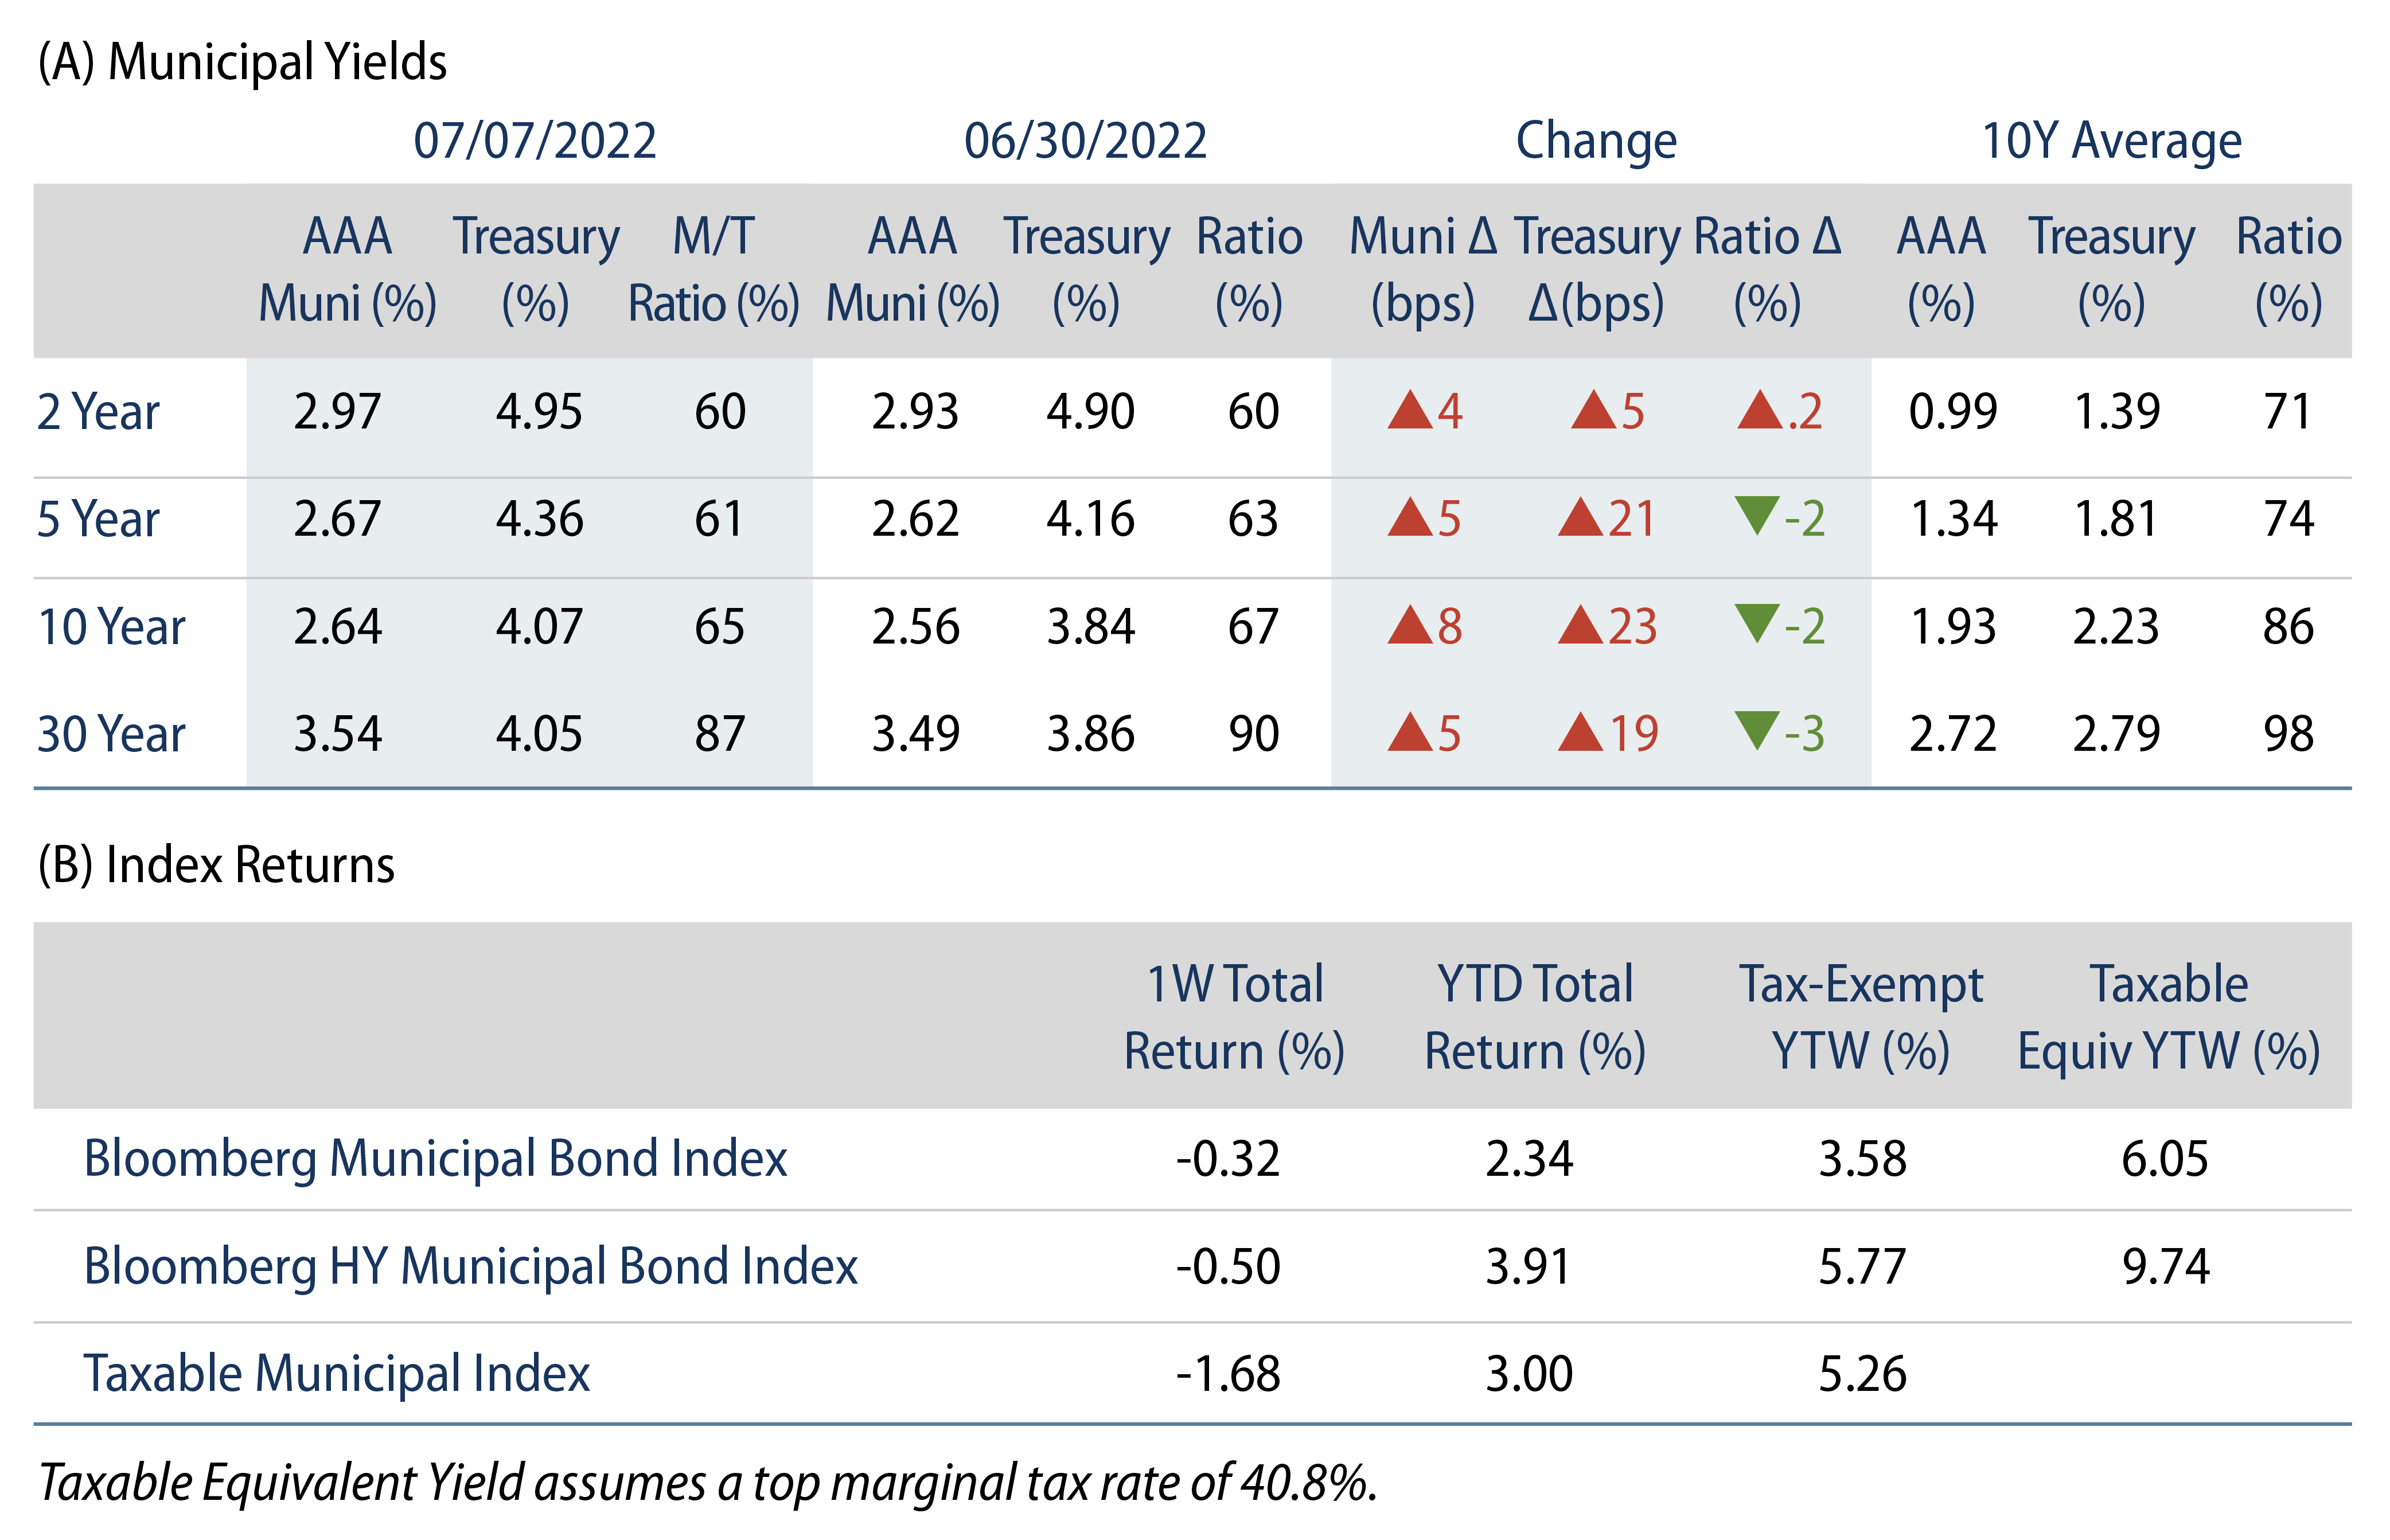
Municipals posted negative returns last week as rates moved higher, with high-grade municipal yields moving lower across the curve. Municipals outperformed Treasuries, which moved higher on strong labor data. Market technicals were supported by a lack of new-issue calendar due to the July 4 holiday. The Bloomberg Municipal Index returned -0.32% during the week, the High Yield Muni Index returned -0.50% and the Taxable Muni Index returned -1.68%. This week we recap muni market performance drivers from the first half of the year.
Market Technicals Were Supported by a Lack of New-Issue Calendar Due to the Holiday
Fund Flows: During the week ending July 5, weekly reporting municipal mutual funds recorded $856 million of net outflows, according to Lipper. Long-term funds recorded $603 million of outflows, high-yield funds recorded $307 million of outflows and intermediate funds recorded $54 million of outflows.
Supply: The muni market recorded just $1 billion of new-issue volume last week due to the holiday. This week’s calendar is expected to tick up to $10 billion. Larger transactions include $970 million Denton Independent School District and $503 million Intermountain Power Agency transactions.
This Week in Munis: Mid-Year Report
Performance: Munis Begin to Find Footing
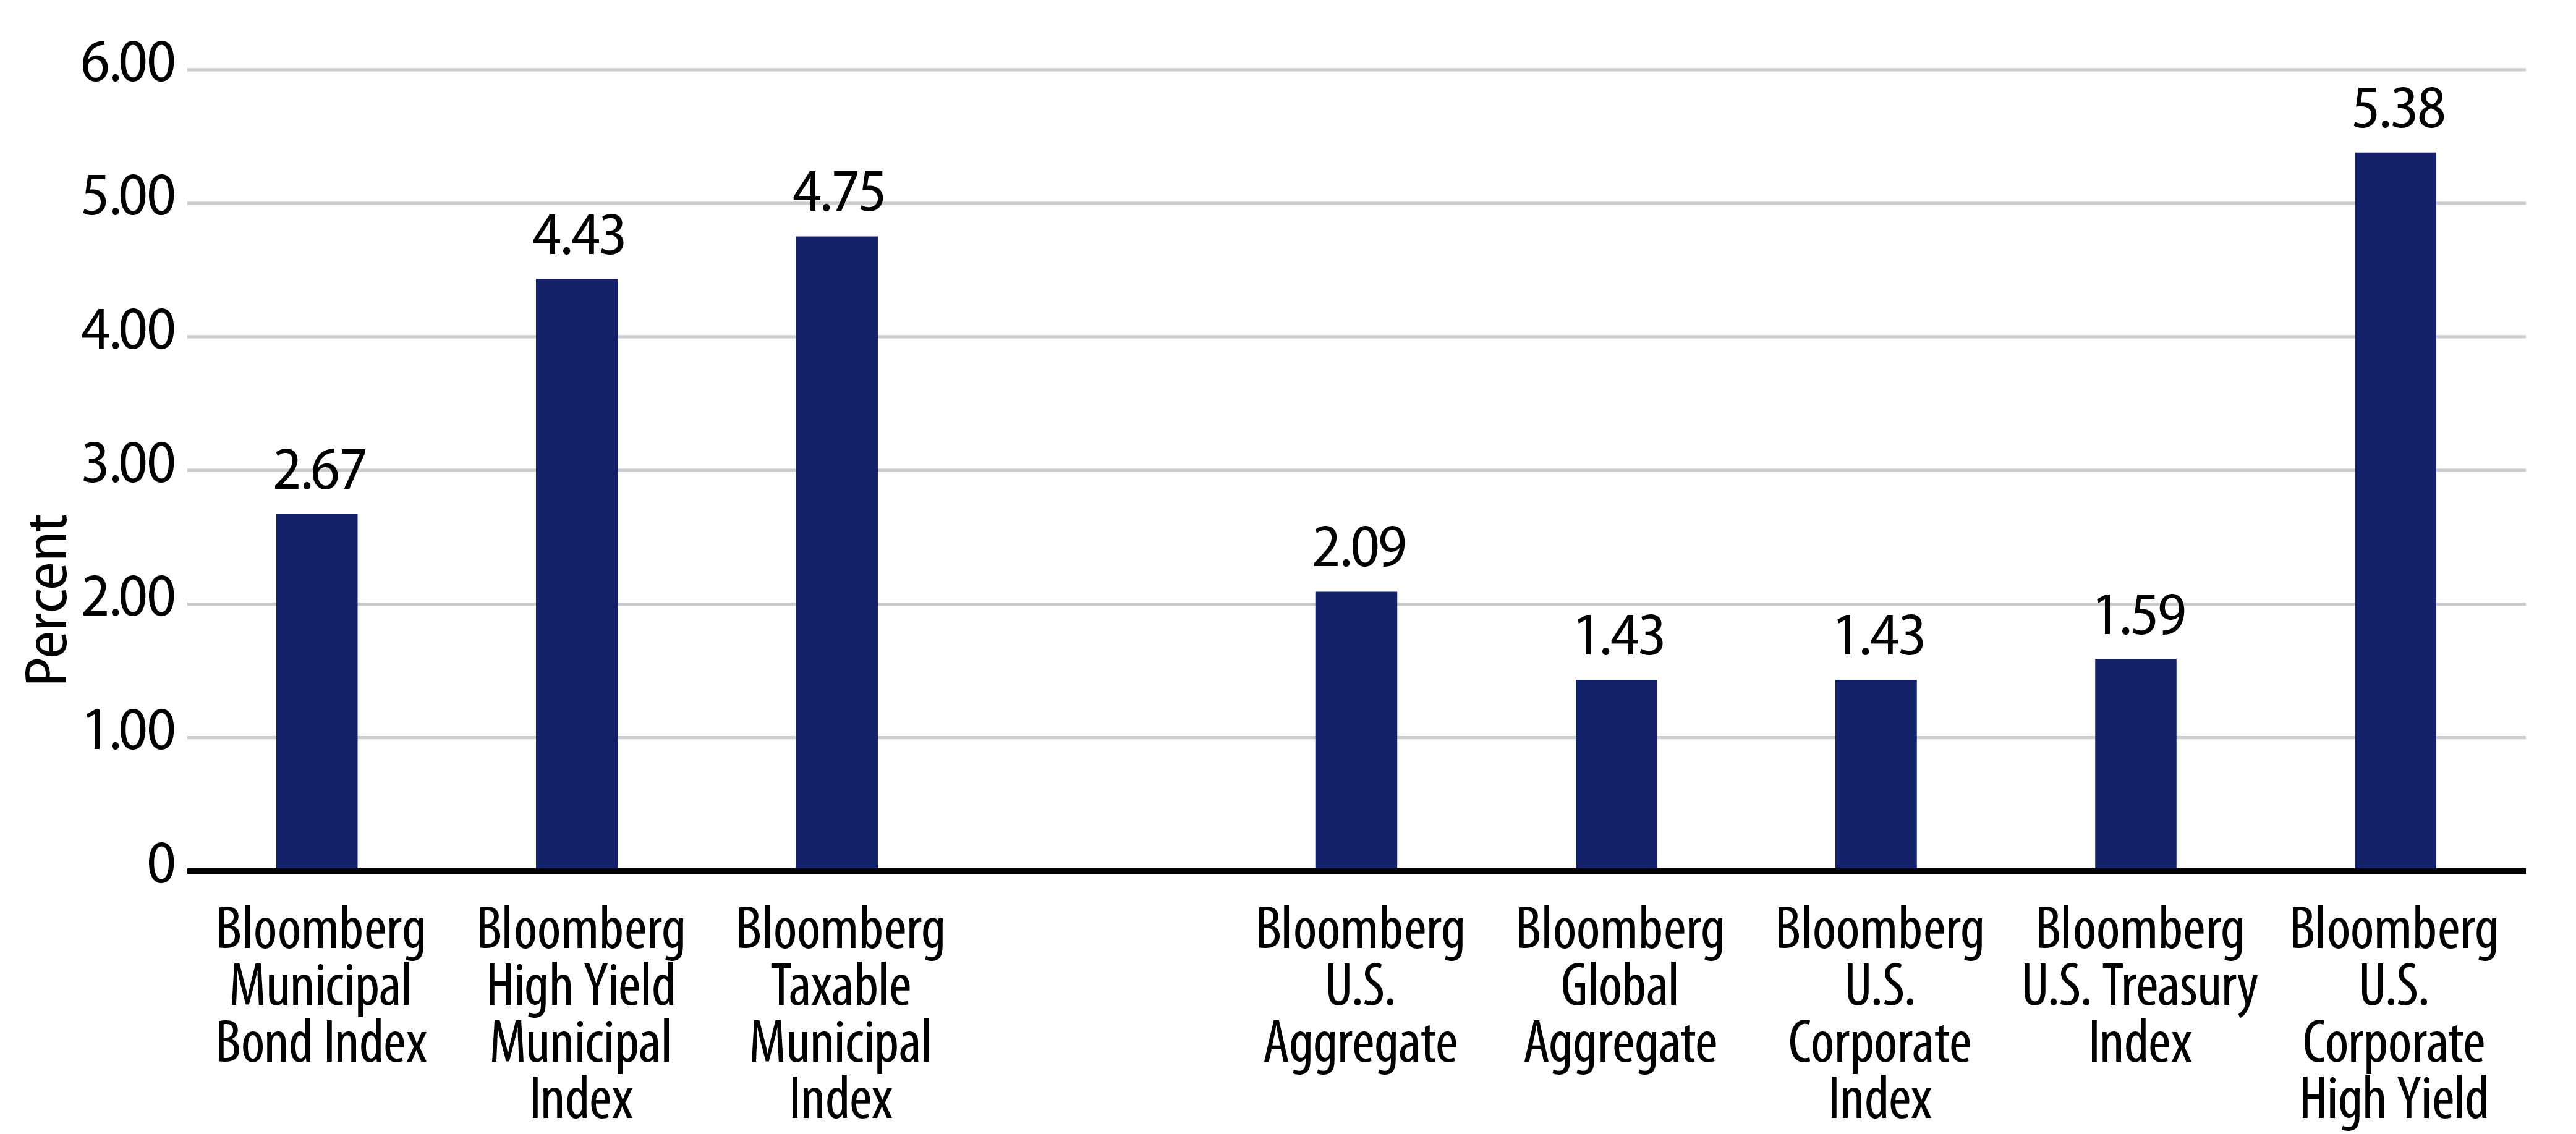
- Performance: Following last year’s worst calendar year return in 40 years (-8.5%), the tax-exempt municipal market regained its footing, returning 2.67% in the first half of the year. Investment-grade tax-exempts generally outperformed other taxable fixed-income sectors, supported by reduced interest-rate volatility, limited supply conditions and a return of demand in certain segments of the market. Meanwhile, longer-duration taxable municipals were supported by lower long-end rates as well as tight supply conditions as the Bloomberg Taxable Municipal Bond Index returned 4.75% year-to-date (YTD).
- Curve Returns: The AAA municipal yield curve flattened with the Treasury curve YTD, with short-end AAA muni yields increasing 33 bps in 2-years and longer-term yields declining 9 bps in 30-years. As a result, longer-duration indices outperformed as a Bloomberg Muni Long Index (22+) returned 4.27%, whereas the 1- and 3-year municipal bond indices retuned 1.14% and 0.90%, respectively.
- Credit Returns: A favorable credit landscape supported returns down the credit spectrum as the Bloomberg BBB and HY Municipal indices outperformed, returning 4.45% and 4.43%, respectively, through 1H23. Higher-grade AAA and AA indices returned 2.08% and 2.41%, respectively.
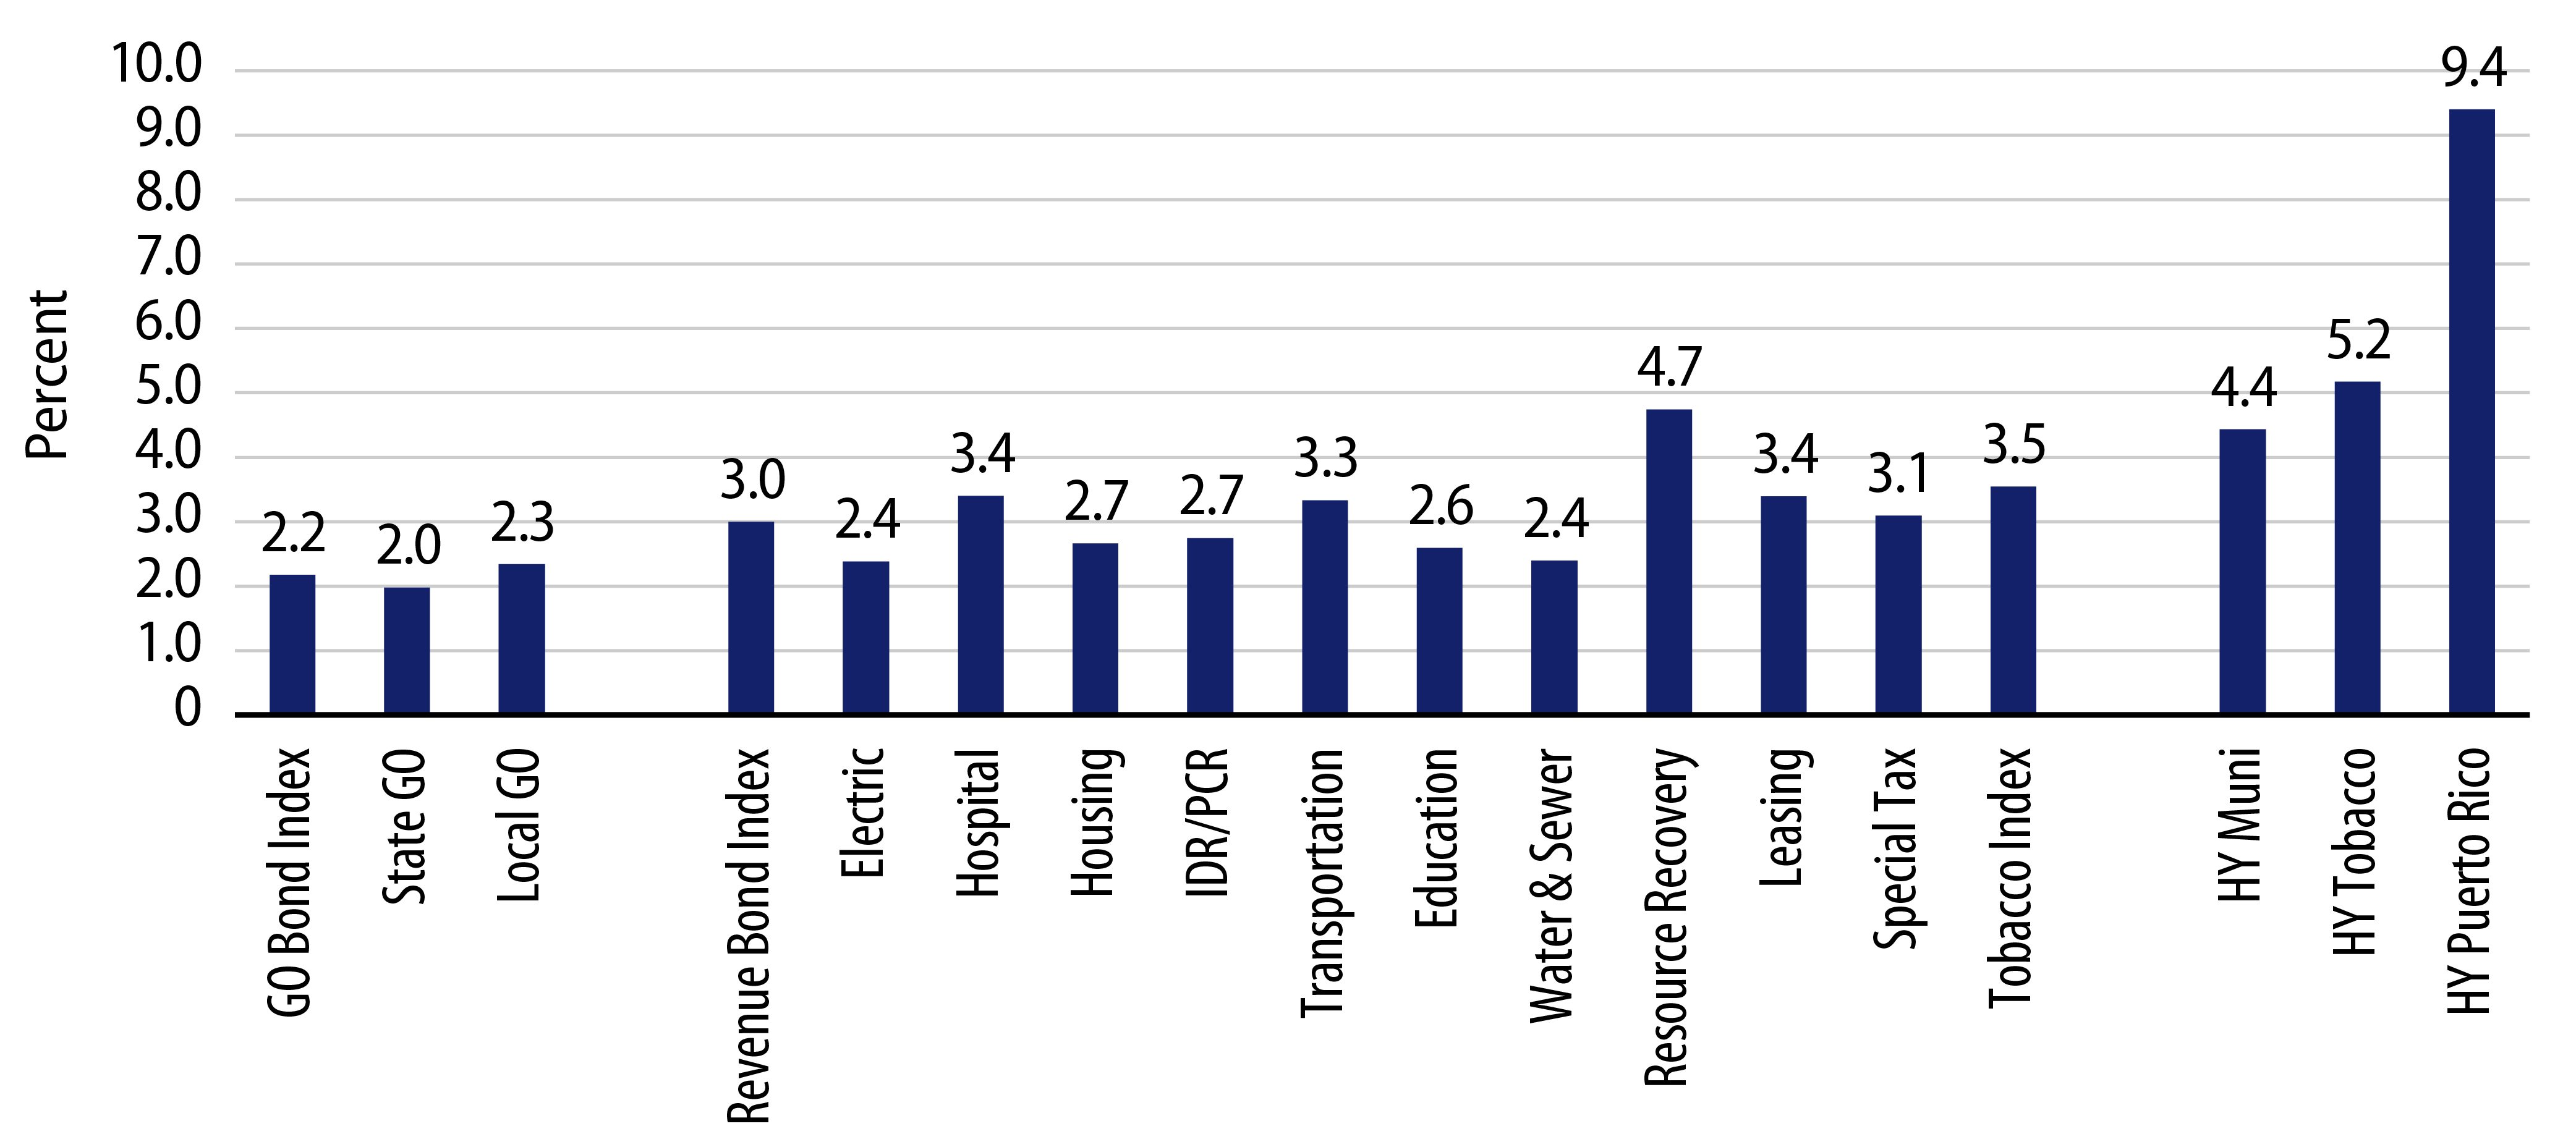
- Sector Returns: From a sector perspective, higher-beta revenue sectors outperformed higher-quality general obligation (GO) bond indices, as the Bloomberg Revenue Index retuned 3.00%, while the Bloomberg GO Index retuned 2.18%. Within the revenue-backed segment, resource recovery, health care and transportation sectors outperformed, while higher-quality water & sewer, and electric utility sectors underperformed.
Technicals Were Supported by Limited Supply and Improved Demand
- New-issue supply continued to decline. A higher interest rate environment has continued to take a toll on municipal supply. Total muni issuance of $201 billion declined 10% from 1H22. Total supply declines were primarily driven by lower levels of taxable issuance, which declined 49% year-over-year (YoY) to $20.5 billion, while tax-exempt supply declined 4% YoY to $154 billion. While new-issue supply remained limited, FDIC selling of large regional bank muni allocations provided relief in the secondary market.
- Demand has started to return, but has not yet rebounded. Following the 2022 record negative $150 billion fund outflow cycle, municipal mutual fund flows recorded $5 billion of net inflows in the first half of the year, according to ICI. Lipper reported long-term funds recorded $5.2 billion of inflows, intermediate funds recorded $596 million of inflows and high-yield funds recorded $684 million of inflows. In addition to returning fund flows, robust SMA demand has supported the appetite for high-quality municipals in the short end of the curve.
Fundamental Credit Strength Underscored by Upgrades, but Signs Point to Slowdown
- Muni credit quality continues to benefit from strong labor and real estate conditions, driving favorable tax collections. However, most recent reported U.S. Census Bureau 1Q23 state and local tax collection data highlighted a rare decline in overall state and local revenues, down 3.9% from 1Q22 to $473 billion. Despite the slowdown, collections remain near record levels and have contributed to robust reserves, which should provide flexibility ahead of an economic contraction.
- Rating agencies continue to process implications of municipal credit improvement, as upgrades outpaced downgrades by a factor greater than 7-to-1 in the first half of 2023. Moody’s, S&P and Fitch upgraded $432 billion of outstanding municipal debt, and downgraded just $60 billion of outstanding issuance, according to Bloomberg data. Sectors leading upgrades included GO, school districts and appropriation-backed issuance.
- Signs of a slowdown are also reflected in first-time payment defaults, which totaled $1.2 billion through the first half of the year, up 65% from $759 million from the first half of last year. YTD defaults remain contained within the high-yield municipal market, predominantly within the health care, project finance and senior living sectors.
Valuations Attractive, but Not Everywhere
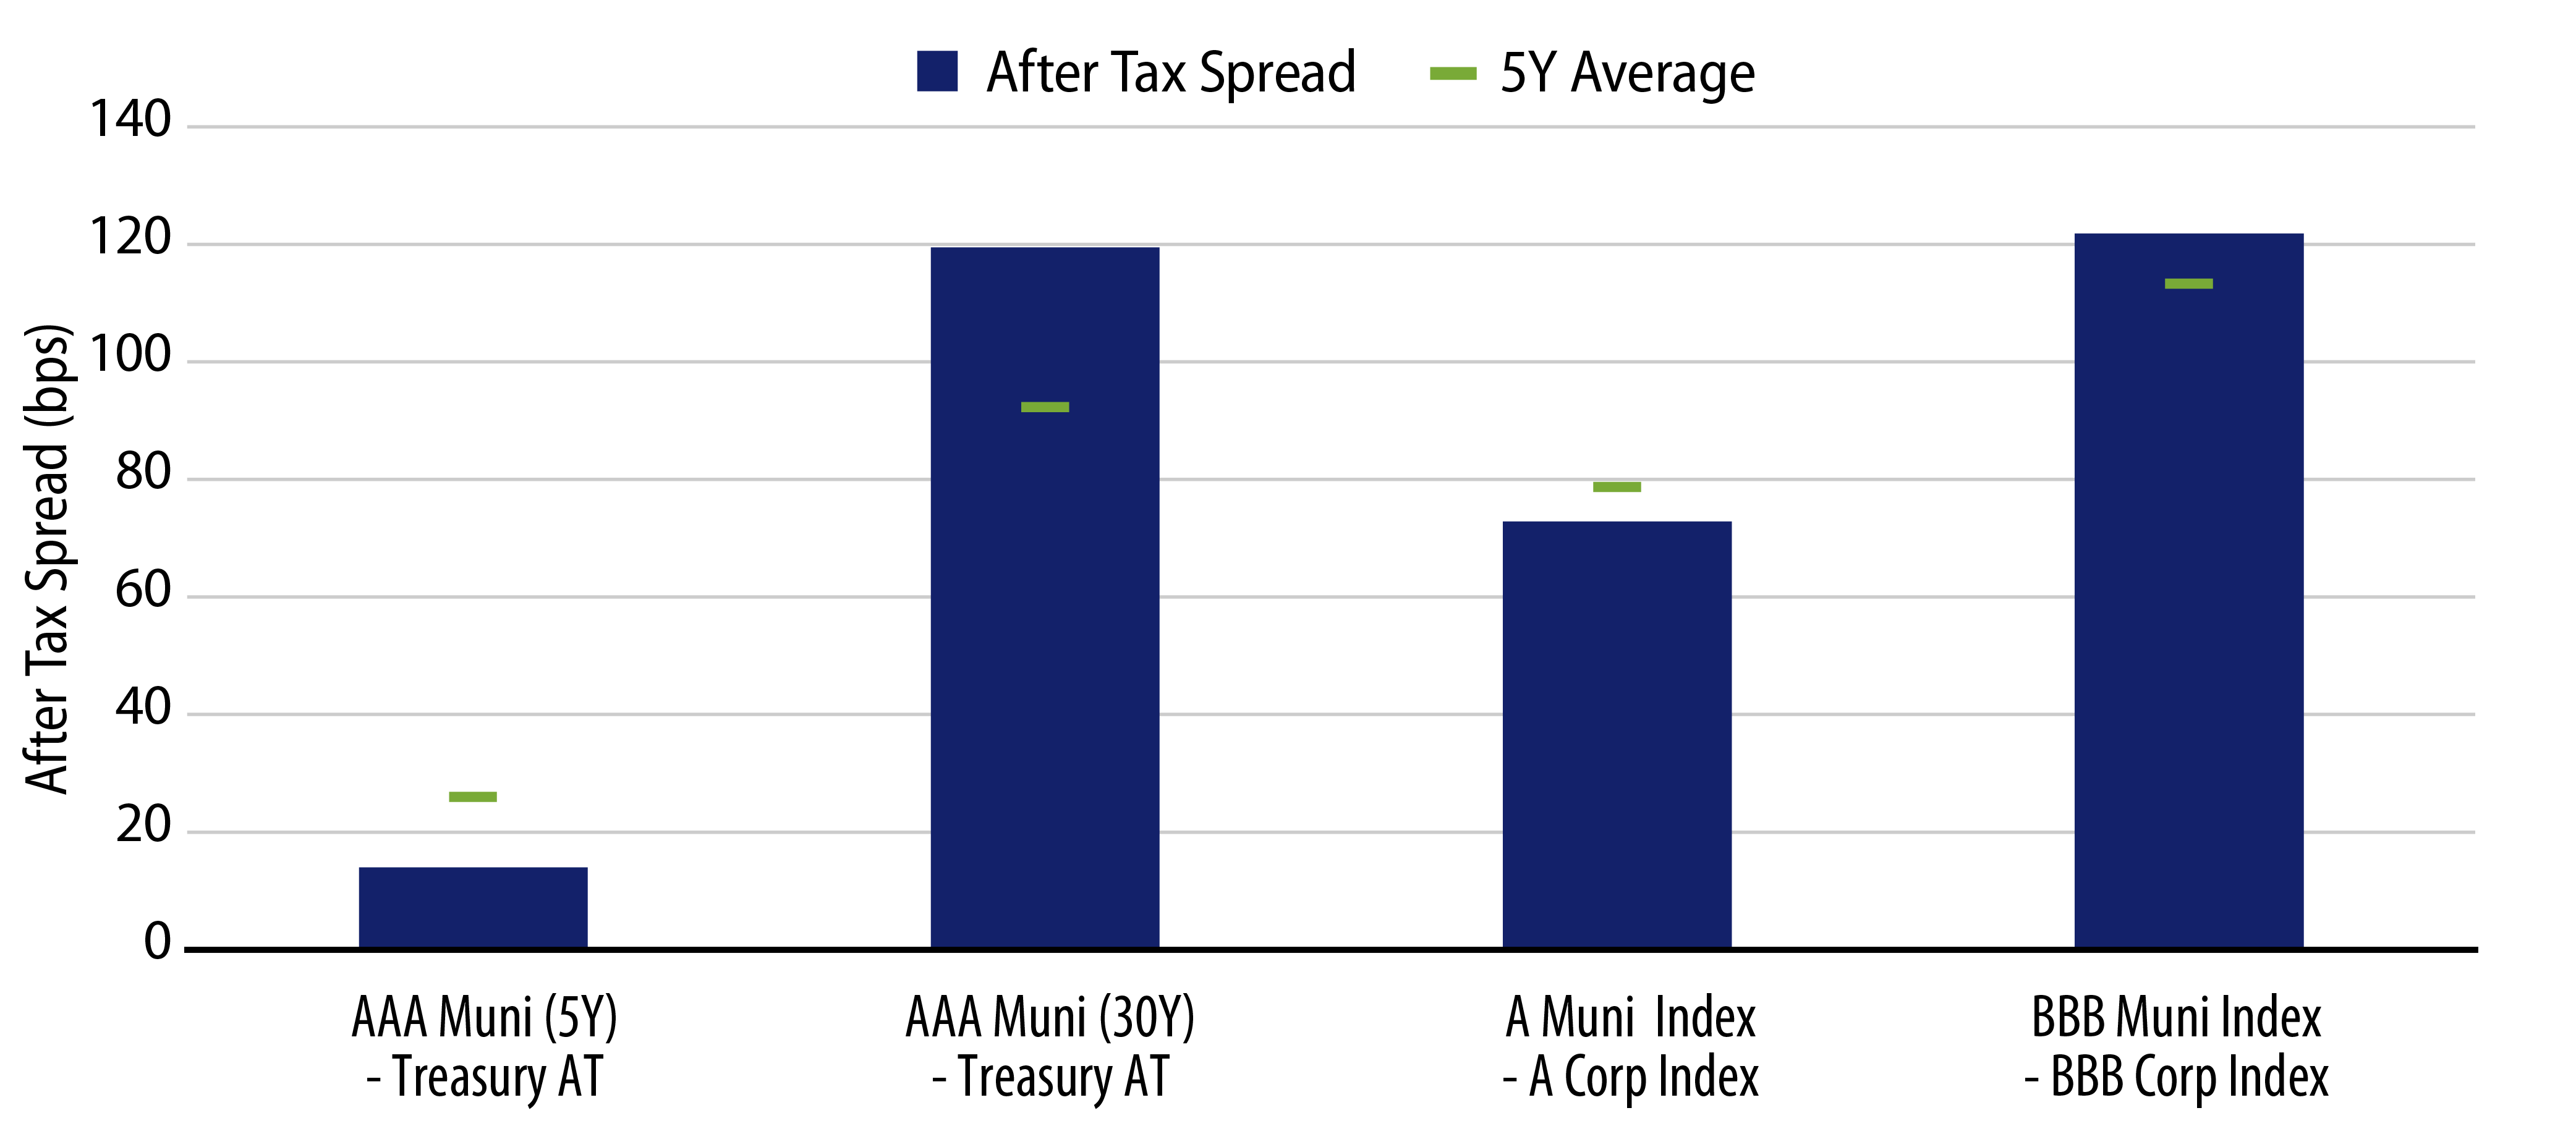
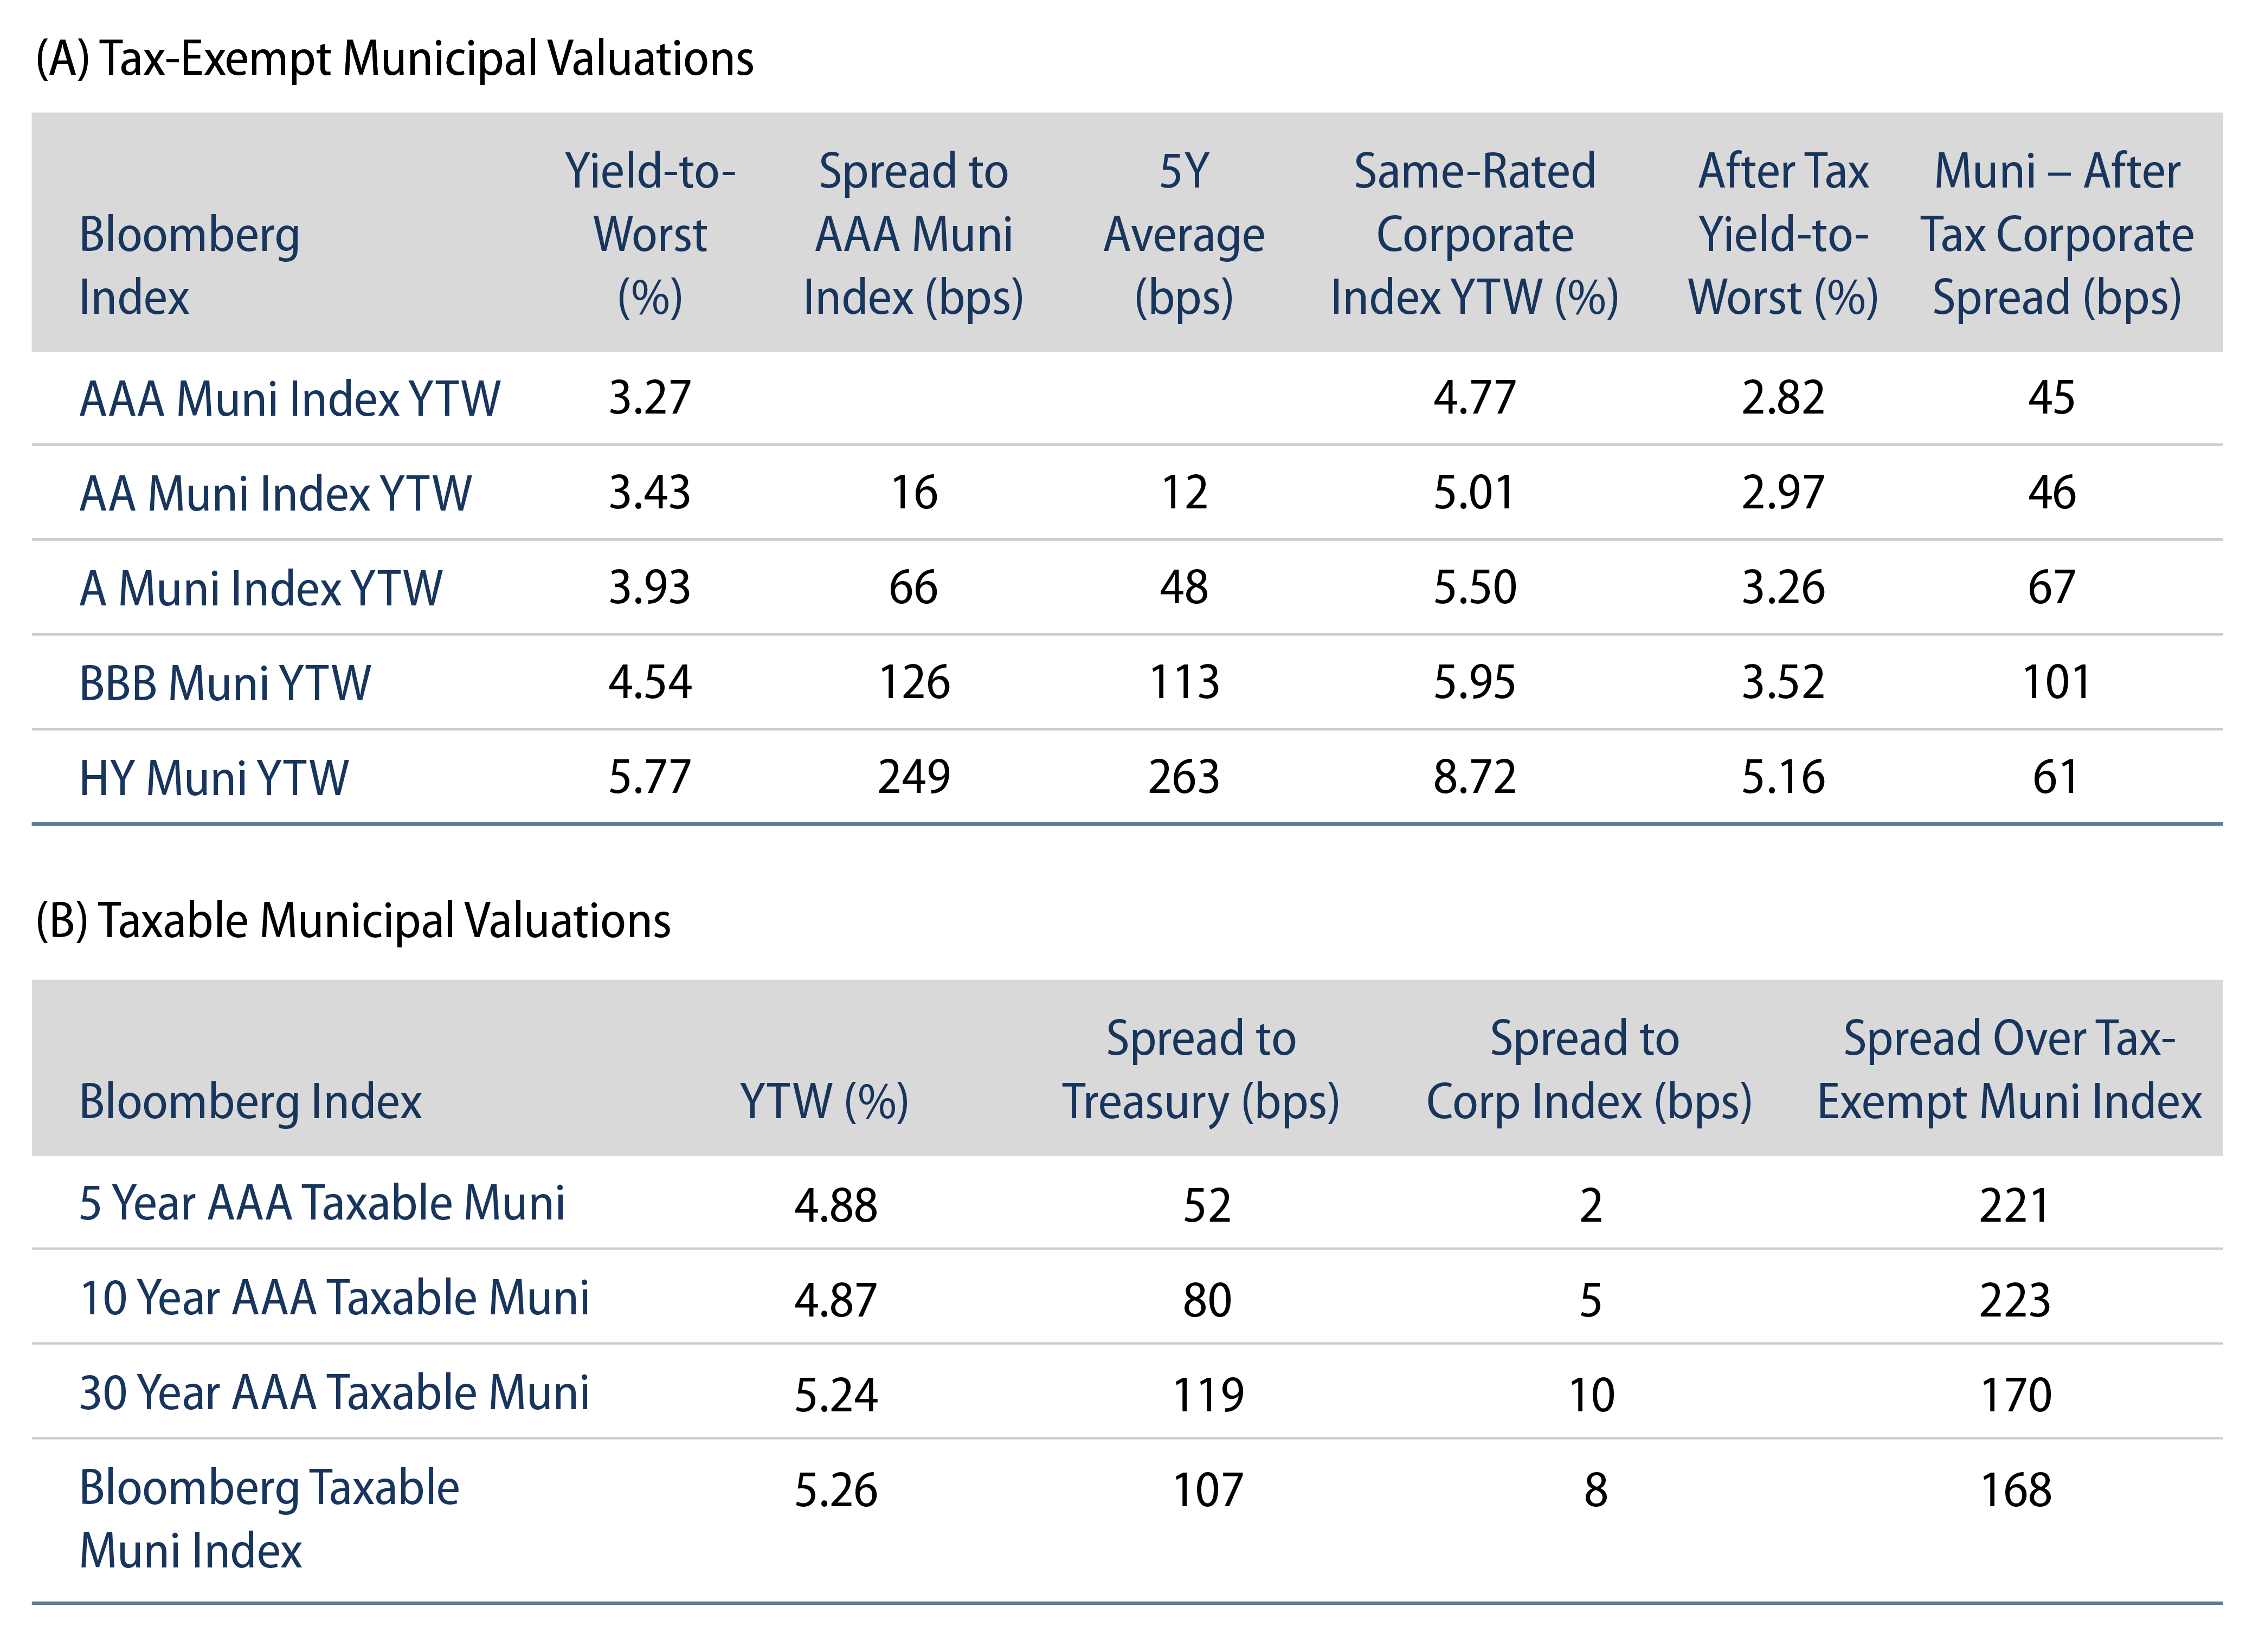
- Municipal yields remain near decade highs, offering investors an opportunity to lock in better tax-exempt income opportunities than in recent history. However, we believe relative value opportunities are not equal across the curve and credit spectrum.
- The after-tax yield pickup between shorter-term AAA munis and short-term Treasuries remains below historical averages, as the 5-year AAA muni yield only offers 14 bps of excess yield versus like-duration Treasury yield after consideration of the top tax bracket. The longer-term portion of the AAA scale offers more compelling opportunities as the 30-year municipal yield offers approximately 124 bps of after-tax yield pickup.
- Down the credit spectrum, BBB municipals offer an above-average 120 bps in excess spread versus BBB corporates, despite BBB municipals defaulting less frequently (10-year Moody’s default rate of 1.1%) than BBB corporates (3.4% default rate).