マーケット・ブログ
MARKETS
02 July 2025

Weekly Municipal Monitor—Mid-Year Update

By Sam Weitzman

Macros, Markets and Munis

Municipals posted positive returns last week as economic data came in weaker and rates trended lower. Treasury yields rallied 6-16 basis points (bps) across the curve, while high-grade munis generally trailed rates lower and underperformed amid persistent elevated supply conditions. As geopolitical tensions eased, fixed-income markets focused on Federal Reserve rhetoric, which signaled likely cuts later this year. This was supported by weaker-than-anticipated economic data as consumer confidence fell below expectations and 1Q GDP came in at -0.5%, well below the prior quarter and expectations of -0.2%. Meanwhile, muni supply remained elevated amid modest inflows.

Muni Issuance Remained Elevated Despite the Holiday

Fund Flows (up $77 million): During the week ending June 25, weekly reporting municipal mutual funds recorded $77 million of net inflows, according to Lipper. Short and short-intermediate categories recorded the majority inflows, at $134 million collectively. Long-term funds recorded $156 million of outflows, intermediate funds recorded $99 million of inflows and high-yield funds recorded $45 million of inflows. Last week’s inflows marked a ninth consecutive week of inflows and led year-to-date (YTD) inflows higher to $10 billion.

Supply (YTD supply of $278 billion; up 27% YoY): The muni market recorded $13 billion of new-issue supply last week, remaining at elevated levels. YTD new-issue supply of $287 billion is 27% higher than the prior record year’s pace, with tax-exempt issuance up 8% and taxable issuance up 29%, respectively. This week’s calendar is expected to decline to $7 billion ahead of the July 4 holiday. The largest deals include $939 million Massachusetts Bay Transportation Authority and $834 million Kentucky Public Energy Authority transactions.

This Week in Munis: Mid-Year Update
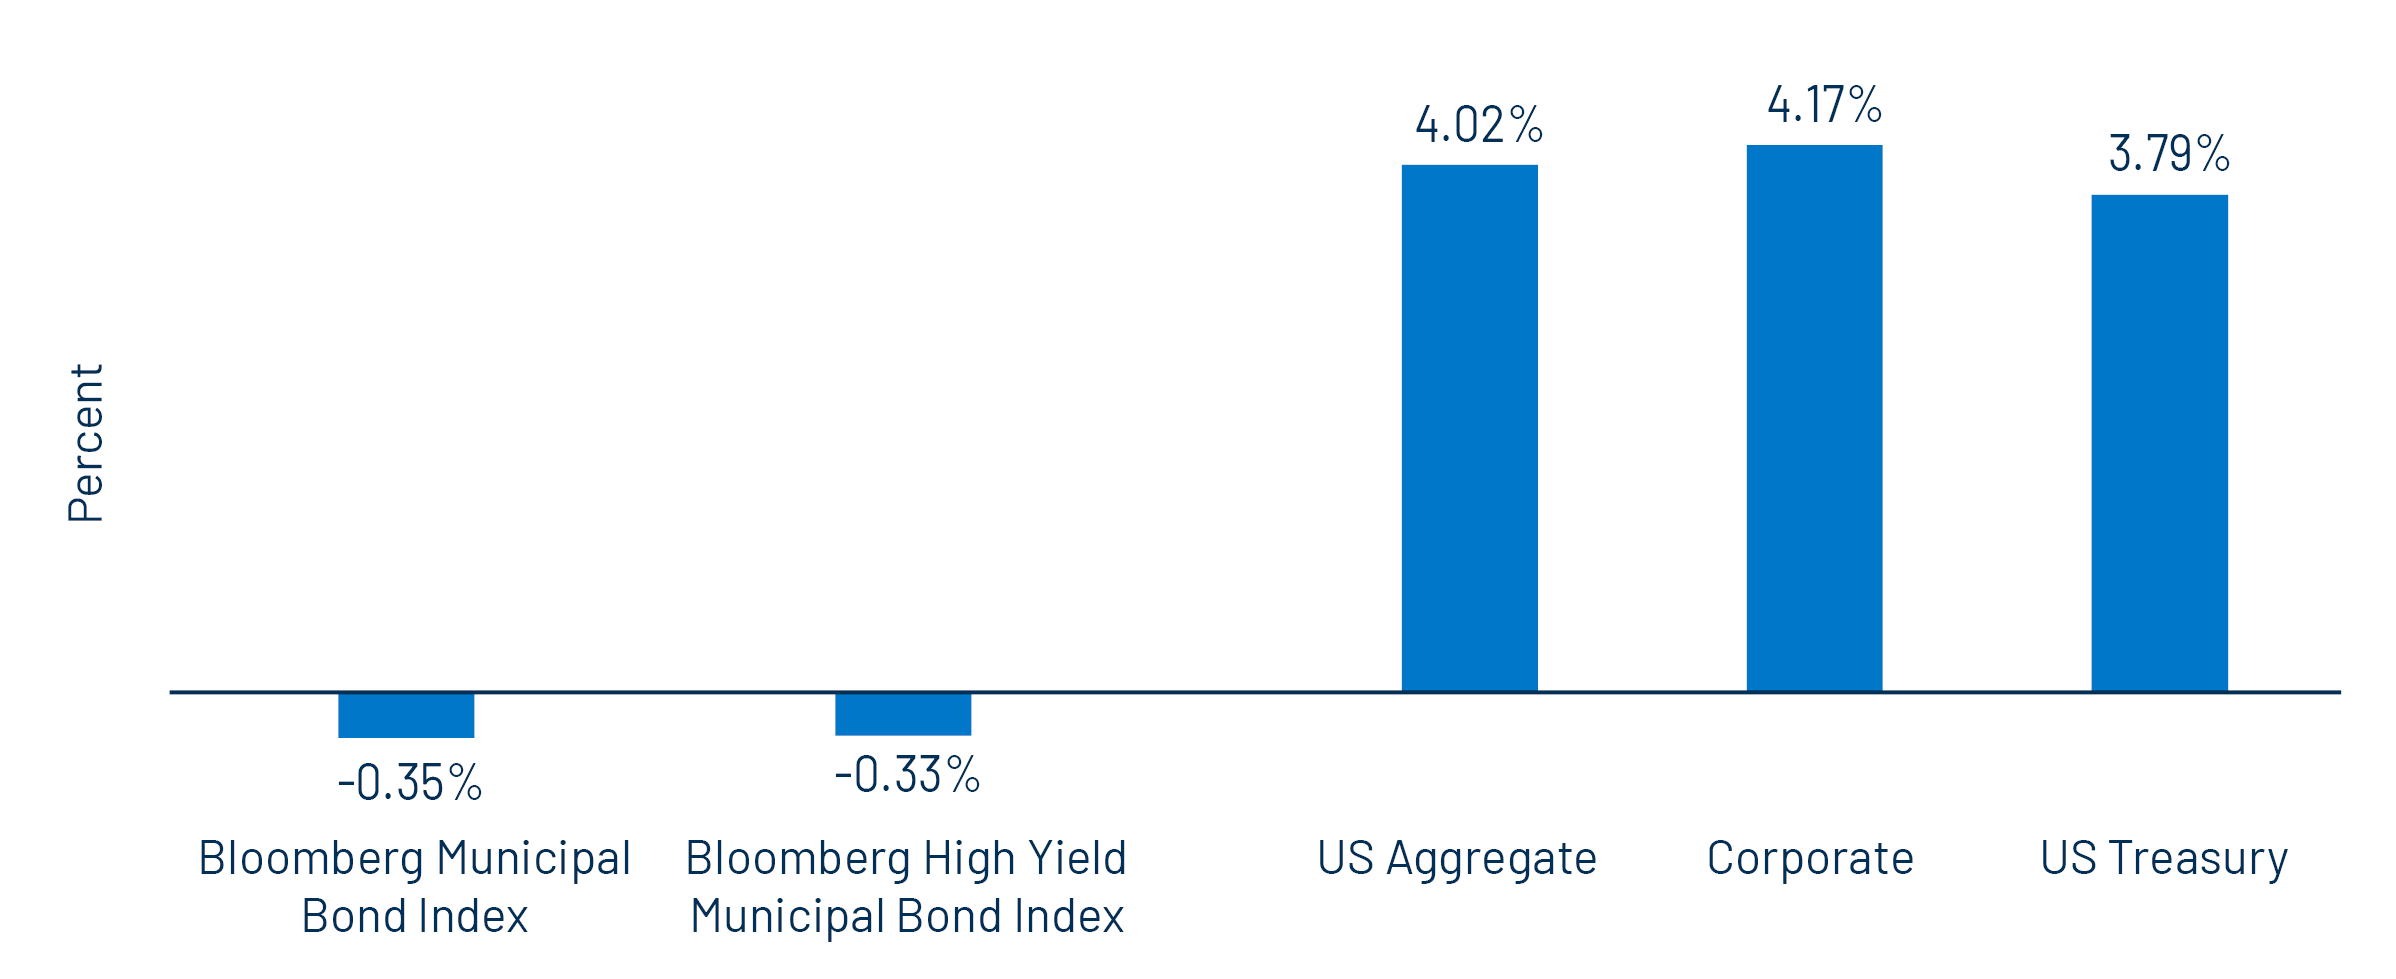
Performance
The muni market posted negative returns in the first half of the year as the market contended with record supply levels, tax season weakness and broader rate volatility associated with the potential outcomes of tariff policies. The investment-grade Bloomberg Municipal Bond Index returned -0.35% in the first half of the year, underperforming the stronger returns observed in taxable fixed-income markets. Shorter-duration securities generally outperformed as the municipal yield curve steepened, with longer-maturity yields moving higher and shorter-maturity yields moving lower, contrasting with the Treasury market, where yields moved lower across most maturities.
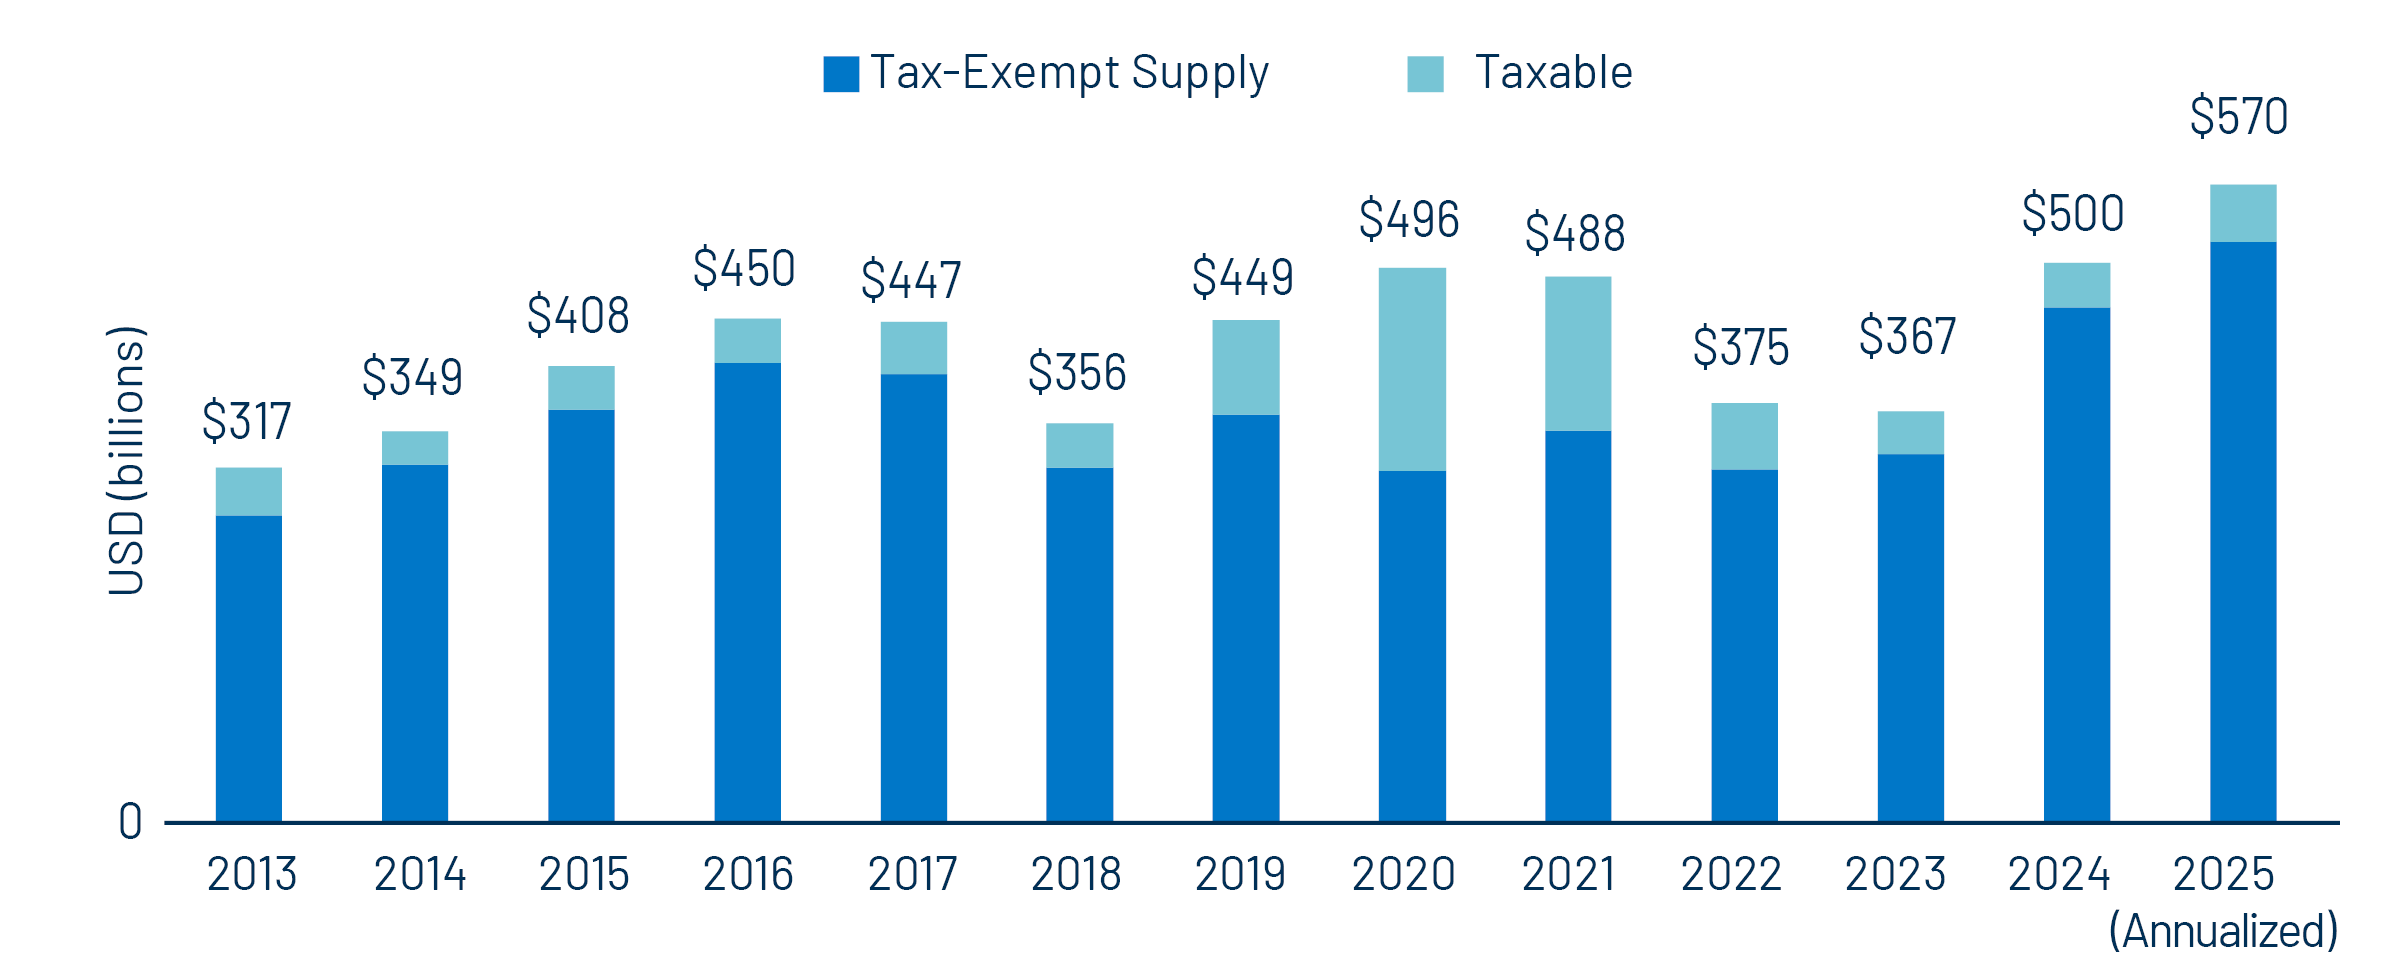
Exhibit 1: Bloomberg Index YTD Returns
Bloomberg Index YTD Returns
Source: Western Asset, Bloomberg. As of 30 June 25. Select the image to expand the view.

Supply/Demand
New issuance reached $285 billion in the first half of the year, up 19% from 1H24, a record level itself. Tax-exempt municipal issuance of $259 billion was up 18% year-over-year (YoY). Taxable supply of $26 billion was 21% higher than the levels of the prior year. Muni supply is on pace to reach $570 billion in 2025, $70 billion (+14%) above last year’s record levels.

Exhibit 2: Historical Muni Supply
Historical Muni Supply
Source: Western Asset, Bloomberg. As of 30 June 25. Select the image to expand the view.

Municipal mutual funds recorded approximately $10 billion of net inflows in the first half of the year, according to Lipper. YTD fund flows were largely concentrated in short and short/intermediate strategies, which recorded over $6 billion of inflows. High-yield municipals also recorded strong flows of $4 billion. While positive, when considering the $52 billion of net inflows recorded since January 2024, demand for municipal funds remains limited relative to the magnitude of the greater than $120 billion of outflows observed in 2022 and 2023.
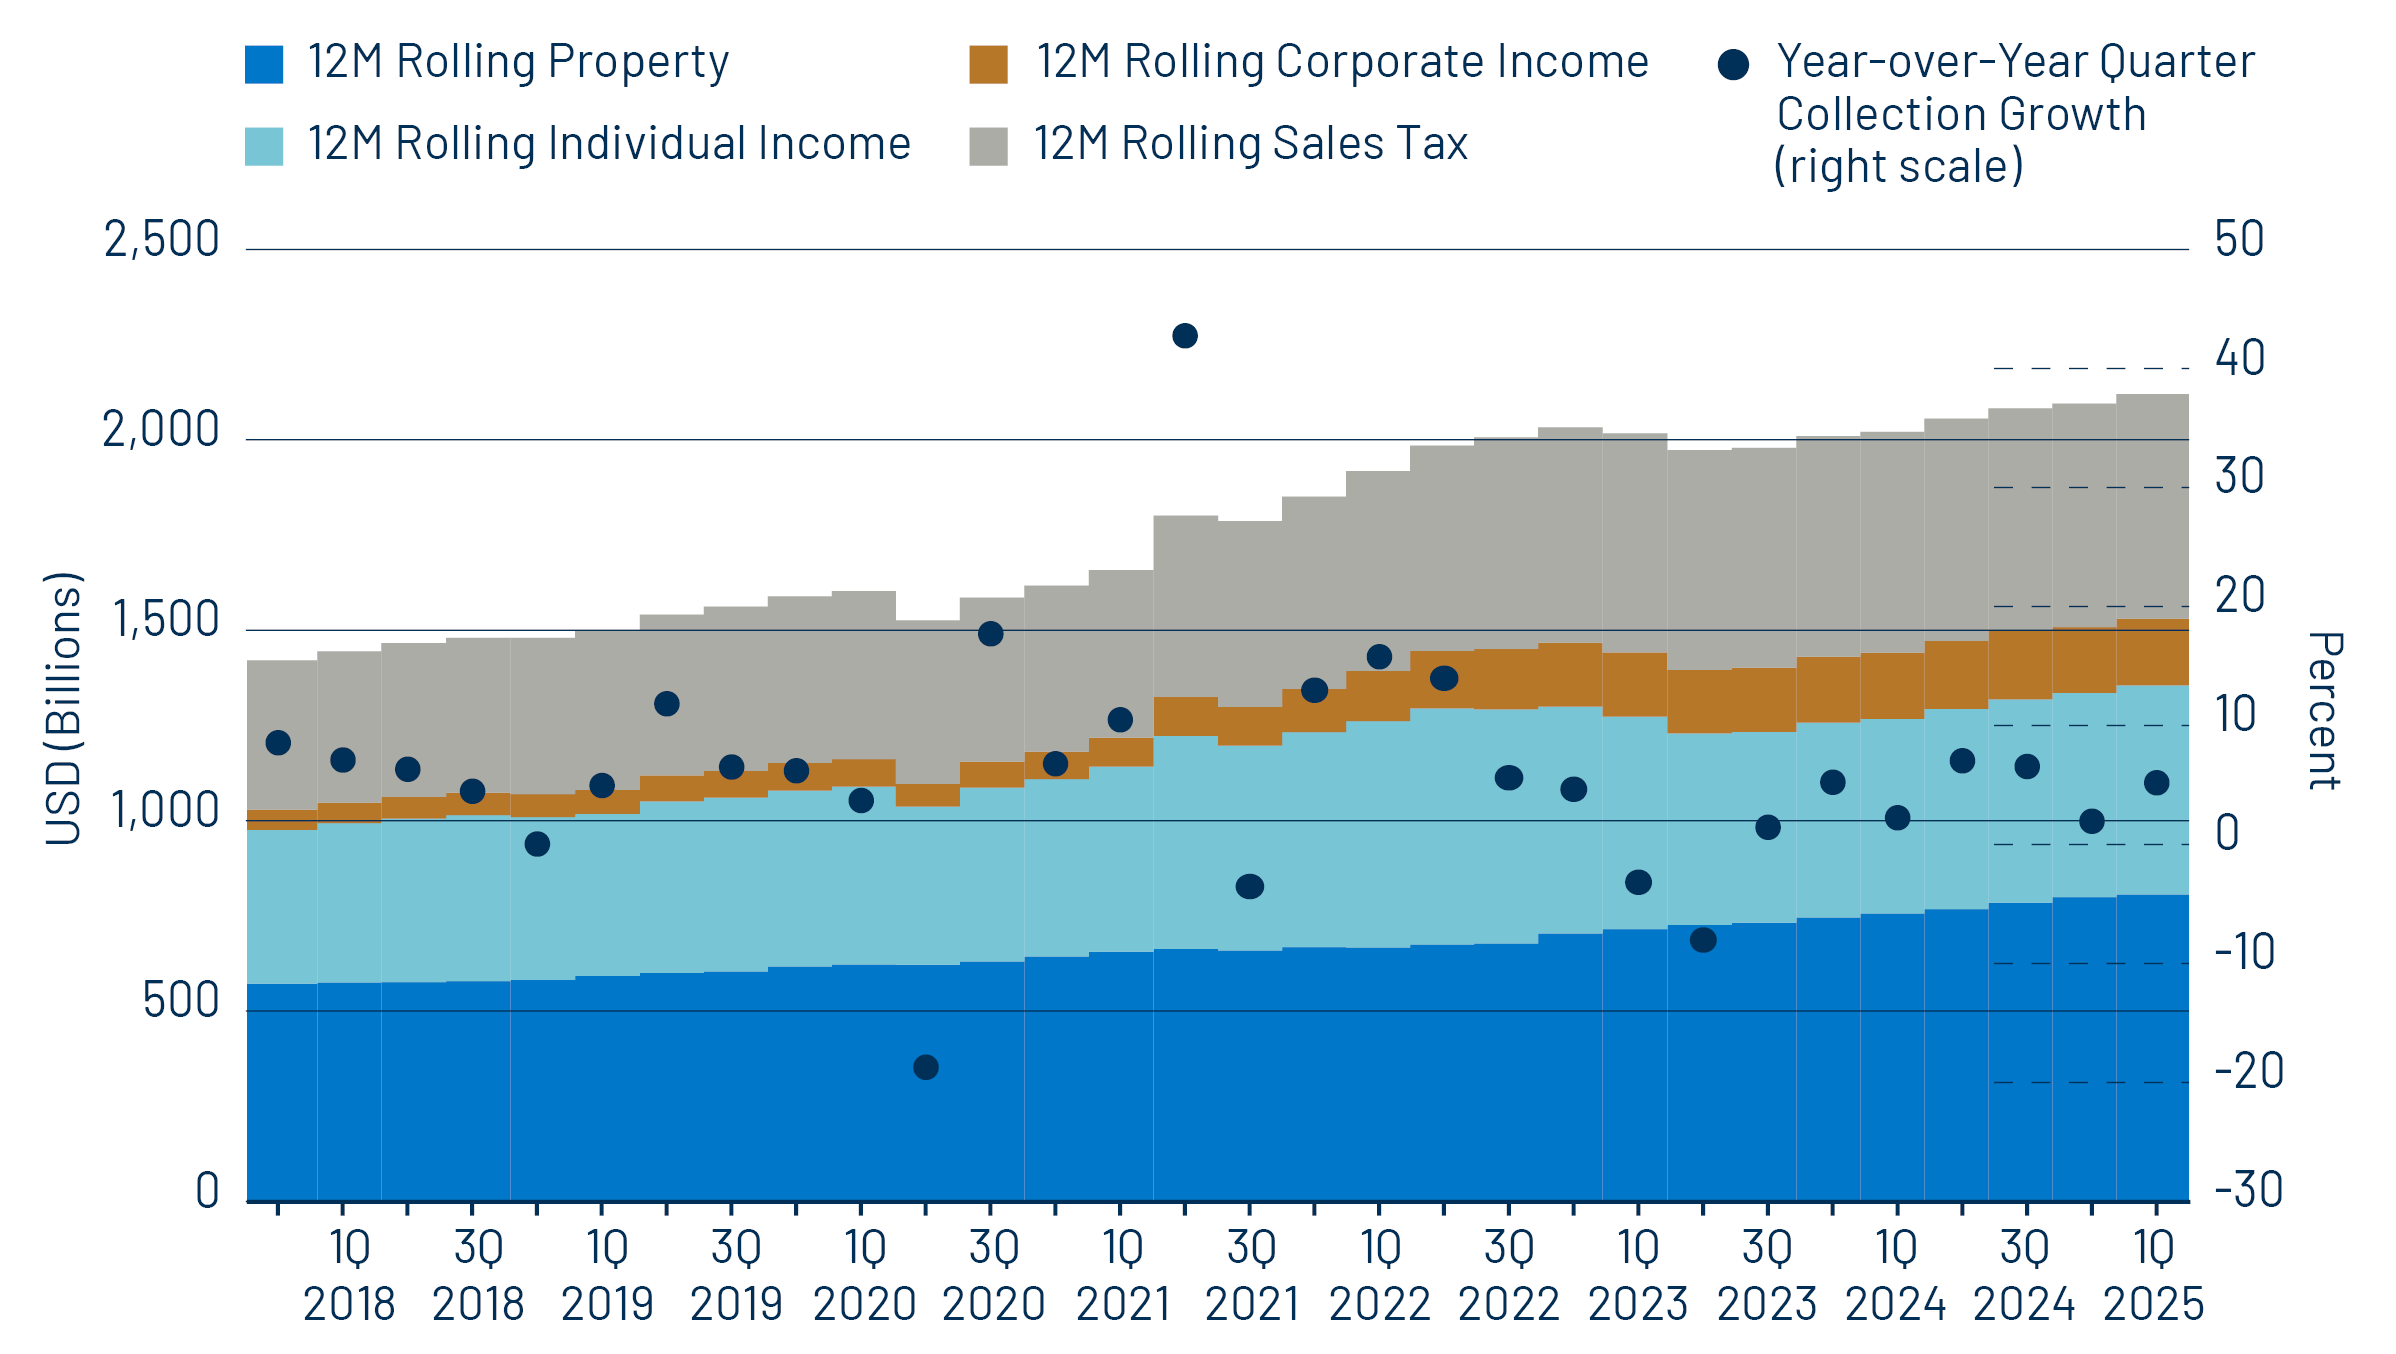
Fundamentals
The Census released 1Q25 state and local tax collection estimates, which indicated continued revenue growth for state and local governments. First quarter major state and local government tax collections increased 5.2% from 1Q24 levels to $512 billion. Among the major state revenue sources, individual income taxes increased 10%, corporate income tax collections increased 8% and sales tax collections increased 2% YoY. Property tax collections, the primary source of revenues for local governments, increased 4% YoY to $194 billion.

Exhibit 3: 12-Month Trailing State and Local Revenue Collections
12-Month Trailing State and Local Revenue Collections
Source: Western Asset, Census Bureau. As of 12 Jun 25. Major state and local tax revenue; not seasonally adjusted. Select the image to expand the view.

While credit fundamentals remain generally strong, they show signs of slowing. The pace of credit rating improvement from the three major rating agencies slowed in 1H25. According to Bloomberg data, total entities upgraded (620) continued to exceed downgrades (472); however, total downgrades by par value of $122 billion outpaced upgrades of $112 billion. Meanwhile, first-time payment defaults totaled $1 billion, exceeding the prior year level of $711 million.
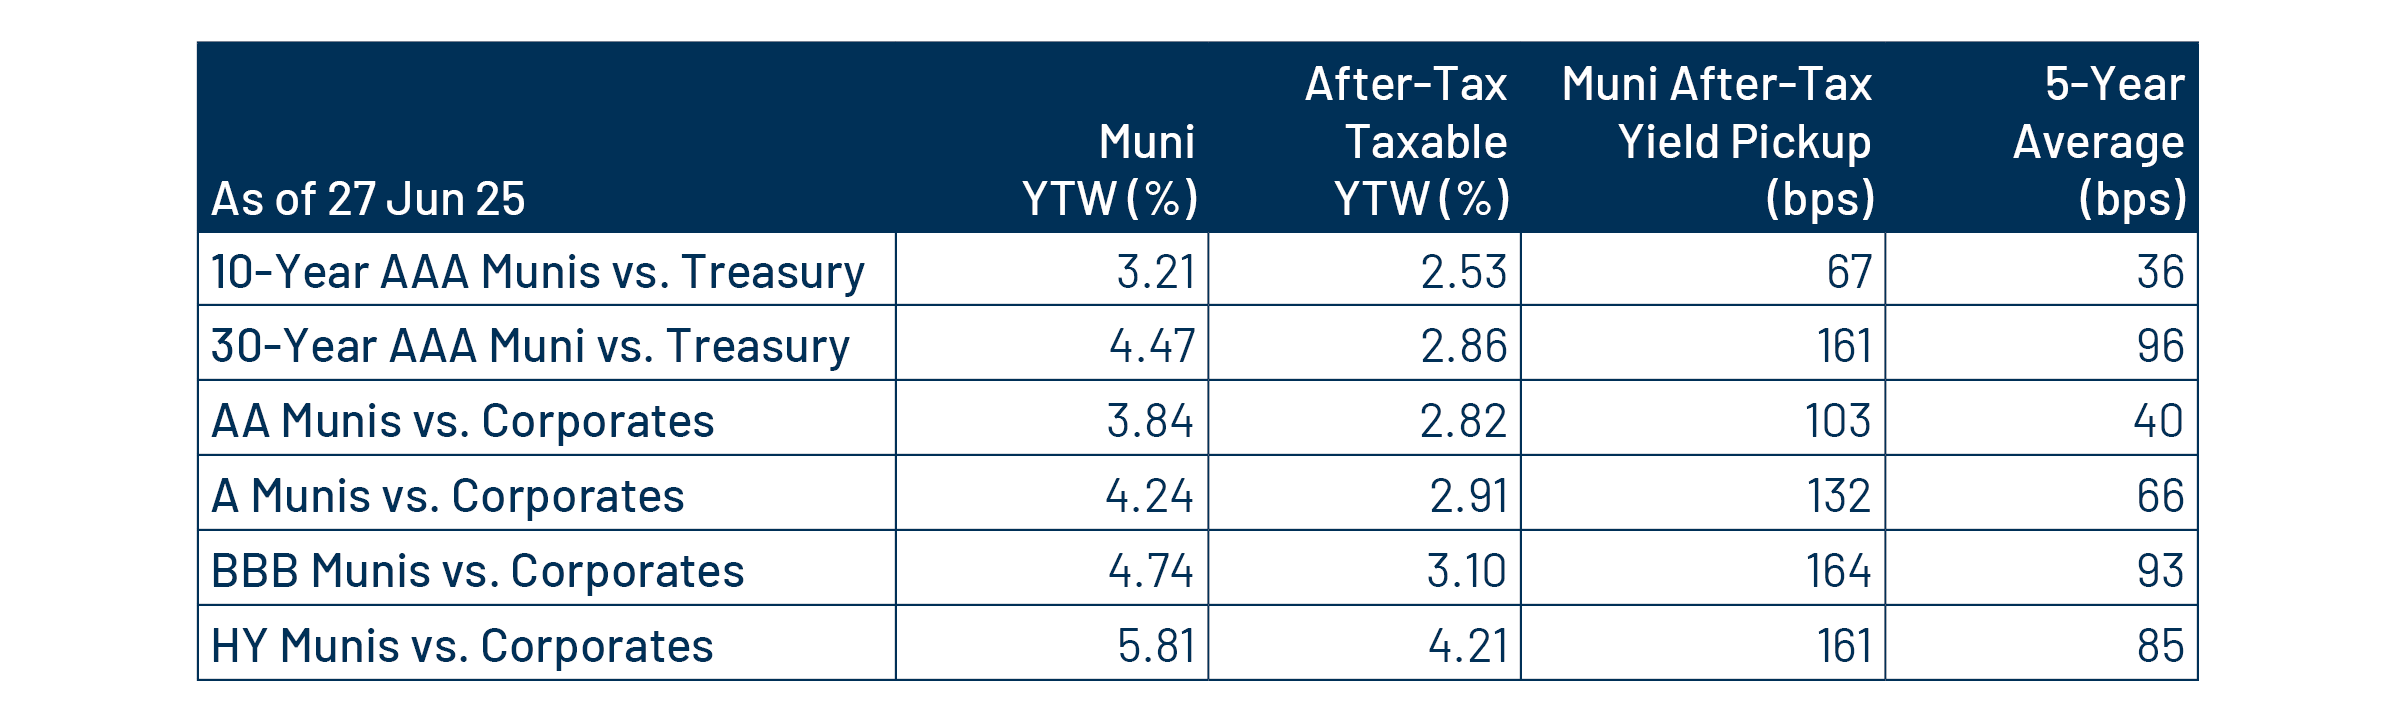
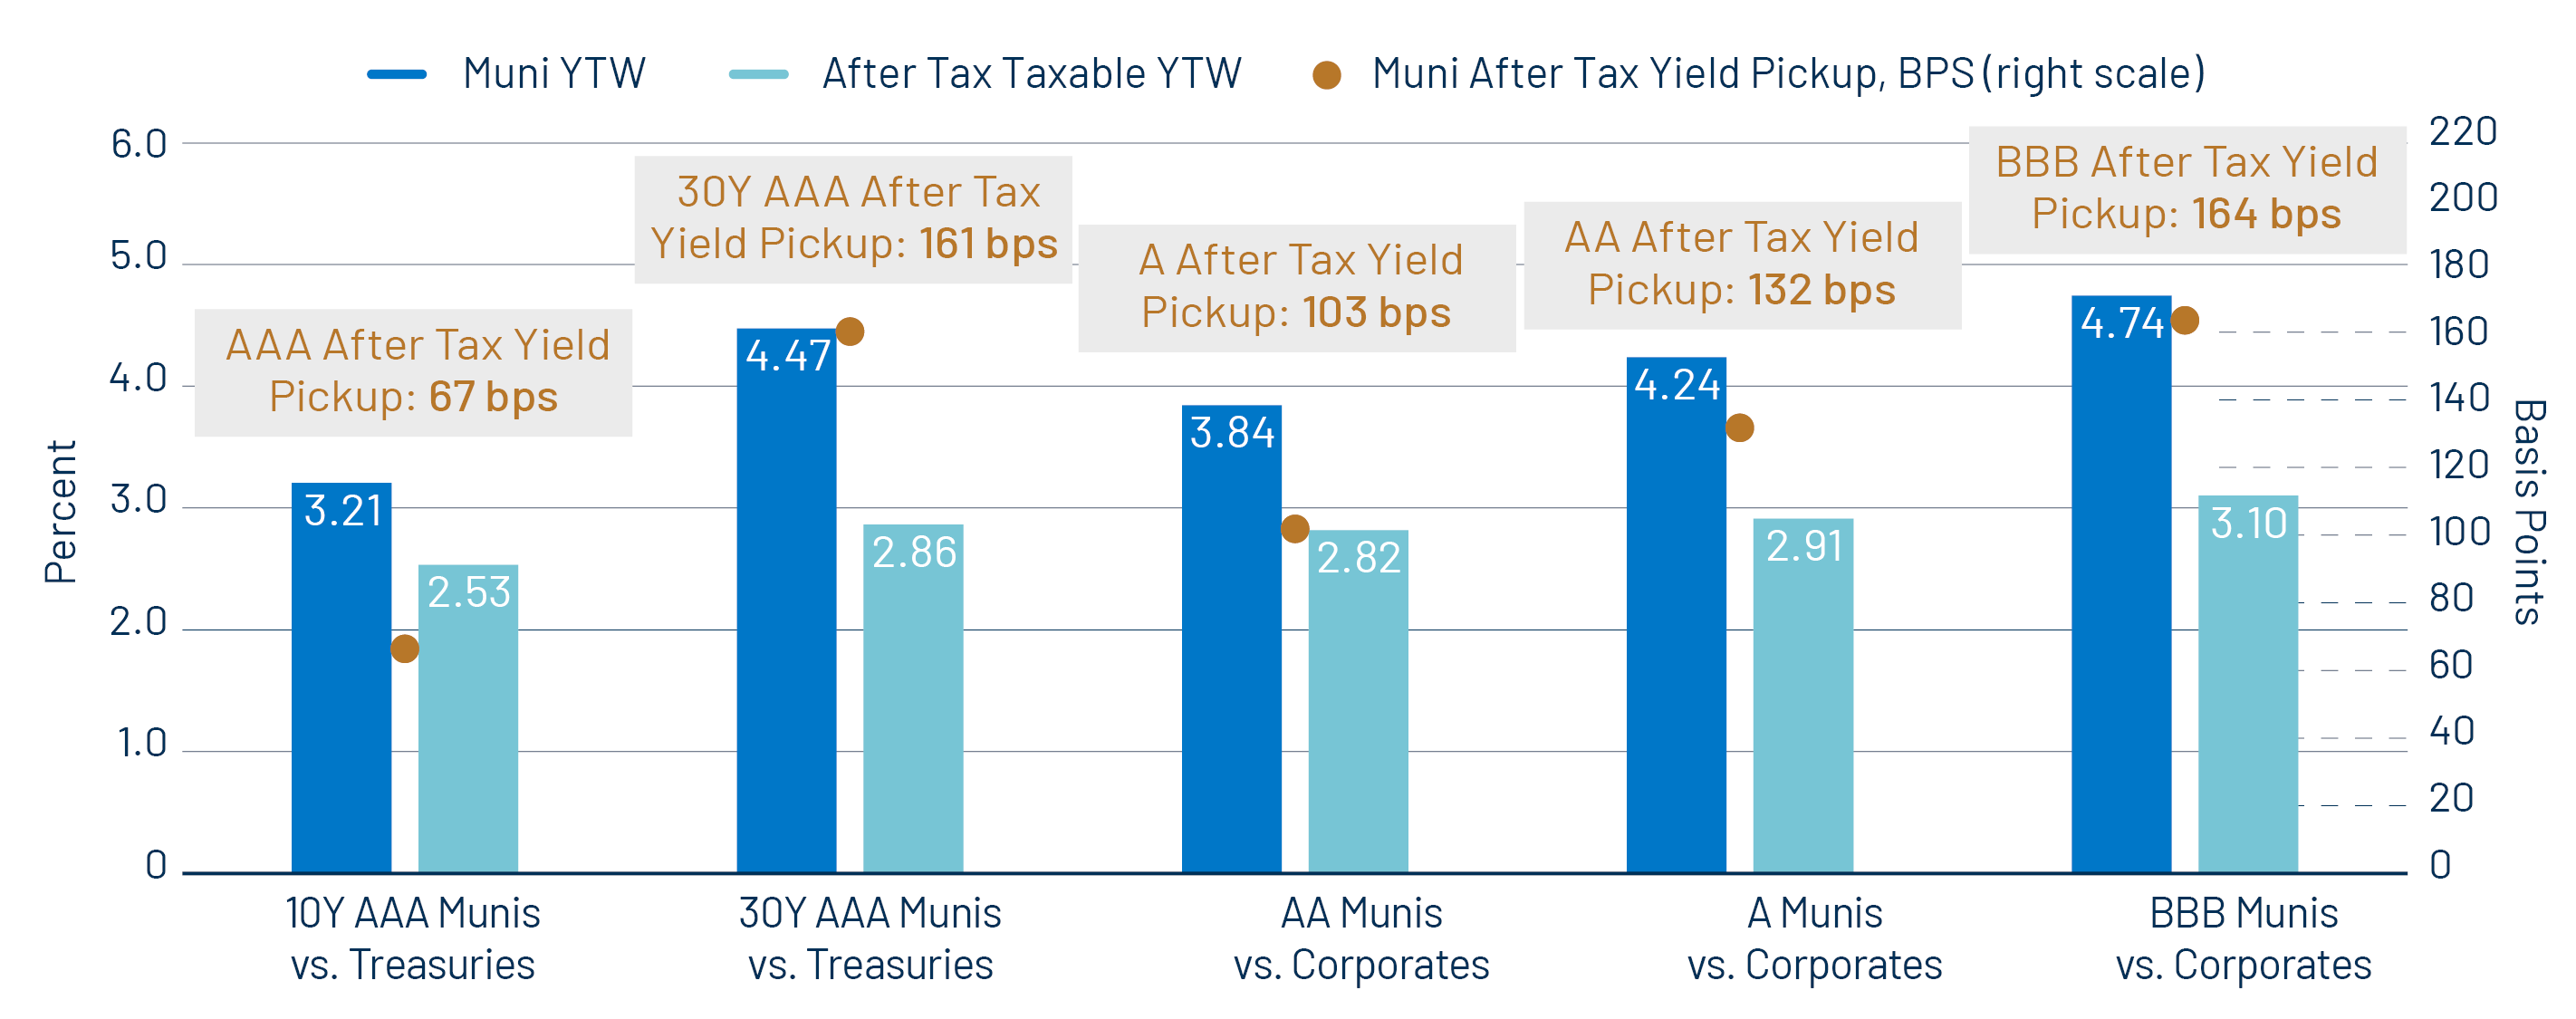
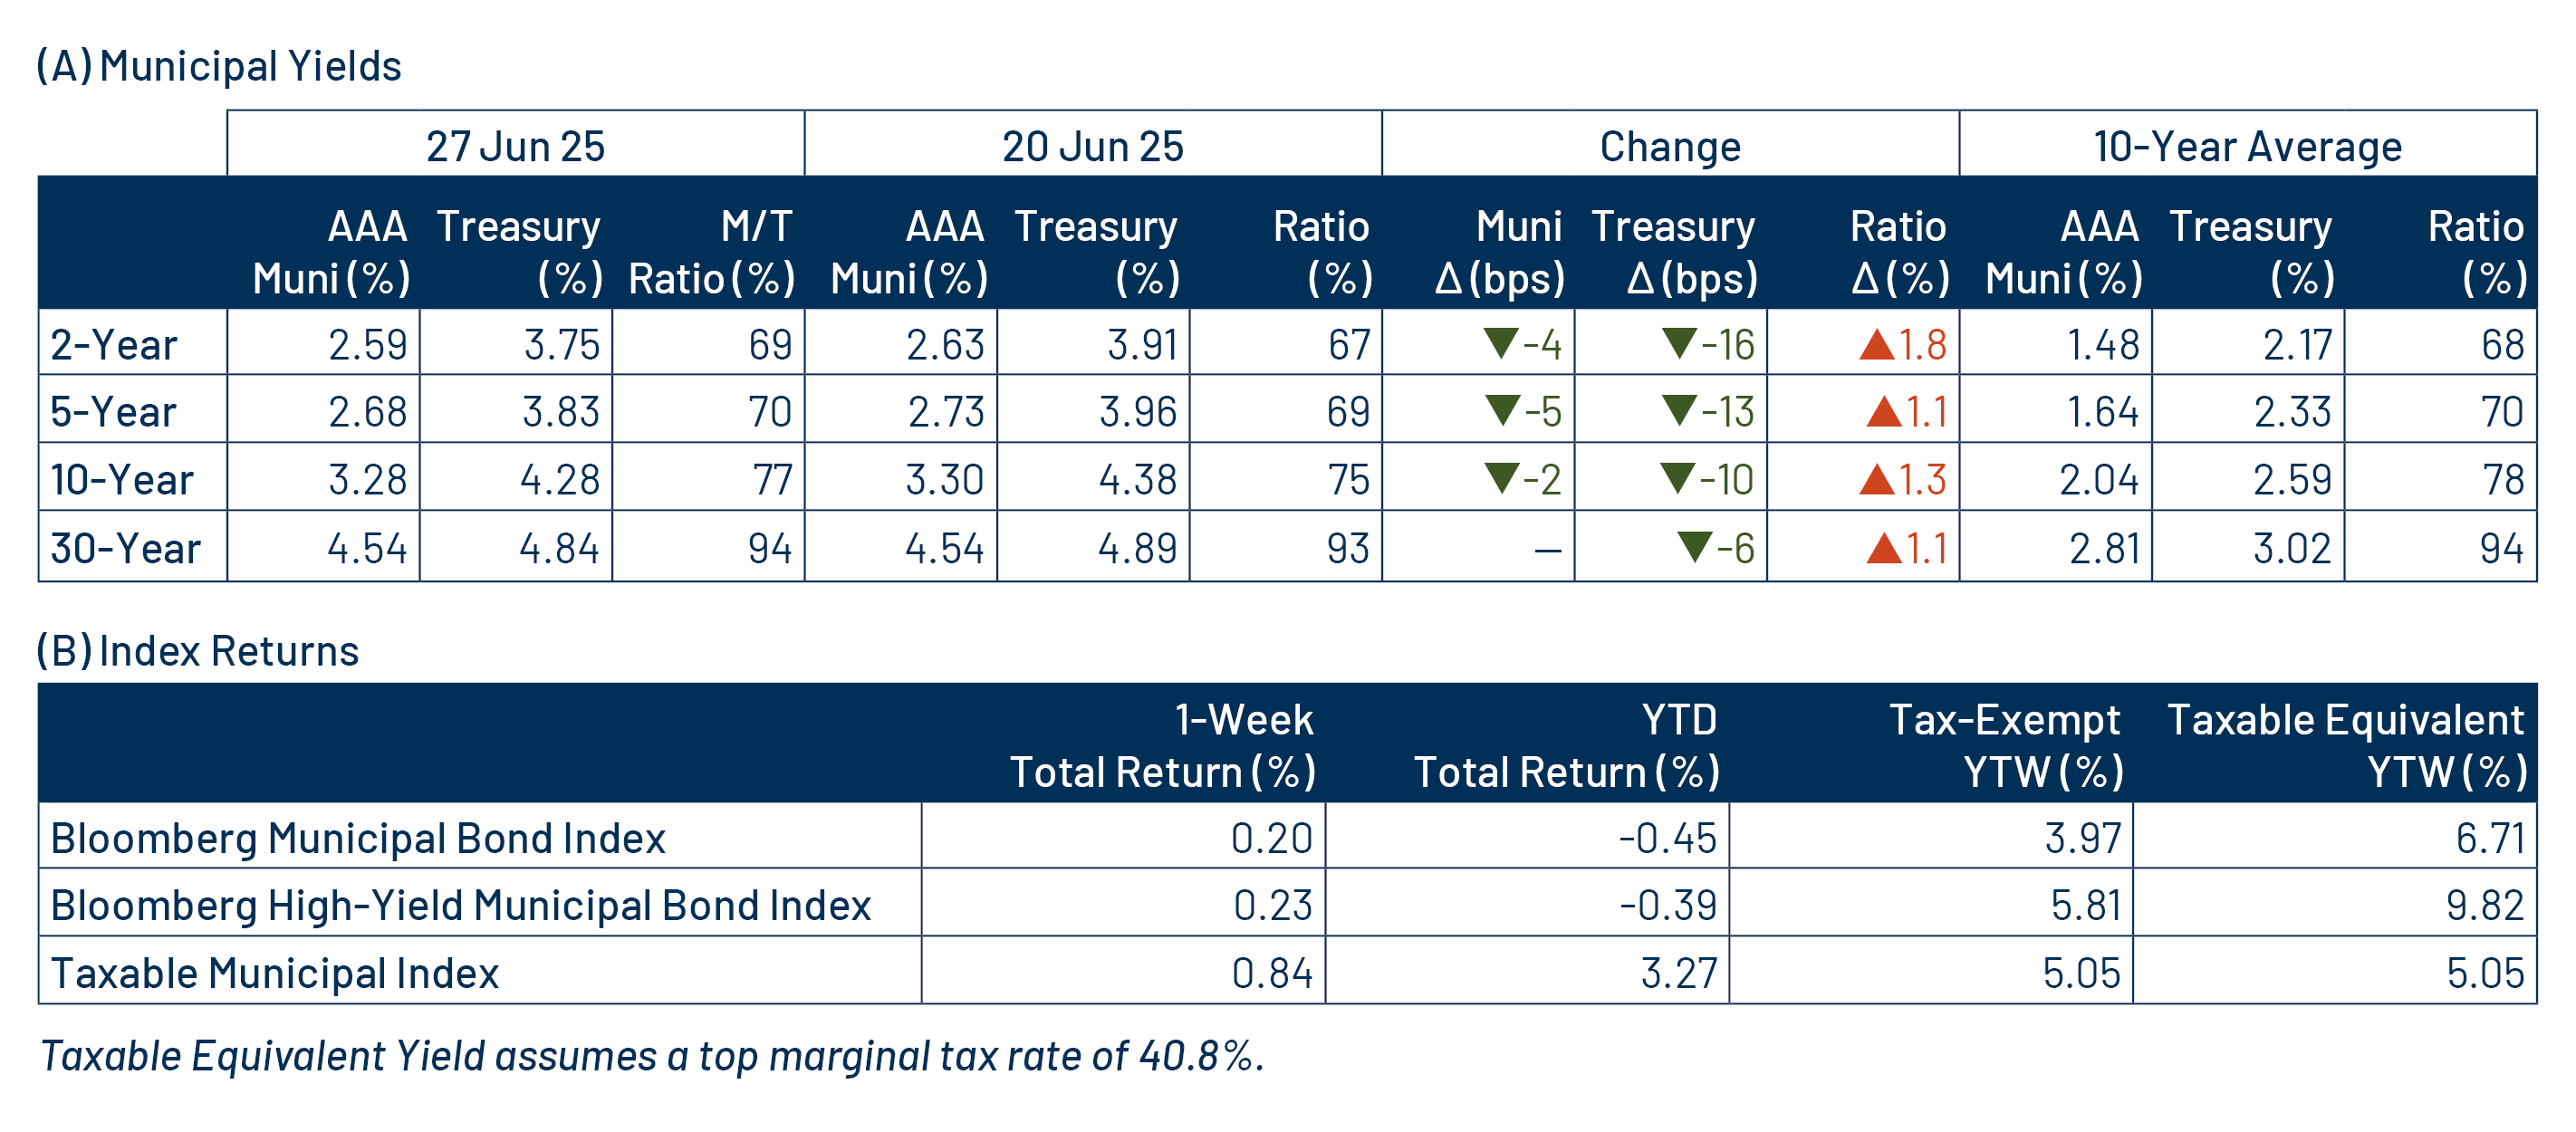
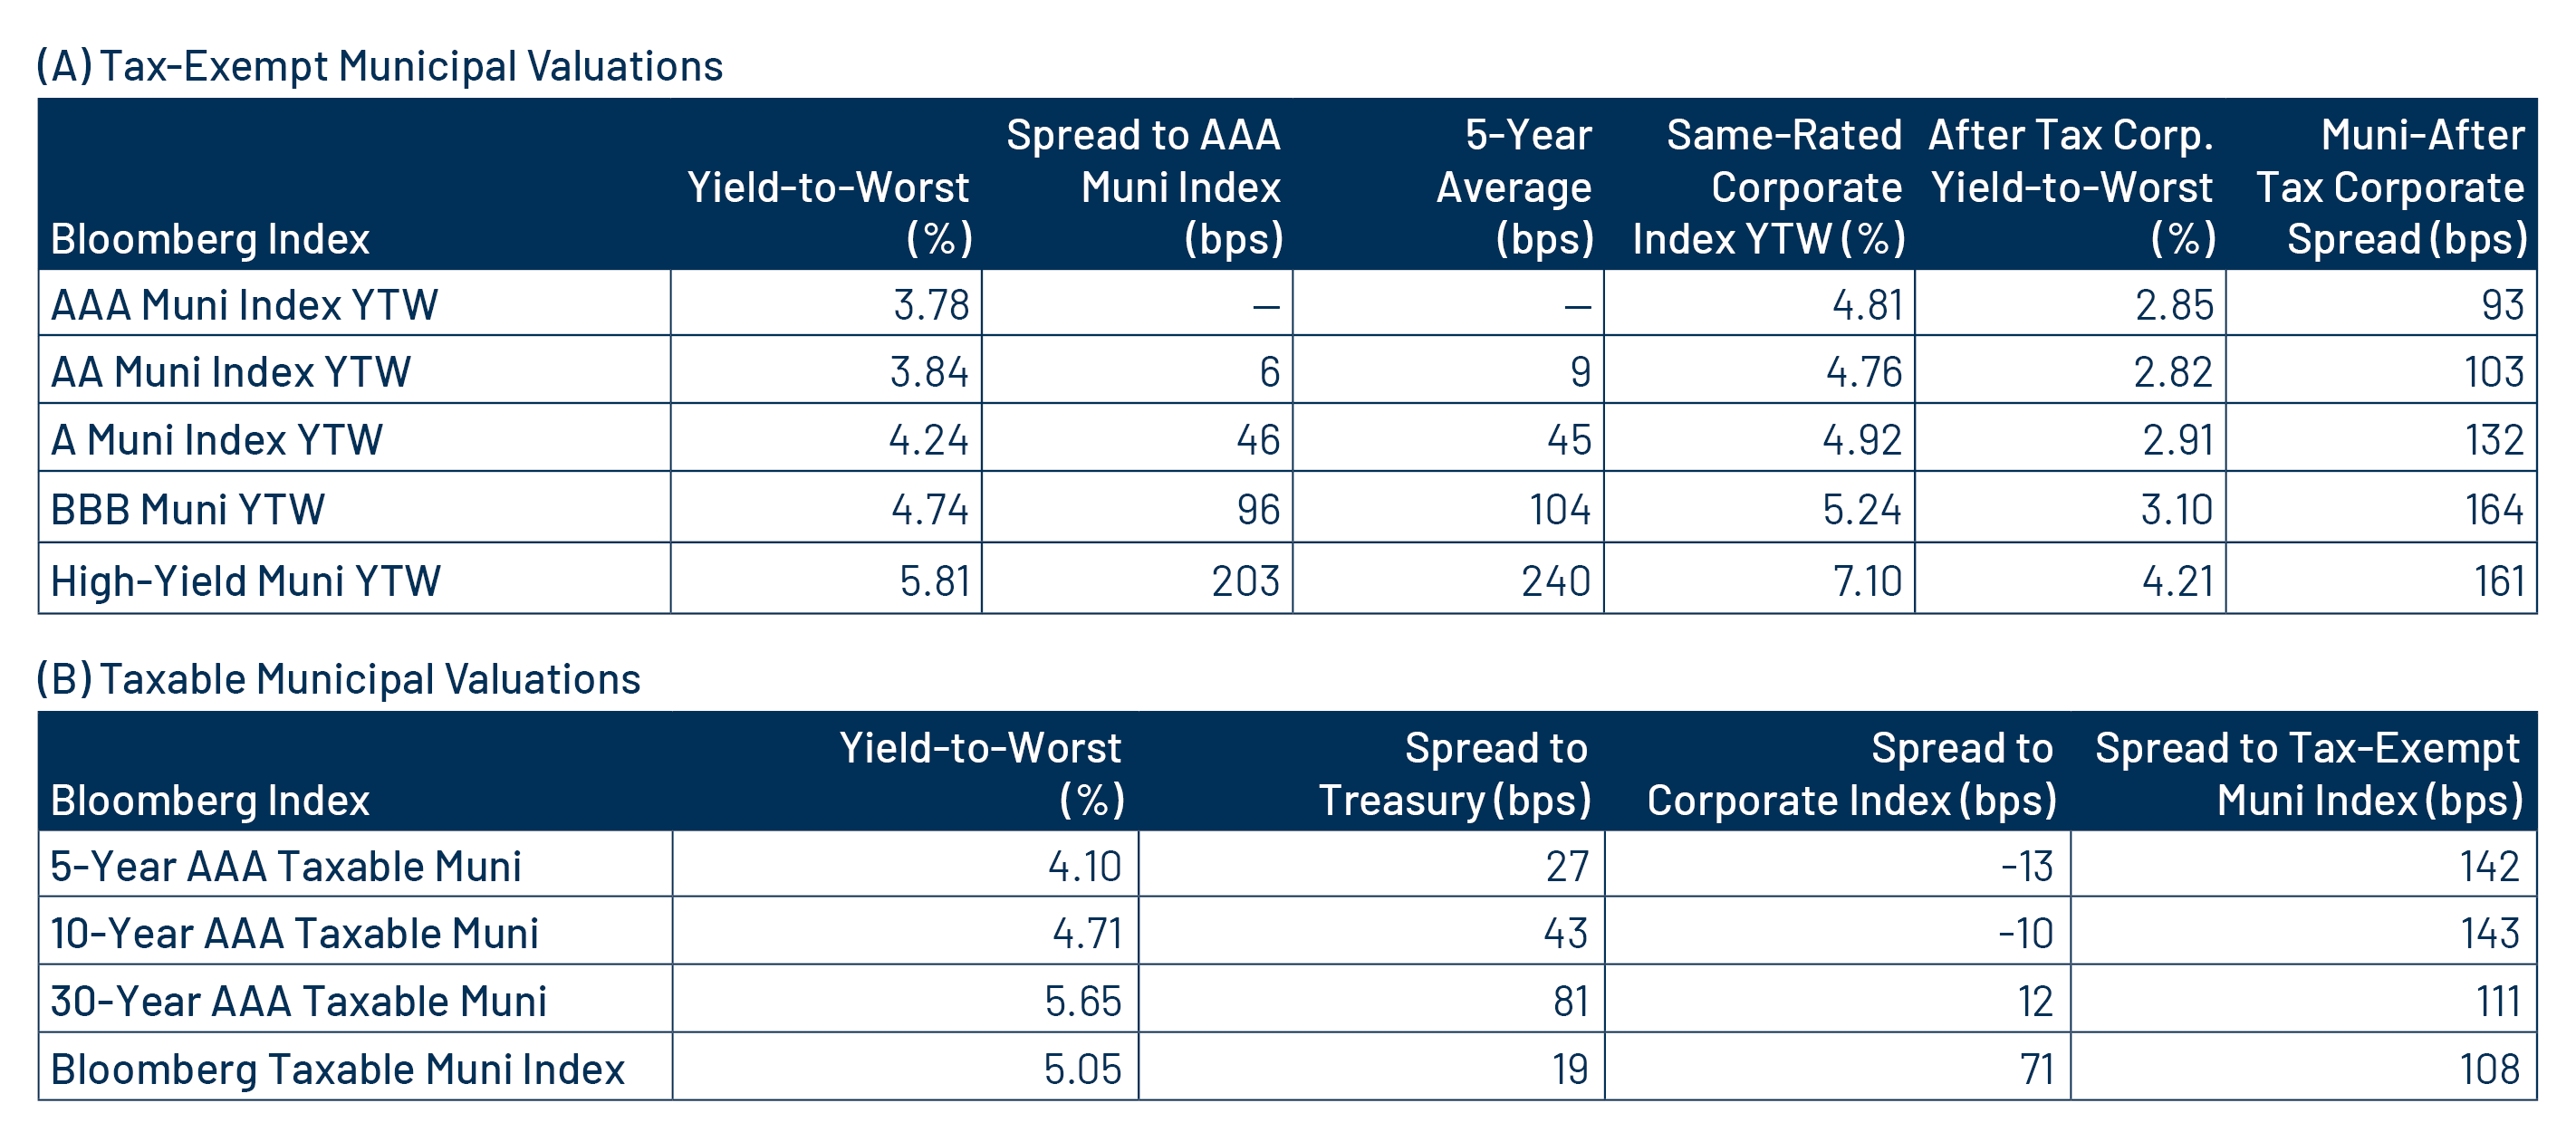
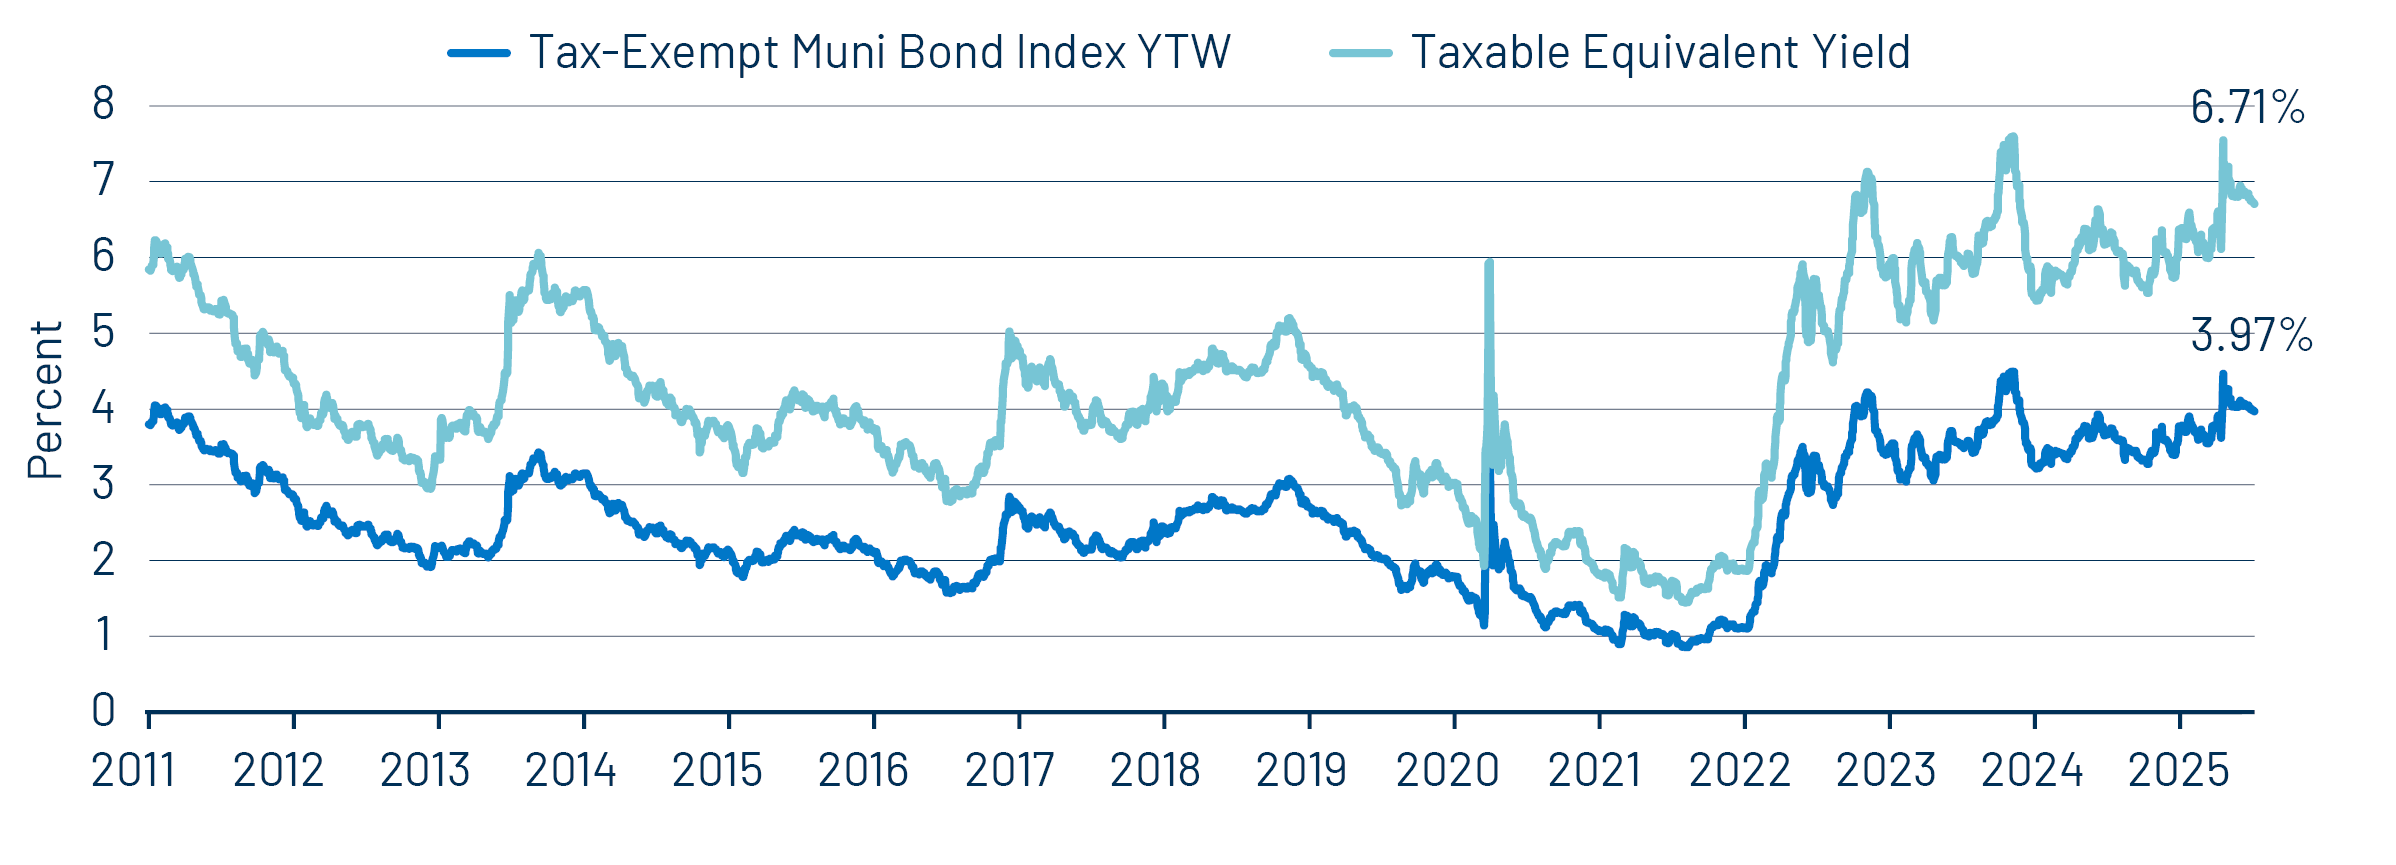
Valuations
YTD underperformance has resulted in higher tax-exempt municipal income opportunities and improved relative value of the municipal asset class. So far this year, the average Bloomberg Municipal Bond Index yield-to-worst (YTW) increased by 23 bps to 3.97%. Compared to taxable alternatives, municipals offer a compelling relative value proposition. Longer-duration and lower-investment-grade municipal credit offer above 100 bps of excess after-tax yield pickup versus like-structured Treasuries and corporate counterparts. We find that supply and demand imbalances that contribute to attractive entry points do tend to revert, and we expect that a potential supply slowdown in summer months, along with consistent demand, could support positive market sentiment and outperformance in the back half of the year.

Exhibit 4: Muni After Tax Yield Pickup by Quality Cohort
Muni After Tax Yield Pickup by Quality Cohort
Source, Bloomberg, Western Asset. As of 30 Jun 25. 10- and 30-Year comparison reflects Bloomberg Valuation Service (BVAL) AAA Muni Curve and US On-/Off-the-Run Sovereign Curve. AA Muni reflects the Bloomberg AA Muni Bond Index. A Muni reflects the Bloomberg A Muni Bond Index. BBB Muni reflects the Bloomberg BBB Muni Bond Index. HY Muni reflects the Bloomberg High Yield Muni Bond Index. AA Corp reflects the Bloomberg AA Corporate Bond Index. A Corp reflects the Bloomberg A Corporate Bond Index. BBB Corp reflects the Bloomberg BBB Corporate Bond Index. After-tax yield considers top marginal tax rate of 40.8%. Indexes are unmanaged and one cannot directly invest in them. They do not include fees, expenses or sales charges. Past performance is not an indicator or a guarantee of future results.

Municipal Credit Curves and Relative Value

Exhibit 5: Muni Credit Curves
Muni Credit Curves
Source: Bloomberg, Western Asset. As of 27 Jun 25. Bloomberg Valuation Service (BVAL) Municipal Credit Indices (AAA, AA, A, BBB, respectively) and US Sovereign Curves. Taxable-Equivalent Muni Credit Curves consider the top marginal effective tax rate of 40.8%. AA Muni is represented by the US General Obligation AA Muni BVAL Yield Curve. The BVAL curve is populated with pricing from uninsured AA General Obligation bonds. A Muni is represented by the US General Obligation A Muni BVAL Yield Curve. The BVAL curve is populated with pricing from uninsured A General Obligation bonds. BBB Muni is represented by the US General Obligation BBB Muni BVAL Yield Curve. The BVAL curve is populated with pricing from uninsured BBB General Obligation bonds. Indices are unmanaged and one cannot directly invest in them. They do not include fees, expenses or sales charges. Past performance is not an indicator or a guarantee of future results. Select the image to expand the view.
Exhibit 6: Taxable-Equivalent Muni Credit Curves
Taxable-Equivalent Muni Credit Curves
Source: Bloomberg, Western Asset. As of 27 Jun 25. Bloomberg Valuation Service (BVAL) Municipal Credit Indices (AAA, AA, A, BBB, respectively) and US Sovereign Curves. Taxable-Equivalent Muni Credit Curves consider the top marginal effective tax rate of 40.8%. AA Muni is represented by the US General Obligation AA Muni BVAL Yield Curve. The BVAL curve is populated with pricing from uninsured AA General Obligation bonds. A Muni is represented by the US General Obligation A Muni BVAL Yield Curve. The BVAL curve is populated with pricing from uninsured A General Obligation bonds. BBB Muni is represented by the US General Obligation BBB Muni BVAL Yield Curve. The BVAL curve is populated with pricing from uninsured BBB General Obligation bonds. Indices are unmanaged and one cannot directly invest in them. They do not include fees, expenses or sales charges. Past performance is not an indicator or a guarantee of future results. Select the image to expand the view.
Exhibit 7: AAA Munis vs. Treasuries
AAA Munis vs. Treasuries
Source: Muni Yields: Thomson Reuters MMD, Treasury Yields: Bloomberg. As of 27 Jun 25. Past performance is not a guarantee of future results. It is not possible to invest directly in an index. Select the image to expand the view.
Exhibit 8: Tax-Exempt and Taxable Muni Valuations
Tax-Exempt and Taxable Muni Valuations
Source: Bloomberg, Western Asset. As of 27 Jun 25. Yield-to-worst (YTW) is the lowest potential yield that can be received on a bond without the issuer actually defaulting. AAA, AA, A, BBB Corporate Indices; After-Tax Yield assumes a top effective tax rate of 40.8%. Taxable Muni Index Corporate comparable used is the Global Corporate Aggregate (ex. BBB) to better align credit quality and duration. Select the image to expand the view.

Western Asset Key Themes for Muni Investors

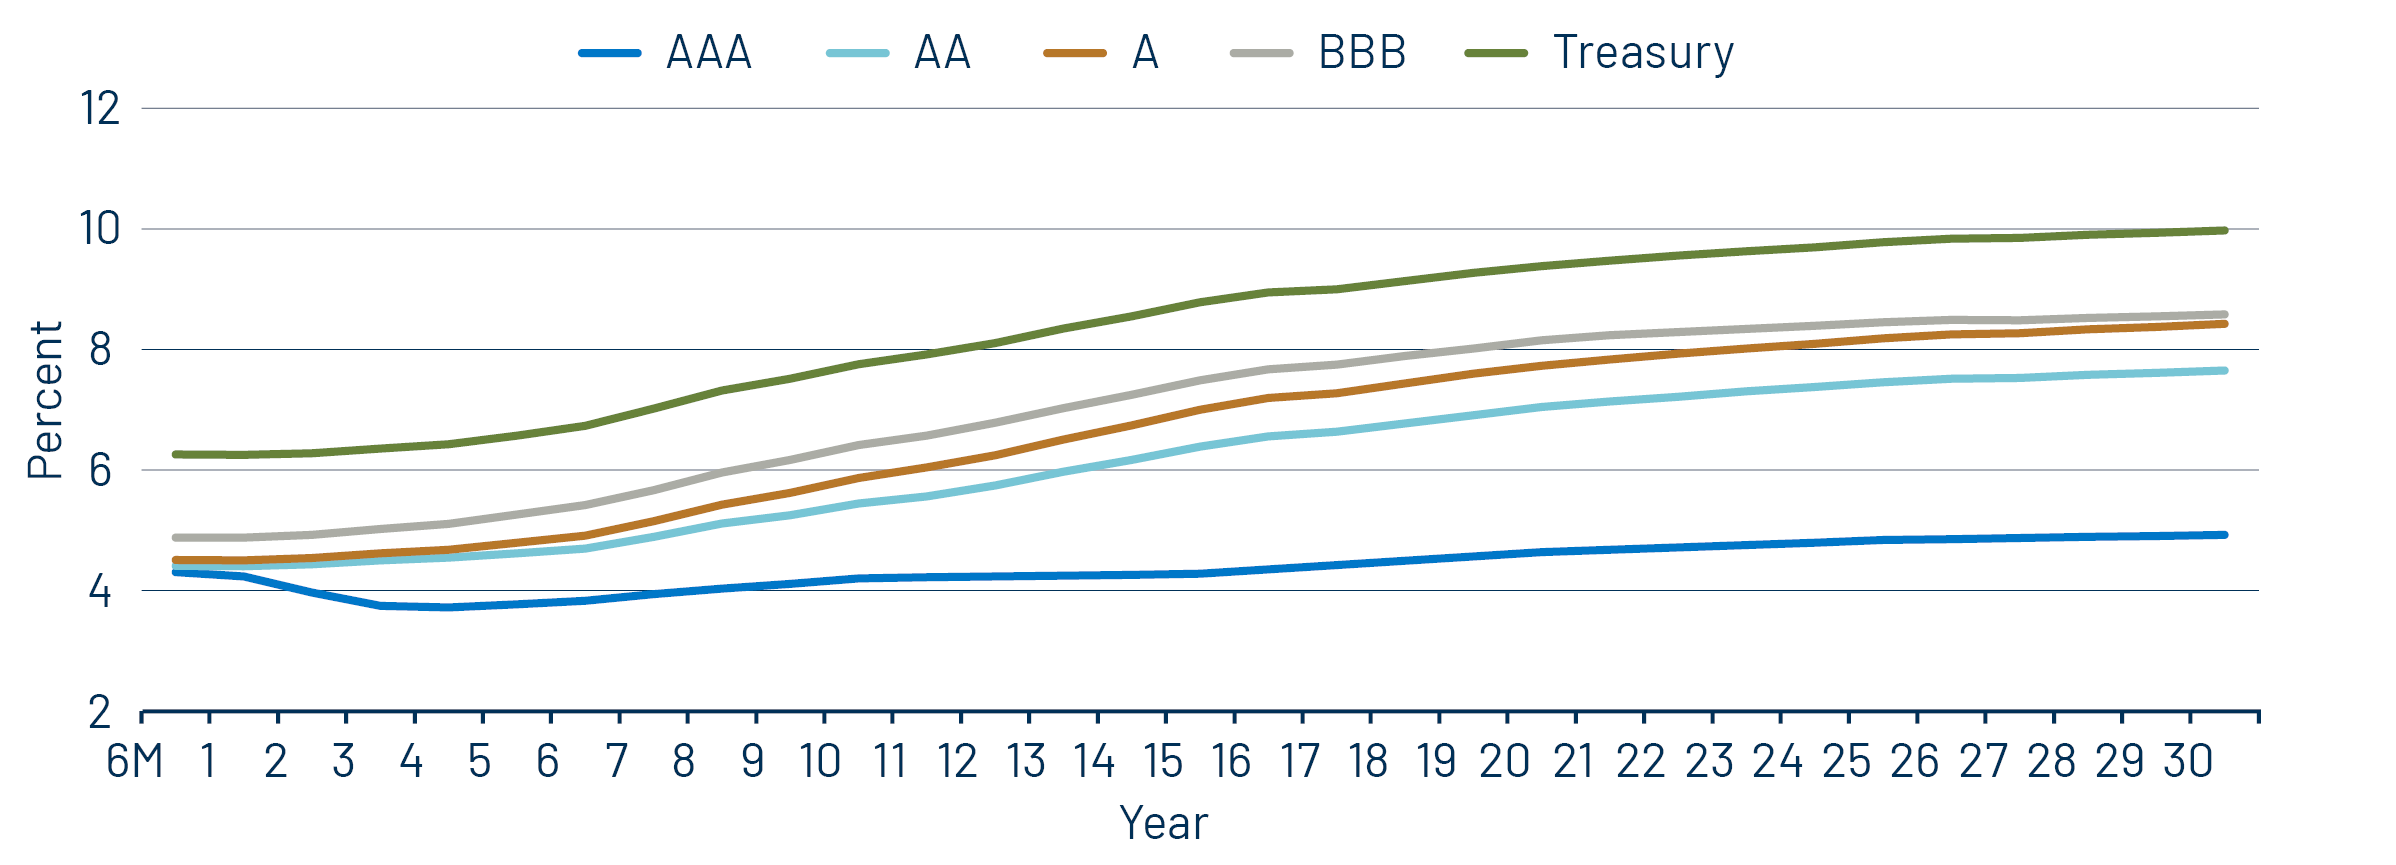
Theme #1: Municipal taxable-equivalent yields and income opportunities remain near decade-high levels.

Exhibit 9: Muni and Taxable-Equivalent Muni Yield-to-Worst
Muni and Taxable-Equivalent Muni Yield-to-Worst
Source: Bloomberg, Western Asset. As of 27 Jun 25. Bloomberg Municipal Bond Index yield considering highest marginal tax rate of 40.8%. Indexes are unmanaged and one cannot directly invest in them. They do not include fees, expenses or sales charges. Past performance is not an indicator or a guarantee of future results. Select the image to expand the view.

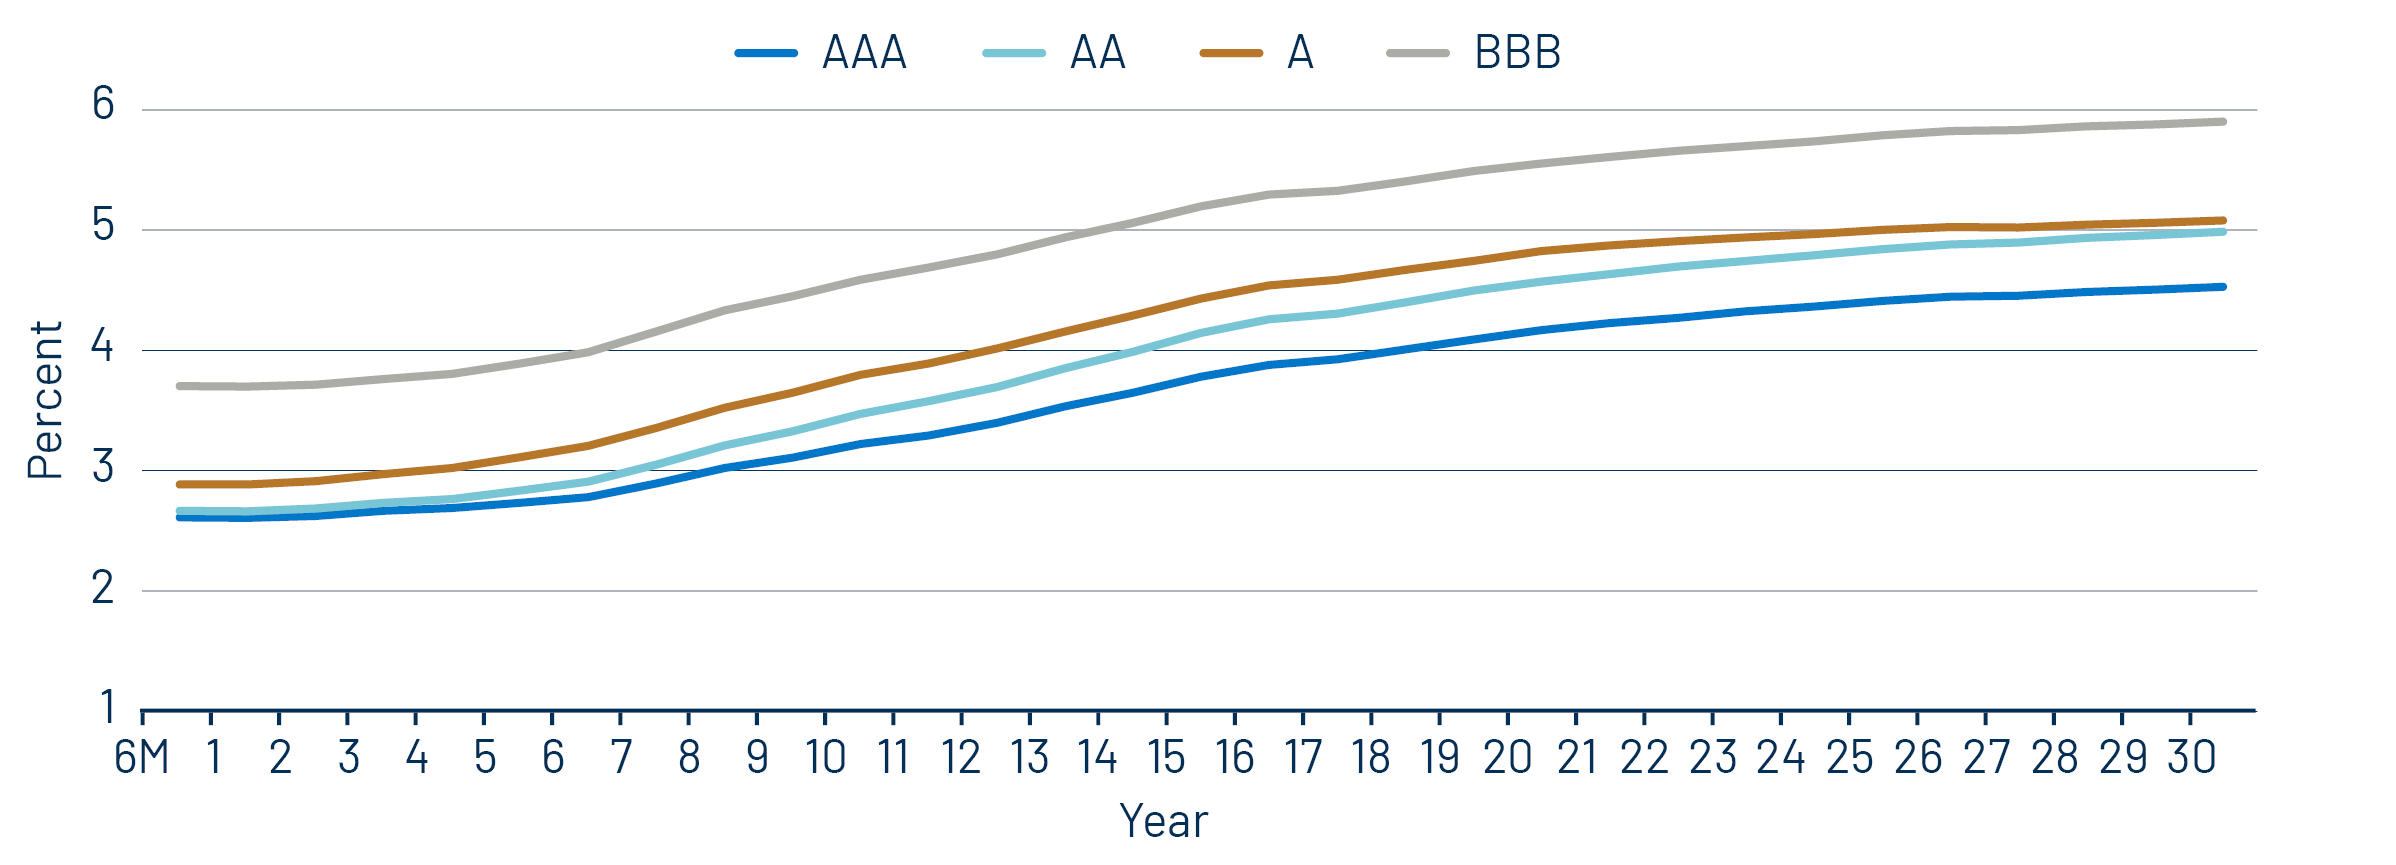
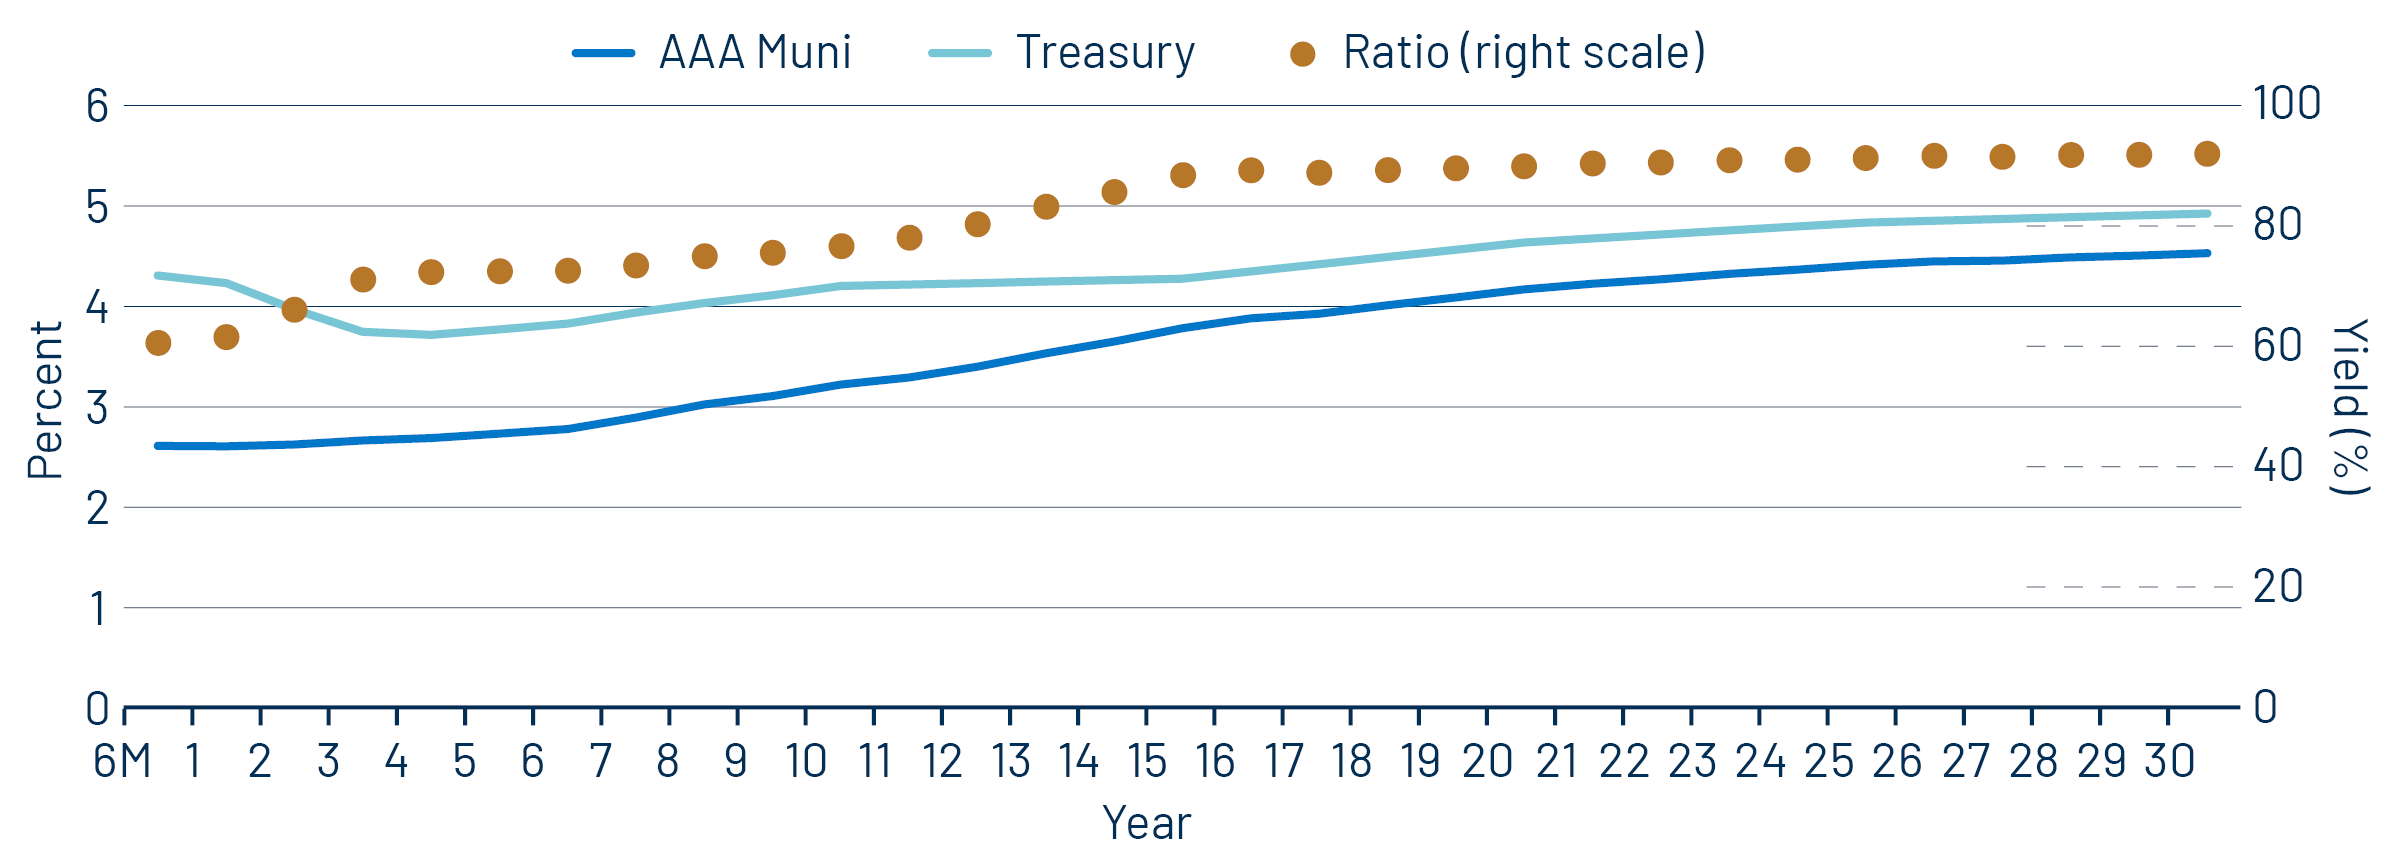
Theme #2: The AAA muni curve has steepened, offering better value in intermediate and longer maturities.

Exhibit 10: AAA Municipal vs. Treasury Yield Curves
AAA Municipal vs. Treasury Yield Curves
Source: Bloomberg, Western Asset. As of 27 Jun 25. Bloomberg Valuation Service (BVAL) AAA Muni Curve and US On-/Off-the-Run Sovereign Curve. Indexes are unmanaged and one cannot directly invest in them. They do not include fees, expenses or sales charges. Past performance is not an indicator or a guarantee of future results. Select the image to expand the view.

Theme #3: Munis offer attractive after-tax yield compared to taxable alternatives.

Exhibit 11: Municipal vs. Taxable Fixed-Income Yields by Quality
Municipal vs. Taxable Fixed-Income Yields by Quality
Source: Western Asset, Bloomberg. As 27 Jun 25. 10- and 30-Year comparison reflects Bloomberg Valuation Service (BVAL) AAA Muni Curve and US On-/Off-the-Run Sovereign Curve. AA Muni reflects the Bloomberg AA Muni Bond Index. A Muni reflects the Bloomberg A Muni Bond Index. BBB Muni reflects the Bloomberg BBB Muni Bond Index. HY Muni reflects the Bloomberg High Yield Muni Bond Index. AA Corp reflects the Bloomberg AA Corporate Bond Index. A Corp reflects the Bloomberg A Corporate Bond Index. BBB Corp reflects the Bloomberg BBB Corporate Bond Index. After-tax yield considers the top marginal tax rate of 40.8%. Indexes are unmanaged and one cannot directly invest in them. They do not include fees, expenses or sales charges. Past performance is not an indicator or a guarantee of future results. Select the image to expand the view.

投資一任契約および金融商品に係る投資顧問料(消費税を含む):
投資一任の場合は運用財産の額に対して、年率1.1%(税抜き1.0%)を上限とする運用手数料を、運用戦略ごとに定めて おります。 また、別途運用成果に応じてお支払いいただく手数料(成功報酬)を設定する場合があります。
その料率は、運用成果の評価方法や固定報酬率の設定方法により変動しますので、手数料の金額や計算方法をこの書 面に記載することはできません。

投資信託の場合は投資信託ごとに信託報酬が定められておりますので、目論見書または投資信託約款でご確認くださ い。有価証券の売買又はデリバティブ取引の売買手数料を運用財産の中からお支払い頂きます。投資信託に投資する 場合は信託報酬、管理報酬等の手数料が必要となります。これらの手数料には多様な料率が設定されているためこの 書面に記載することはできません。デリバティブ取引を利用する場合、運用財産から委託証拠金その他の保証金を預託 する場合がありますが、デリバティブ取引の額がそれらの額を上回る可能性があります。その額や計算方法はこの書面に 記載することはできません。投資一任契約に基づき運用財産の運用を行った結果、金利、通貨の価格、金融商品市場に おける相場その他の指標に係る変動により、損失が生ずるおそれがあります。損失の額が、運用財産から預託された委 託証拠金その他の保証金の額を上回る恐れがあります。個別交渉により、一部のお客様とより低い料率で投資一任契約 を締結する場合があります。

©Western Asset Management Company Ltd 2025. 本資料の著作権は、ウエスタン・アセット・マネジメント株式会 社およびその関連会社(以下「ウエスタン・アセット」という)に帰属するものであり、意図した受取人のみを対象として 作成されたものです。本資料に記載の内容は、秘密情報及び専有情報としてお取り扱いください。ウエスタン・アセット の書面による事前の承諾なしに、全部又は一部を無断で複写、複製することや転載することを堅くお断りいたします。

過去の運用実績は将来の運用実績を示すものではありません。また、本資料は、将来の実績を予測または予想するも のではありません。

本資料は、適格機関投資家、特定投資家、企業年金基金、公的年金等、豊富な投資経験と高度な専門知識とを備えたプ ロフェッショナルのお客様のみにご提供するものです


本資料は情報の提供のみを目的としています。資料作成時点のウエスタン・アセットの見解を掲載したものであり、将来 予告なしに変更する場合があります。また、リアルタイムの市場動向や運用に関する見解ではありません。

本資料で第三者のデータが使用されている場合、ウエスタン・アセットはそのデータが公表時点で正確であると信じてい ますが、それを保証するものではありません。ウエスタン・アセットの戦略・商品の受賞またはランキングが含まれている 場合、これらは独立した第三者または業界出版物により公平な定量・定性情報に基づき決定されたものです。ウエスタ ン・アセットは、これらの第三者の標準的な業界サービスを利用したり、出版物を購読したりする場合がありますが、それ らは、すべてのアセット・マネージャーが利用可能なものであり、ランキングや受賞に影響を与えるものではありません。

本資料に記載の戦略・商品には、元本の一部または全部の損失を含む大きなリスクが伴う場合があります。また、当該 戦略や商品に投資することは大きな変動を伴なう可能性があり、投資家にはそのようなリスクを受け入れる経済力およ び意思を持つことが求められます。

特段の注記がない限り、本資料に記載の戦略のパフォーマンスはコンポジットのデータです。コンポジットではないその他 のデータについては、当戦略の運用方針に最も近いと考えられる口座を、コンポジットの代表口座として掲載しています。 つまり、代表口座は運用結果により選択されるものではありません。代表口座のポートフォリオ特性は、コンポジットやそ の他のコンポジット構成口座と異なる場合があります。これらの口座についての情報はご依頼に応じてご提供いたします。

本資料に記載している内容は、ウエスタン・アセットの投資家に対する投資助言ではありません。個別銘柄・発行体に関 する一般的または具体的に言及する内容は、例としてご提示したものであり、購入または売却を推奨するものでもありま せん。また、ウエスタン・アセットの役職員及びお客様は、本資料に記載の有価証券を保有している可能性があります。

本資料は、会計、法務、税務、投資またはその他の助言の提供を意図したものではなく、またそれらに依存すべきでは ありません。お客様は、ウエスタン・アセットが提供する戦略・商品への投資を行うにあたり、経済的リスクやメリットな どについて助言が必要である場合は、ご自身の弁護士、会計士、投資家、税理士、その他のアドバイザーに相談して下さ い。お客様は、居住国で適用される法令を遵守する責任を負います。

ウエスタン・アセットは世界有数の運用専門会社です。1971年の設立以来、債券運用に特化したアクティブ運用機関として 最大規模の運用資産と運用チームを有しています。拠点は米国カリフォルニア州パサデナ、ニューヨーク、英国ロンドン、 シンガポール、東京、豪メルボルン、ブラジル・サンパウロ、香港、スイス・チューリッヒにあり、フランクリン・リソーシズInc の完全子会社ですが、経営全般に独立性を保っており、次の6法人で構成されています。米国:ウエスタン・アセット・マネ ジメント・カンパニーLLC(米証券取引委員会(SEC)登録の投資顧問会社)。ブラジル・サンパウロ:ウエスタン・アセット・マネジメント・カンパニーLtda.(ブラジル証券取引委員会が規制)。メルボルン:ウ エスタン・アセット・マネジメント・カンパニーPty Ltd(事業者番号ABN 41 117 767 923、AFSライセンス303160)。シンガ ポール:ウエスタン・アセット・マネジメント・カンパニーPte. Ltd(. CMSライセンスCo. Reg. No. 200007692R、シンガポール 通貨監督庁が監督)。日本:ウエスタン・アセット・マネジメント株式会社(金融商品取引業者、金融庁が規制)。英国:ウ エスタン・アセット・マネジメント・カンパニーLimited(英金融行動監視機構(FCA)が認可(FRN145930)、規制)。本資料 は英国ではFCAが定義する「プロフェッショナルな顧客」のみを対象とした宣伝目的に使用されます。許可された欧州経 済領域 (EEA)加盟国へ配信する場合もあります。最新の承認済みEEA加盟国のリストは、ウエスタン・アセット(電話:+44 (0)20 7422 3000)までお問い合わせください。詳細は当社ウエブサイトwww.westernasset.co .jpをご参照ください。
ウエスタン・アセット・マネジメント株式会社について
業務の種類: 金融商品取引業者(投資運用業、投資助言・代理業、第二種金融商品取引業)
登録番号: 関東財務局長(金商)第427号
加入協会: 一般社団法人日本投資顧問業協会(会員番号 011-01319)
一般社団法人投資信託協会