Municipals Posted Negative Returns
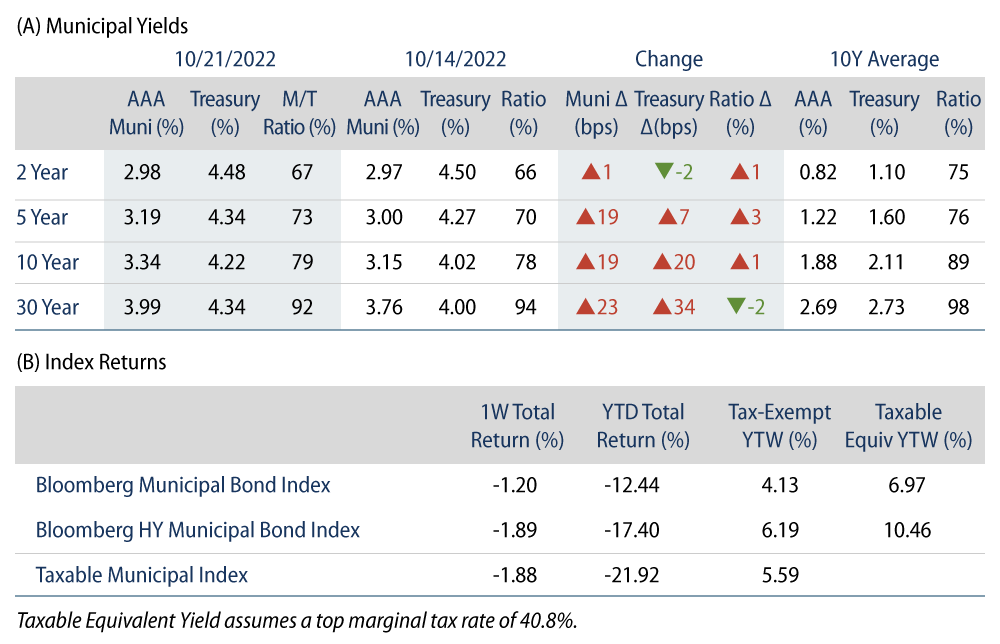
Municipals posted negative returns last week as yields moved higher across maturities. The high-grade municipal yield curve steepened, moving 1-23 bps higher across the curve. Municipals generally moved in sympathy with the Treasury curve, and changes to ratios remained range-bound (-2% to +1%). Meanwhile, technicals weakened amid increasing outflows and new-issue volume. The Bloomberg Municipal Index returned -1.20% while the HY Muni Index returned -1.89%. This week we highlight the value of looking beyond sector trends in volatile market conditions.
Technicals Weakened Amid Increasing Outflows and New Issuance
Fund Flows: During the week ending October 19, weekly reporting municipal mutual funds recorded $2.6 billion of net outflows, according to Lipper. Long-term funds recorded $1.5 billion of outflows, high-yield funds recorded $682 million of outflows, and intermediate funds recorded $246 million of outflows. The week’s outflows mark the 11th consecutive week of outflows and extend year-to-date (YTD) outflows to $103 billion.
Supply: The muni market recorded $10.5 billion of new-issue volume last week, up approximately 4x from the prior week. Total YTD issuance of $312 billion remains 15% lower than last year’s levels, with tax-exempt issuance trending 4% lower year-over-year (YoY) and taxable issuance trending 50% lower YoY. This week’s new-issue calendar is expected to decline to $6 billion. Larger deals include $950 million New York City Transitional Finance Authority and $690 million Triborough Bridge and Tunnel Authority transactions.
This Week in Munis: Parsing Value Amid Volatility
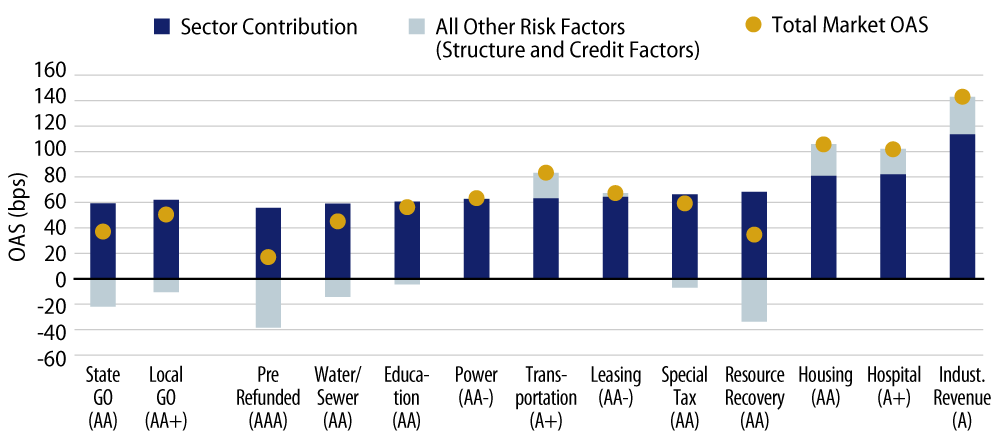
While known as a relatively high-quality asset class, municipal bond price changes are subject to a variety of risk factors, ranging from the structural factors such as duration, curve and callability to credit-oriented factors of credit rating, sector and issuer considerations. Management around these credit-oriented factors are often framed around credit rating and sector preferences. While some investors may consider sector tilts to avoid or lean into certain opportunities, recent data suggests that differences in municipal option-adjusted spreads (OAS) are currently more linked to underlying credit quality factors rather than spread factors.
The distribution of municipal credit quality varies widely between sectors. As highlighted in Exhibit 1, the average rating of any given sector ranges from A to AA+, which can have important spread implications:
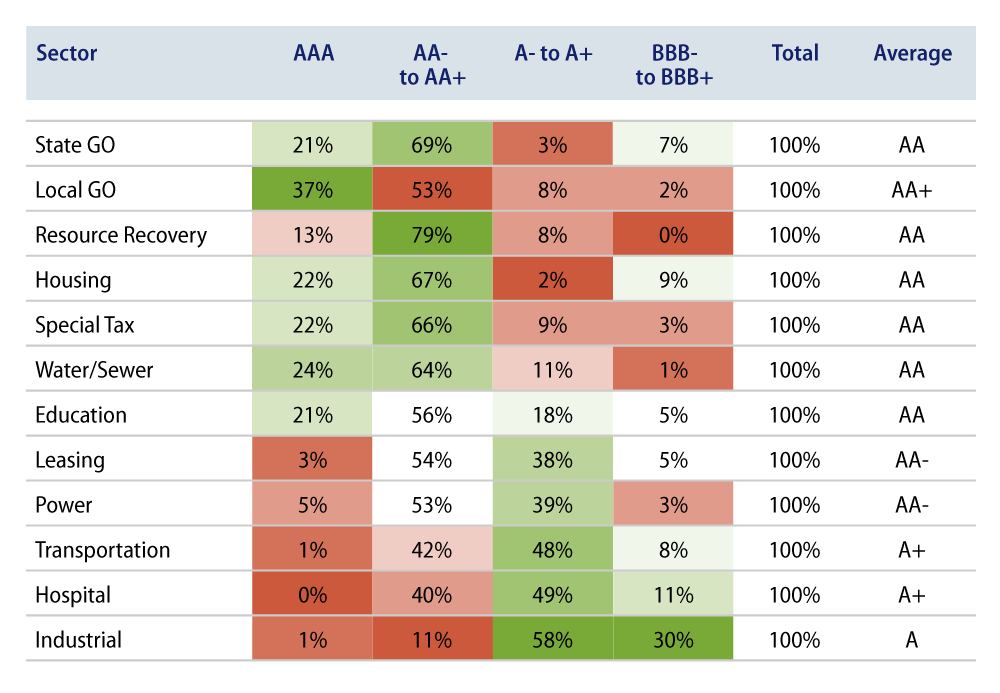
Because of the divergence in ratings among sectors, when assessing risk-adjusted relative value offered by any individual municipal sector, it is important to simultaneously quantify the other risk factors that might be contributing to a municipal bond price/yield for an appropriate apples-to-apples comparison. For example, the difference between the average spread of the A+ rated Transportation sector and the AA Water/Sewer sector is 39 bps. However, after removing the effects of duration, convexity, coupon and credit rating to isolate just the sector impact, the difference in spread is just 5 bps. This indicates that the market’s perception of the magnitude of risk due solely to the difference between Transportation and Water/Sewer sectors is much smaller than what is indicated by the average sector spreads.
Western Asset believes that isolating how investors can be compensated for the variety of risk factors that exist in the municipal market can lead to better risk-adjusted outcomes, particularly in volatile market conditions. In the current environment where sector-level relative valuations can be less apparent, individual security selection and independent credit risk assessment can be paramount.