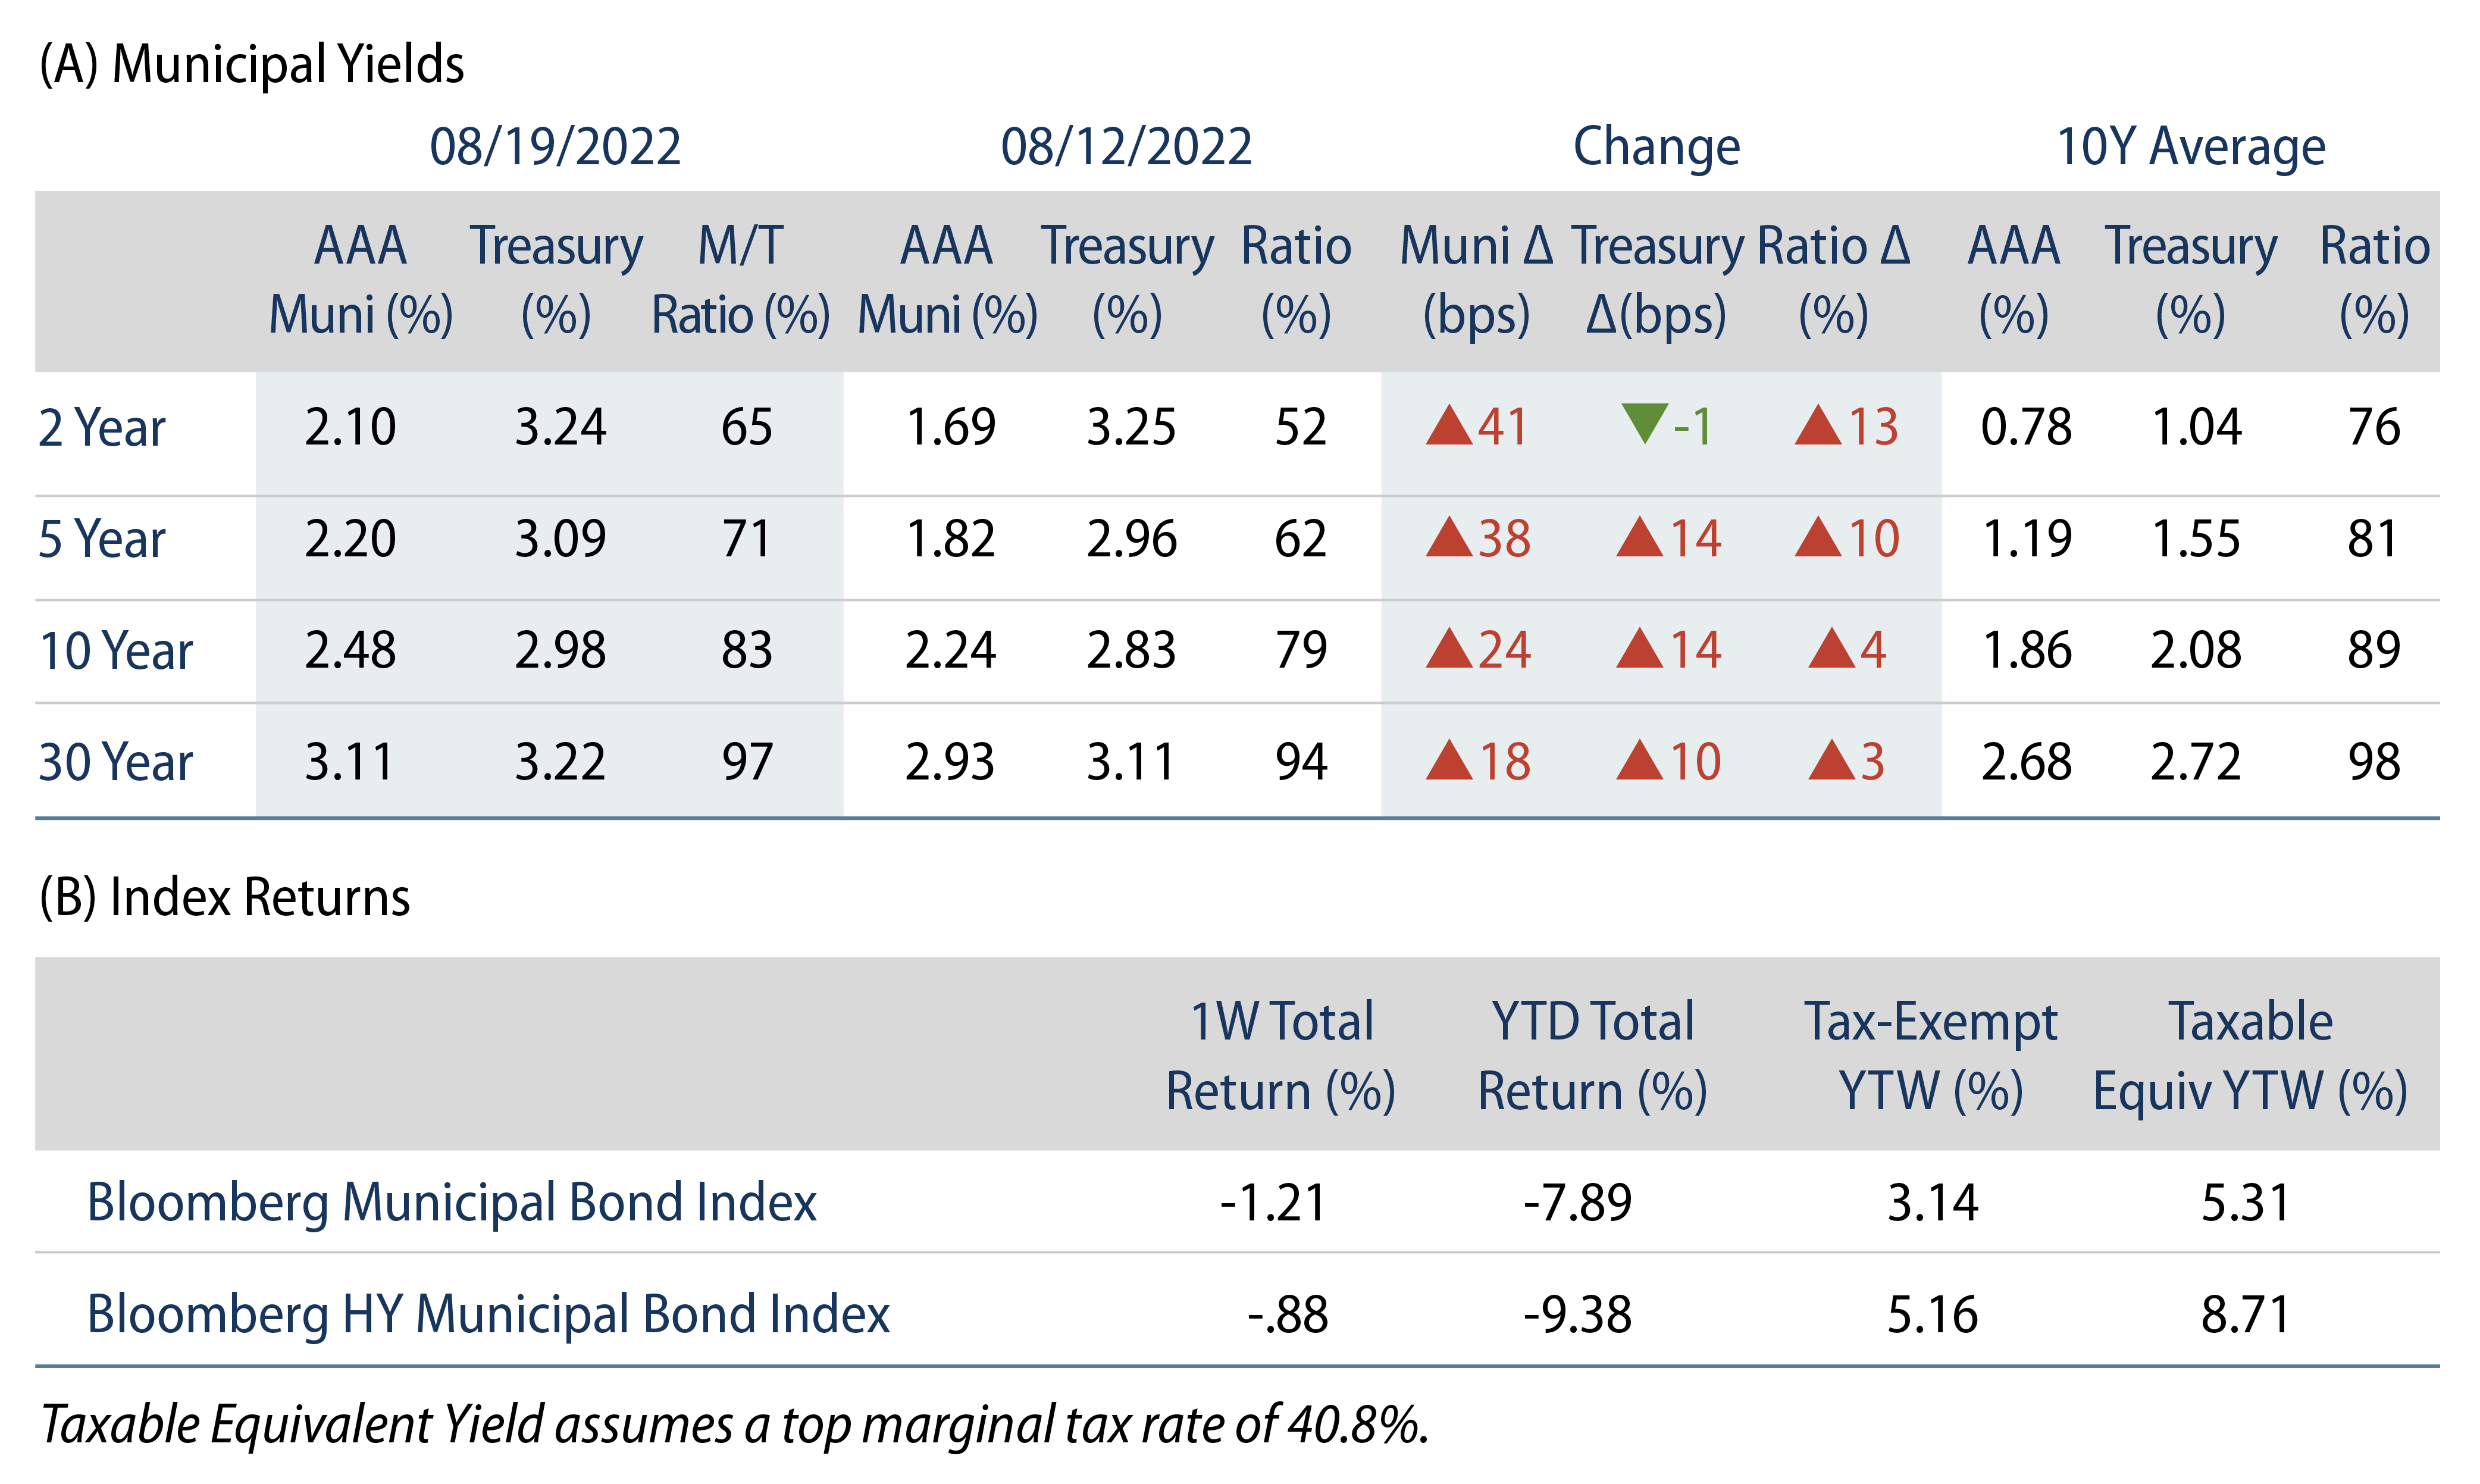
Municipals Posted Negative Returns
Municipals posted negative returns and underperformed Treasuries during a week of elevated rate volatility. High-grade municipal yields moved 18 to 41 bps higher across the curve. Municipal technicals remained weak amid fund outflows and higher supply. The Bloomberg Municipal Index returned -1.21% while the HY Muni Index returned -0.88%. This week we highlight signs of potentially peaking municipal credit quality.
Technicals Weaken Amid Fund Outflows and Higher Supply
Fund Flows: During the week ending August 17, weekly reporting municipal mutual funds recorded $229 million of net outflows, according to Lipper. Long-term funds recorded $46 million of outflows, high yield funds recorded $259 million of inflows and intermediate funds recorded $97 million of inflows. The week’s outflows extend year-to-date (YTD) outflows to $80 billion.
Supply: The muni market recorded $12 billion of new-issue volume, up 74% from the prior week. Total YTD issuance of $256 billion is 8% lower than last year’s levels, with tax-exempt issuance trending 2% higher year-over-year (YoY) and taxable issuance trending 40% lower YoY. This week’s new-issue calendar is expected to fall to $8 billion. Large deals include $980 million NYC Transitional Finance Authority and $955 million Triborough Bridge and Tunnel Authority (Bond Anticipation Notes) transactions.
This Week in Munis: Potentially Peaking Muni Credit Quality
In recent weeks we highlighted how unprecedented federal stimulus combined with the ongoing pandemic recovery has contributed to record tax collections and cash balances. These trends have underpinned credit improvement for the vast majority of the municipal market.
From 1Q21 to 2Q22, Moody’s and Standard & Poor’s have upgraded 1,150 issuers and downgraded just 473 issuers, resulting in a 2.4x upgrade/downgrade ratio. Moreover, in the current calendar year, Bloomberg estimates that over $390 billion of municipal debt has been upgraded by Moody’s, S&P or Fitch, while less than $42 billion was downgraded, resulting in a 9.4x upgrade/downgrade ratio by debt outstanding.
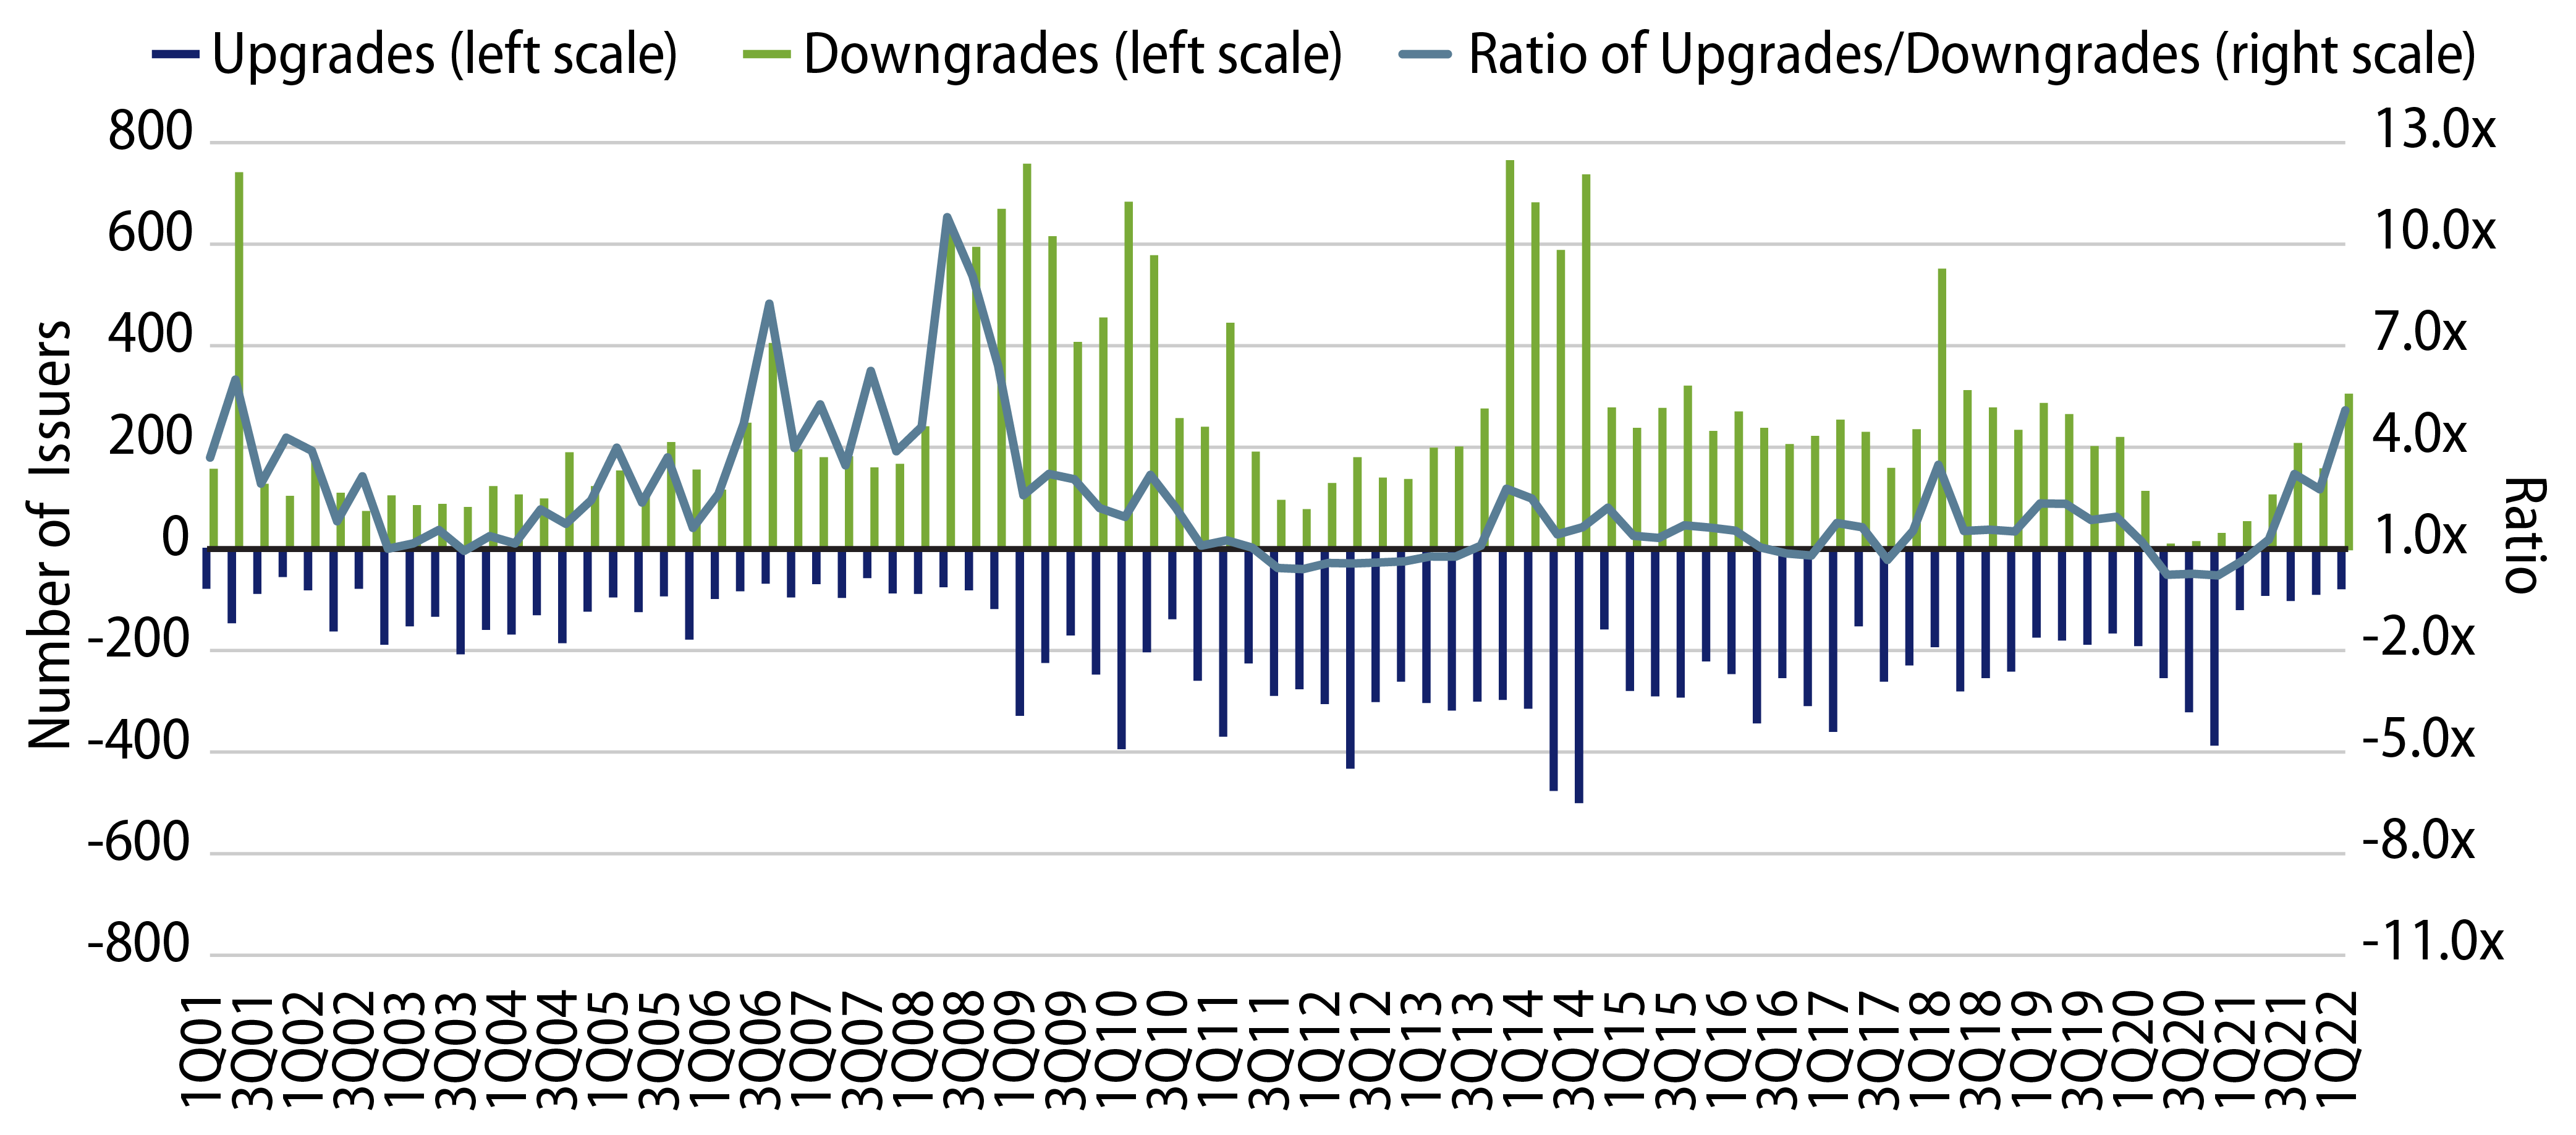
With the effects of robust pandemic-driven stimulus behind us, along with macroeconomic pressures of elevated inflation, rising interest rates and slowing economic growth, we anticipate state and local revenues could slow or decline. Moreover, heightened labor and procurement costs and challenged pension performance could drive up cost pressures that would further challenge municipal budgets.
This inflection point is perhaps best exemplified by the State of New York, already facing a new reality. In fiscal year (FY) 2021 and FY2022 the state recorded general fund surpluses of $9 billion and $11 billion, respectively. These surpluses are now being replaced by budget gaps totaling $13.7 billion over the next five years (FY2023 to FY2027), attributable to an anticipated decline in tax receipts.
Western Asset anticipates that as slowing revenues and increasing expenditures work their way into financial statements, public rating agencies will take notice and the upgrade/downgrade ratio could likely decline. A forward-looking, independent assessment of municipal credit quality—top-down macro inputs that inform bottom-up credit selection—is just one of several inputs an active manager can utilize to navigate volatile market conditions.