Investment-Grade Munis Posted Positive Returns Last Week
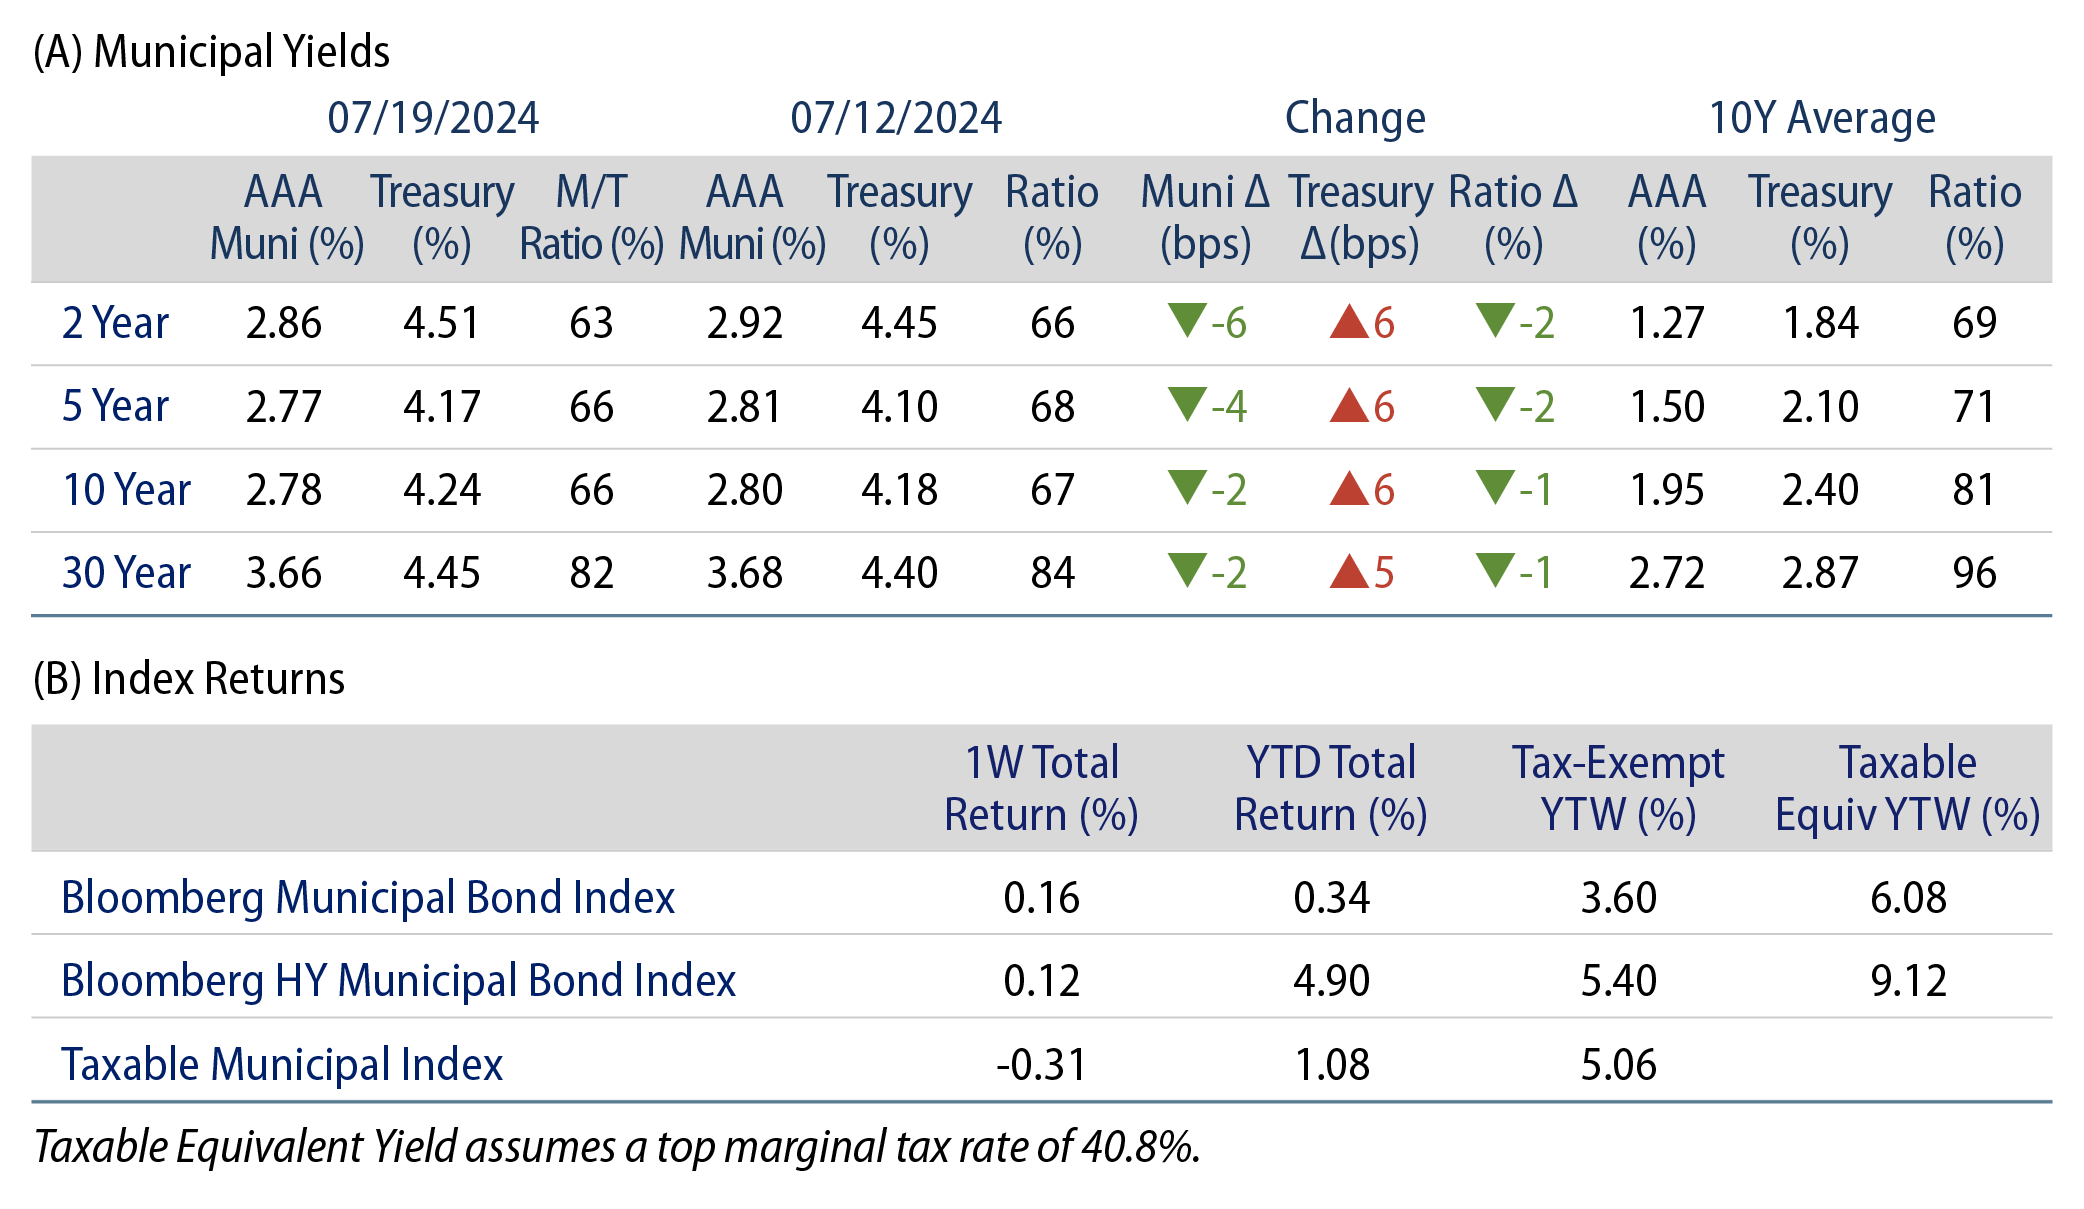
Investment-grade munis posted positive returns during the week as high-grade muni yields moved lower across the curve, despite Treasury yields moving higher on stronger-than-anticipated retail sales data. Meanwhile, both muni supply and demand moved higher. The Bloomberg Municipal Index returned 0.53% during the week, the High Yield Muni Index returned 0.12% and the Taxable Muni Index returned -0.31%. This week we highlight pension funding improvements.
Muni Supply and Demand Both Picked Back Up After the Holiday Week
Fund Flows (up $892 million): During the week ending July 17, weekly reporting municipal mutual funds recorded $892 million of net inflows, according to Lipper. Long-term funds recorded $788 million of inflows, high-yield funds recorded $364 million of inflows and intermediate funds recorded $80 million of inflows. This week’s inflows led estimated year-to-date (YTD) net inflows higher to $13.3 billion.
Supply (YTD supply of $262 billion, up 43% YoY): The muni market recorded $12 billion of new-issue volume last week, up 29% from the prior week. YTD issuance of $262 billion is 43% higher than last year’s level, with tax-exempt issuance 47% higher and taxable issuance 9% higher year-over-year (YoY). This week’s calendar is expected to remain elevated at $12 billion. The largest deals include $1.1 billion Texas Transportation Commission and $900 million South Carolina Public Service Authority transactions.
This Week in Munis: Public Pension Progress
In the years following the global financial crisis (GFC), negative equity returns and lower pension contributions (due to budget deficits) contributed to growing net pension liabilities and heightened credit concerns for many municipalities. Public pension data highlights that average state and local pension funding ratios declined from 85% to 73% from 2007 to 2009, and net pension liabilities nearly doubled from $1.6 trillion to $2.6 trillion over the period, according to Federal Reserve (Fed) data.
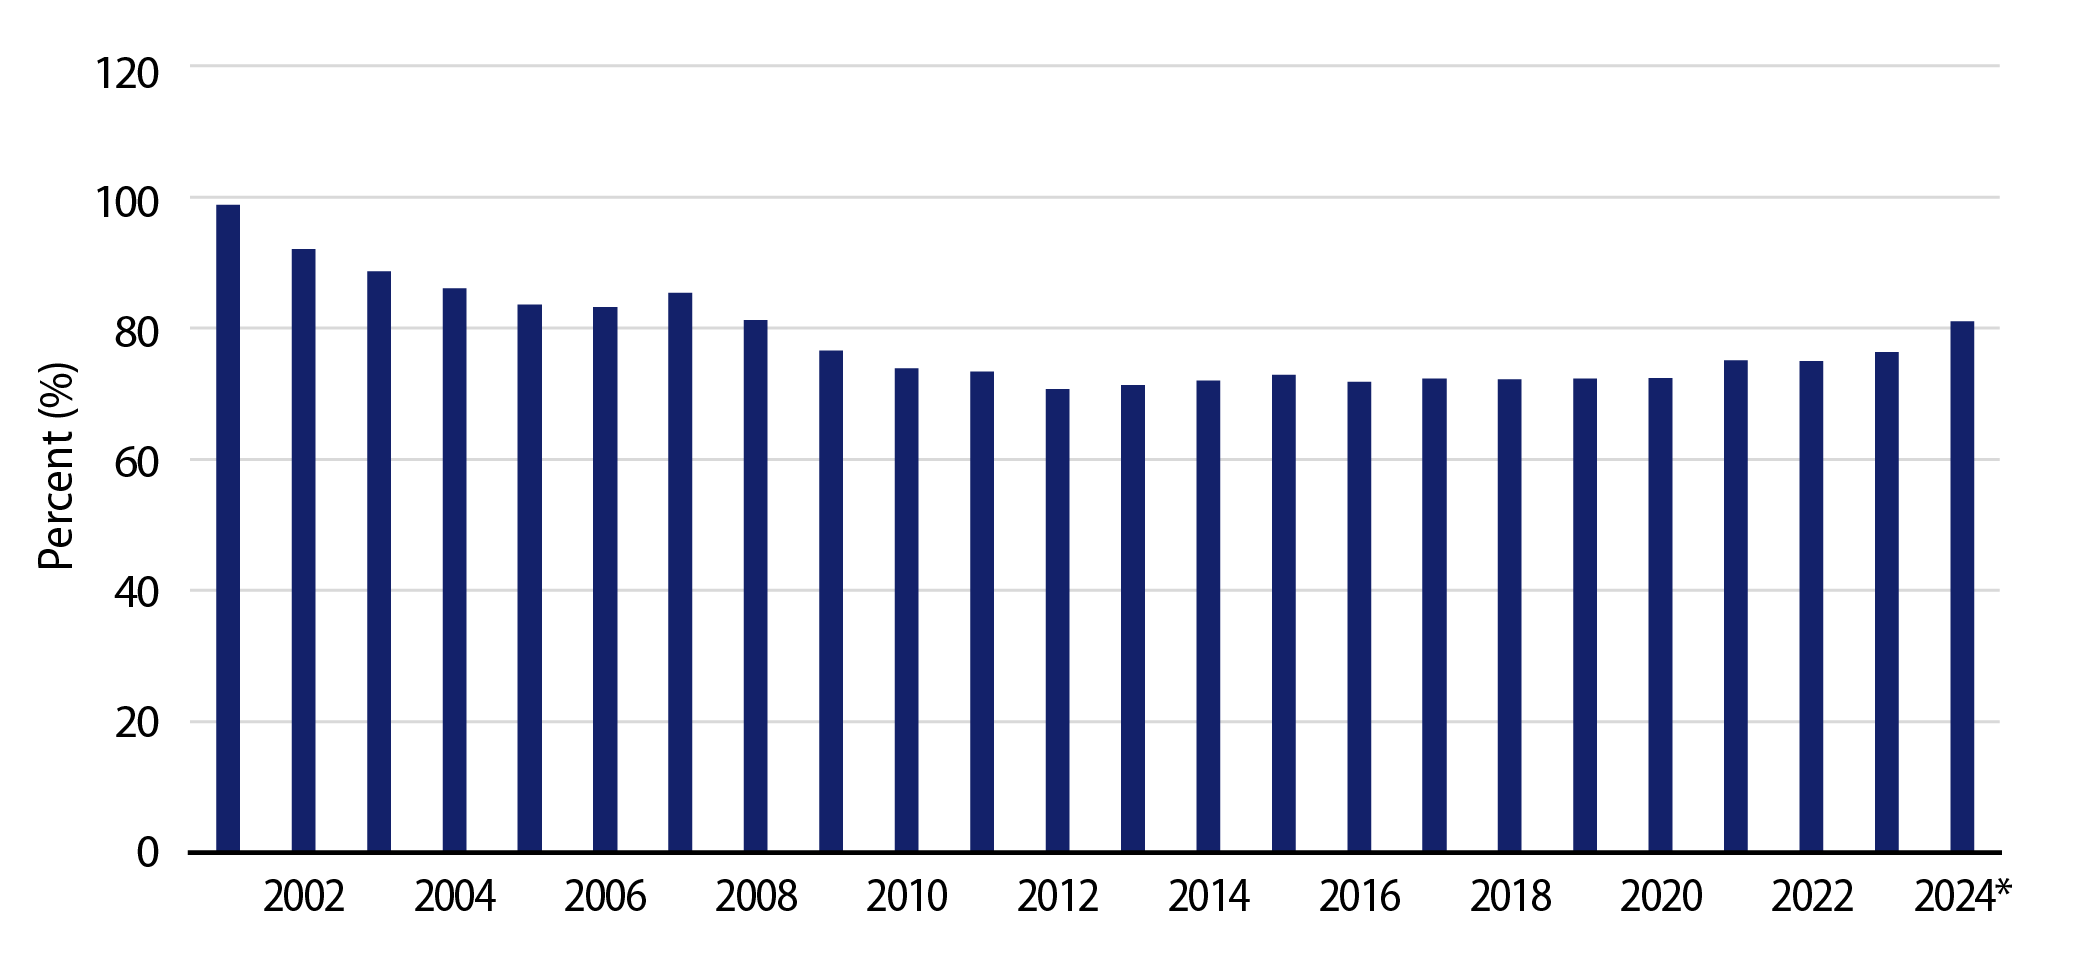
In the decade following the GFC, most state and local plans cut benefits or raised contributions to address elevated pension liabilities. Reforms also included lowering assumed rates of return and adopting more conservative actuarial assumptions to more realistically measure pension liabilities, considering the potential for lower market returns. These more conservative frameworks contributed to even higher net pension liabilities, which increased from $2.6 trillion in 2009 to as high as $4.7 trillion in March 2020, according to Fed data.
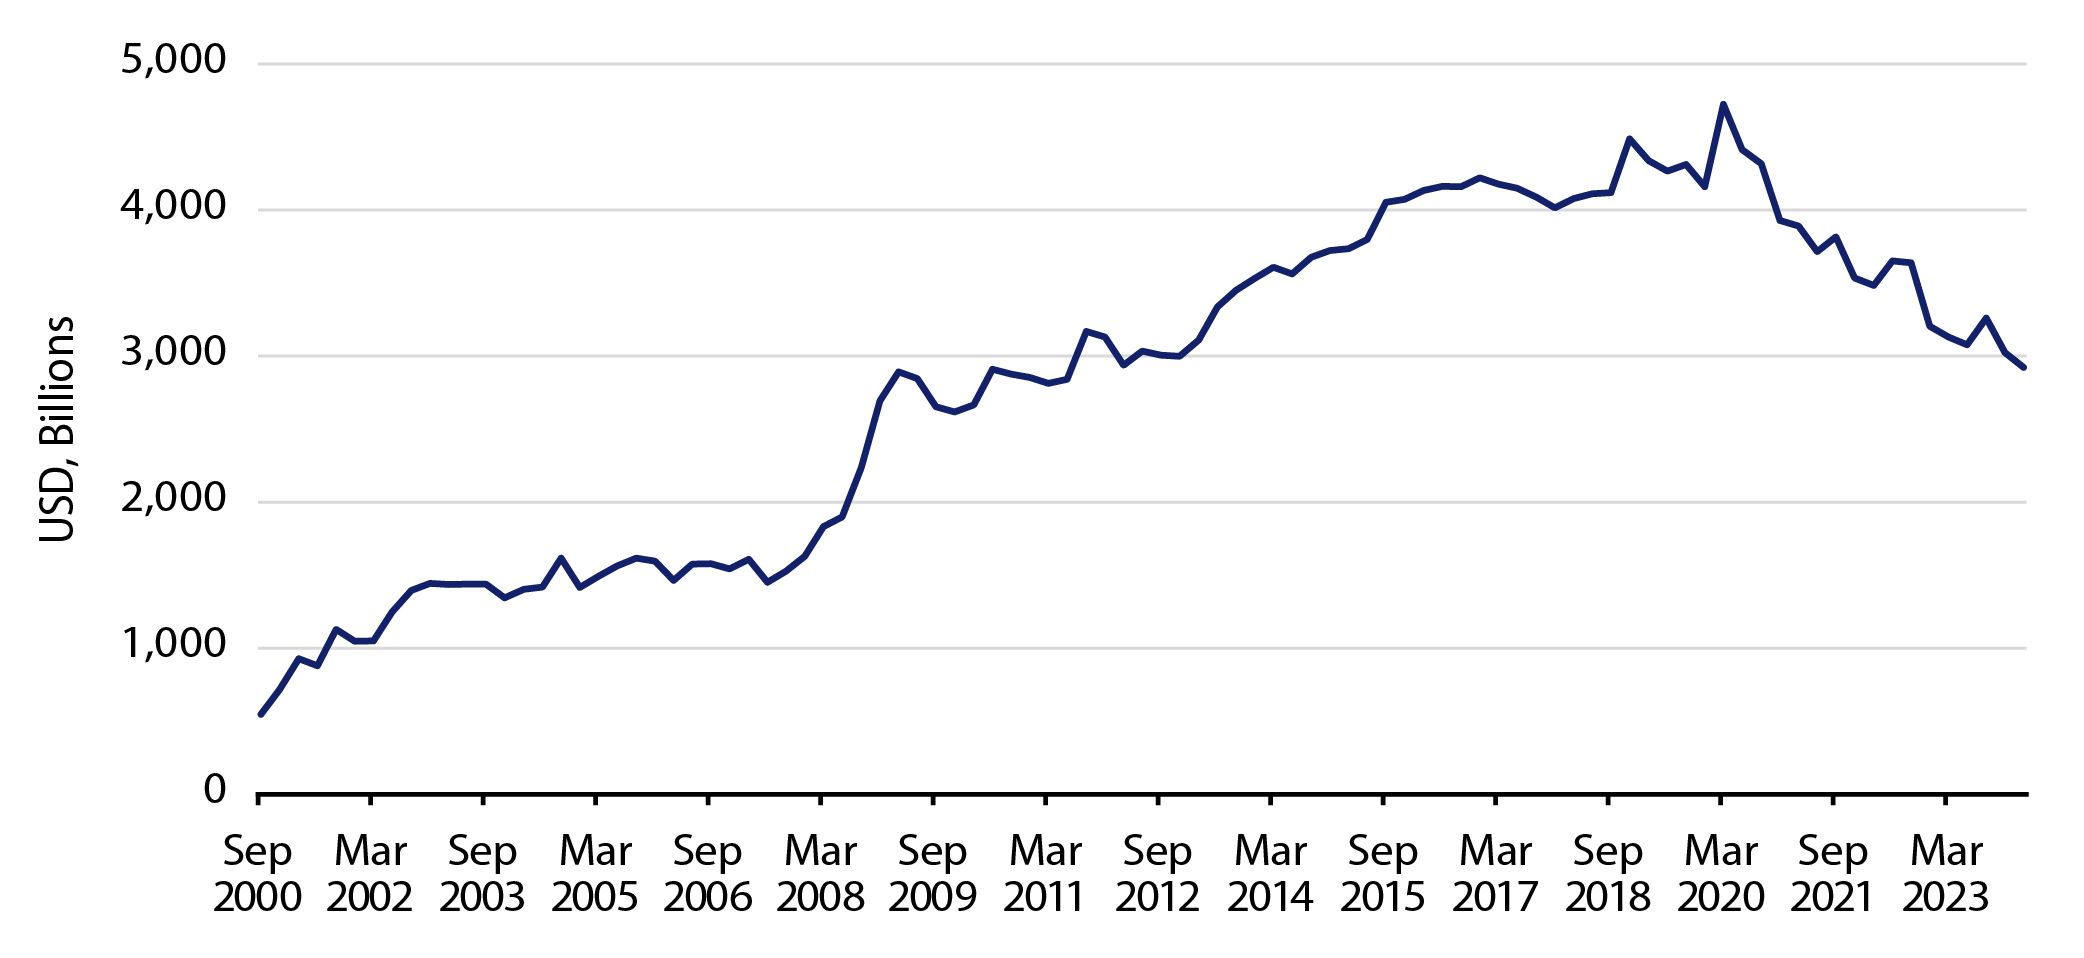
While higher pension liabilities have contributed to the overall debt burden of municipalities, reforms have resulted in higher pension contributions to address these liabilities, which have more recently contributed to lower pension burdens. Data from the Equable Institute reports that municipalities recorded record-high pension contribution rates of 31% of payroll in 2023, which in conjunction with positive market returns, improved the funded status of public pension systems. From March 2020 to March 2024, net pension liabilities declined by 38% to $2.9 trillion, according to Fed data, and estimated funding ratios increased, on average, to 81%, according to Equable estimates.
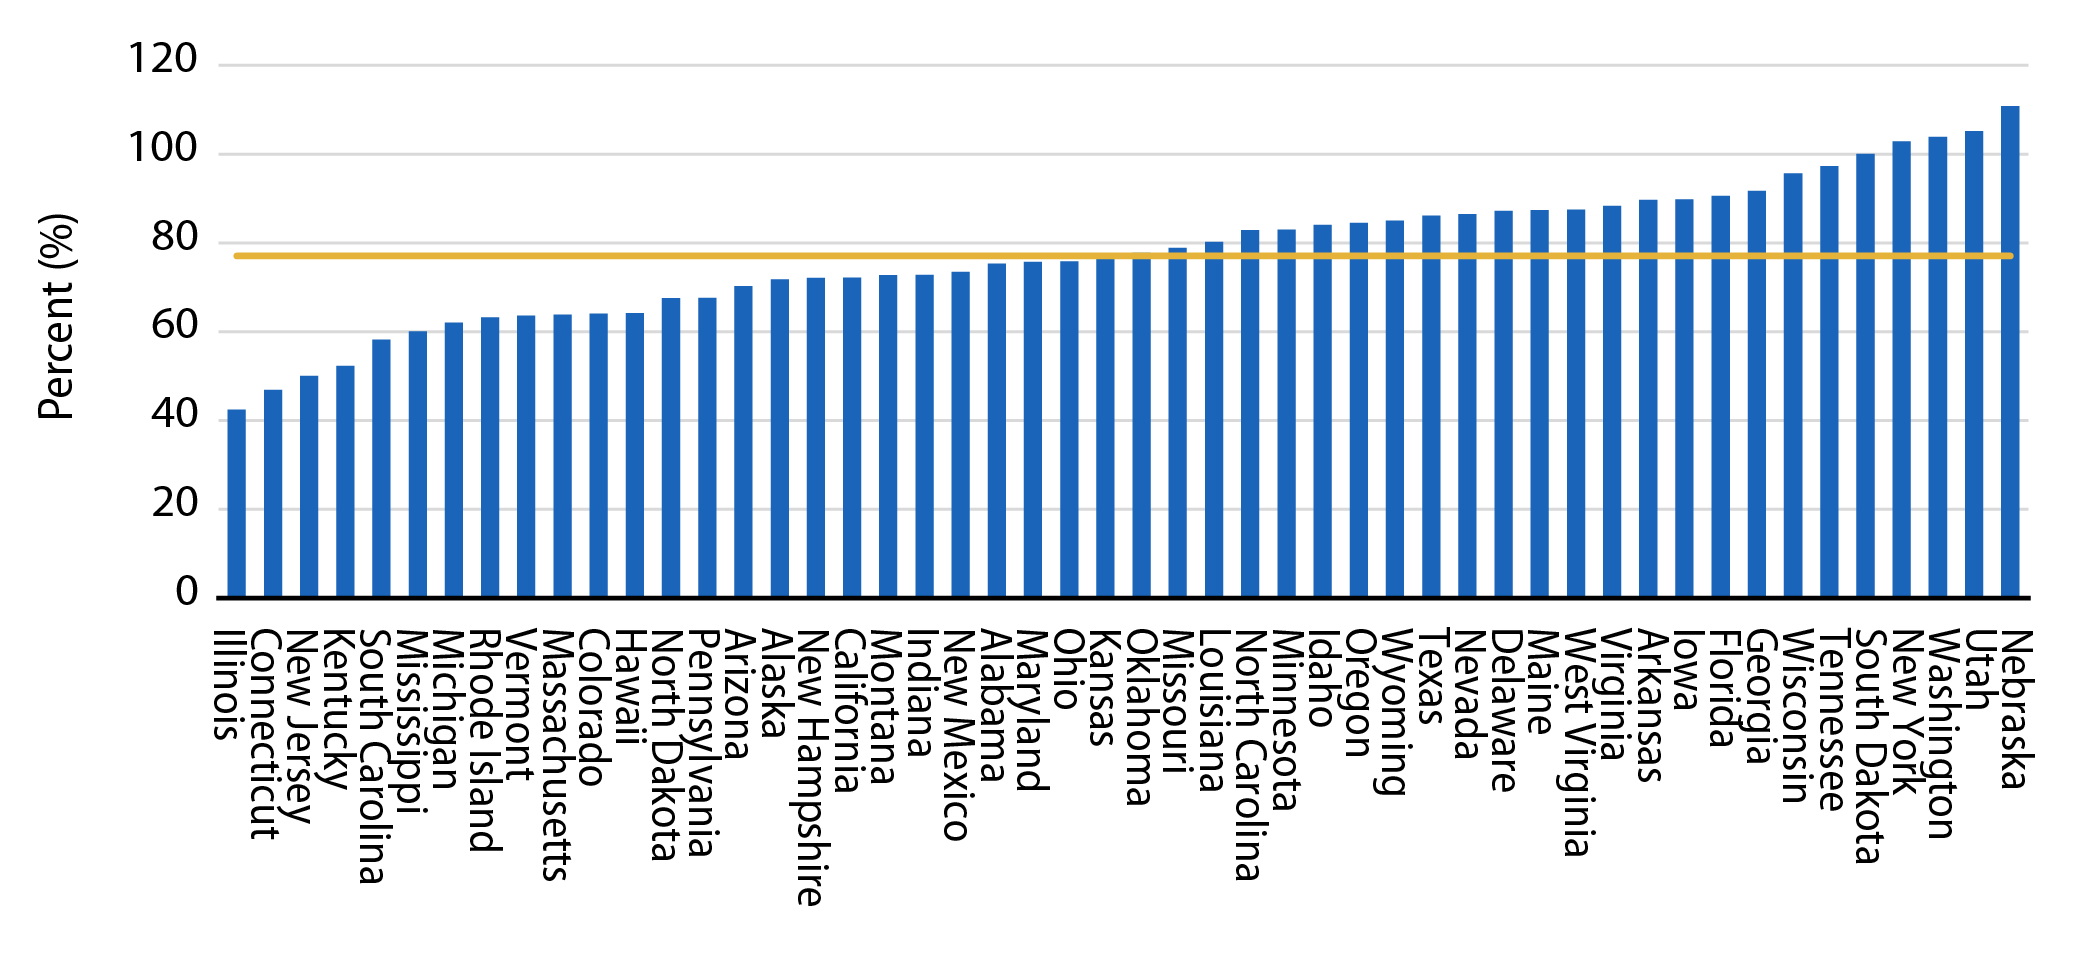
Notably, when considering states pension health, not all systems are equal. According to the most recent pension status reported by Bloomberg, the funded ratios for Illinois, Connecticut and New Jersey remain at or below 50%, underscoring the continued challenges many systems face. For these entities, we anticipate that a larger portion of budgets will be dedicated to pension contributions to meet promised liabilities. While these elevated costs may signal concern at face value, Western Asset believes municipalities are in a better place to navigate pension issues. Since the GFC, municipalities observed significant revenue growth, and relatively unchanged bonded debt. The improved fiscal position provides greater flexibility for municipalities to manage these higher fixed costs, which we expect would lead to lower liabilities over longer-term periods.
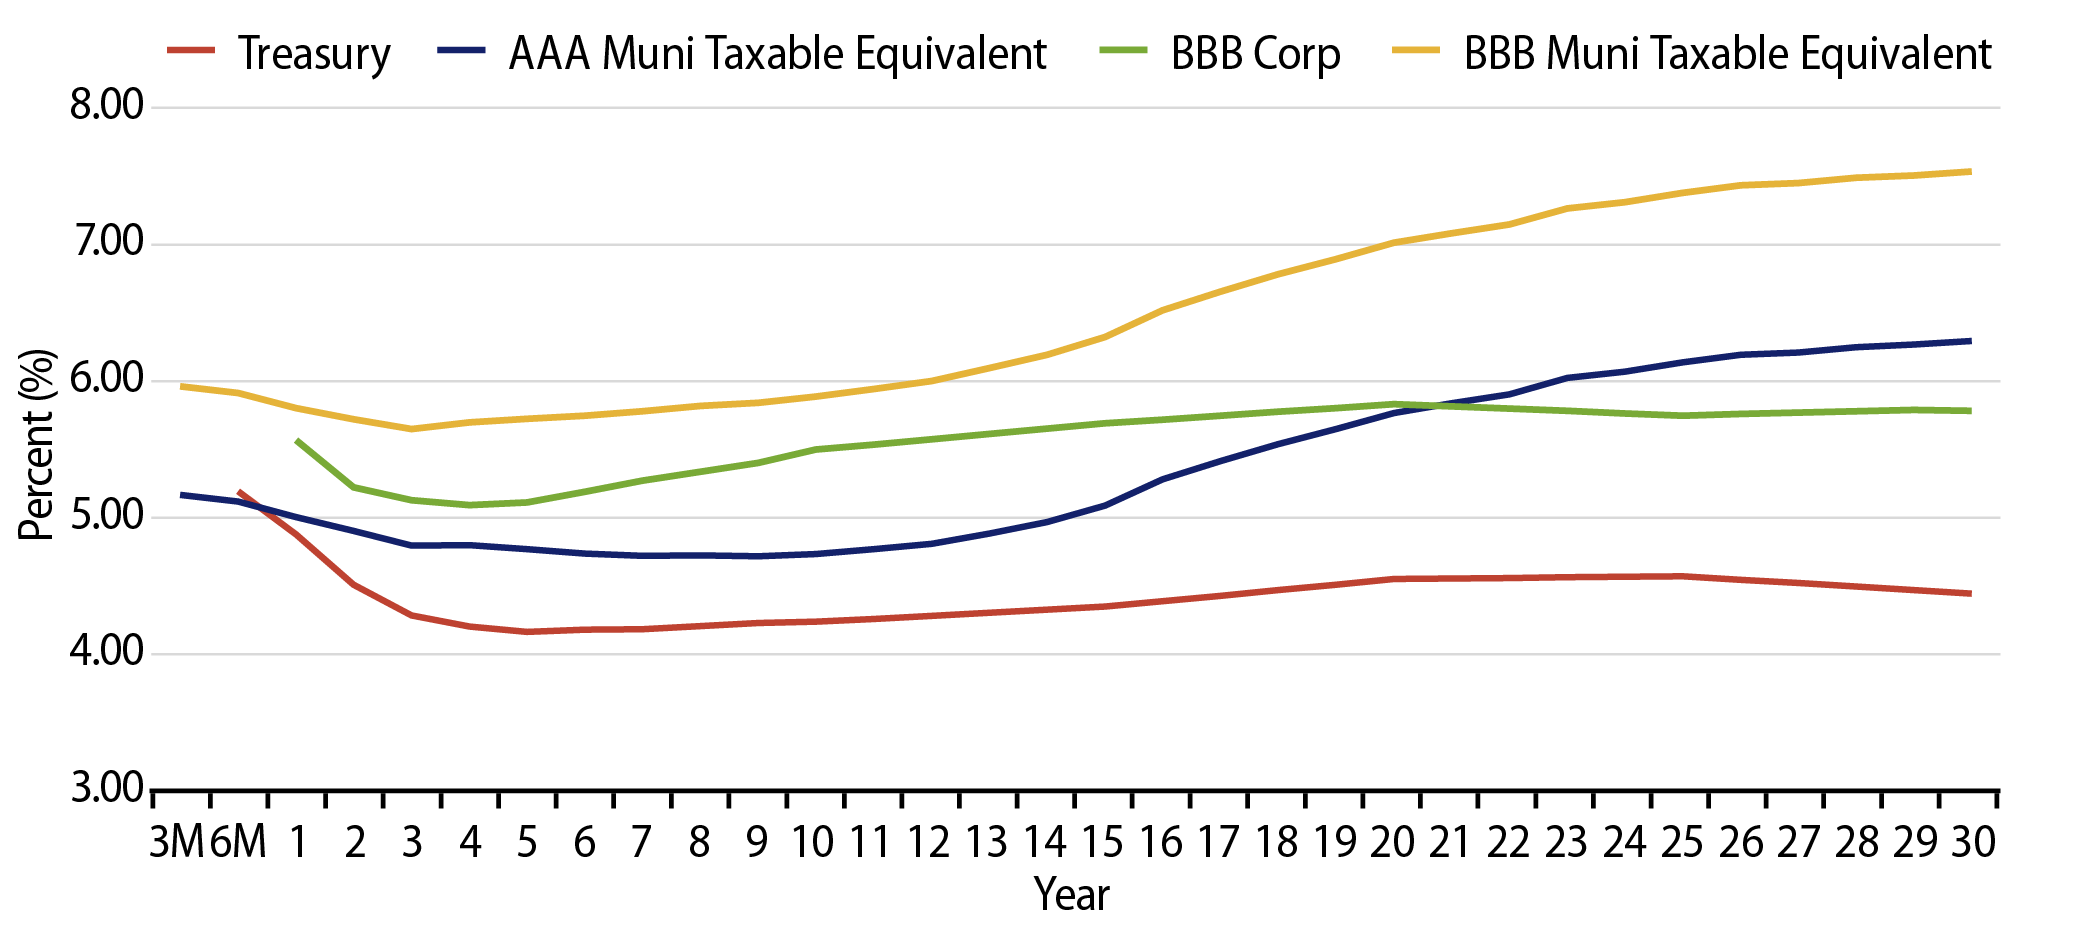
Municipal Credit Curves and Relative Value
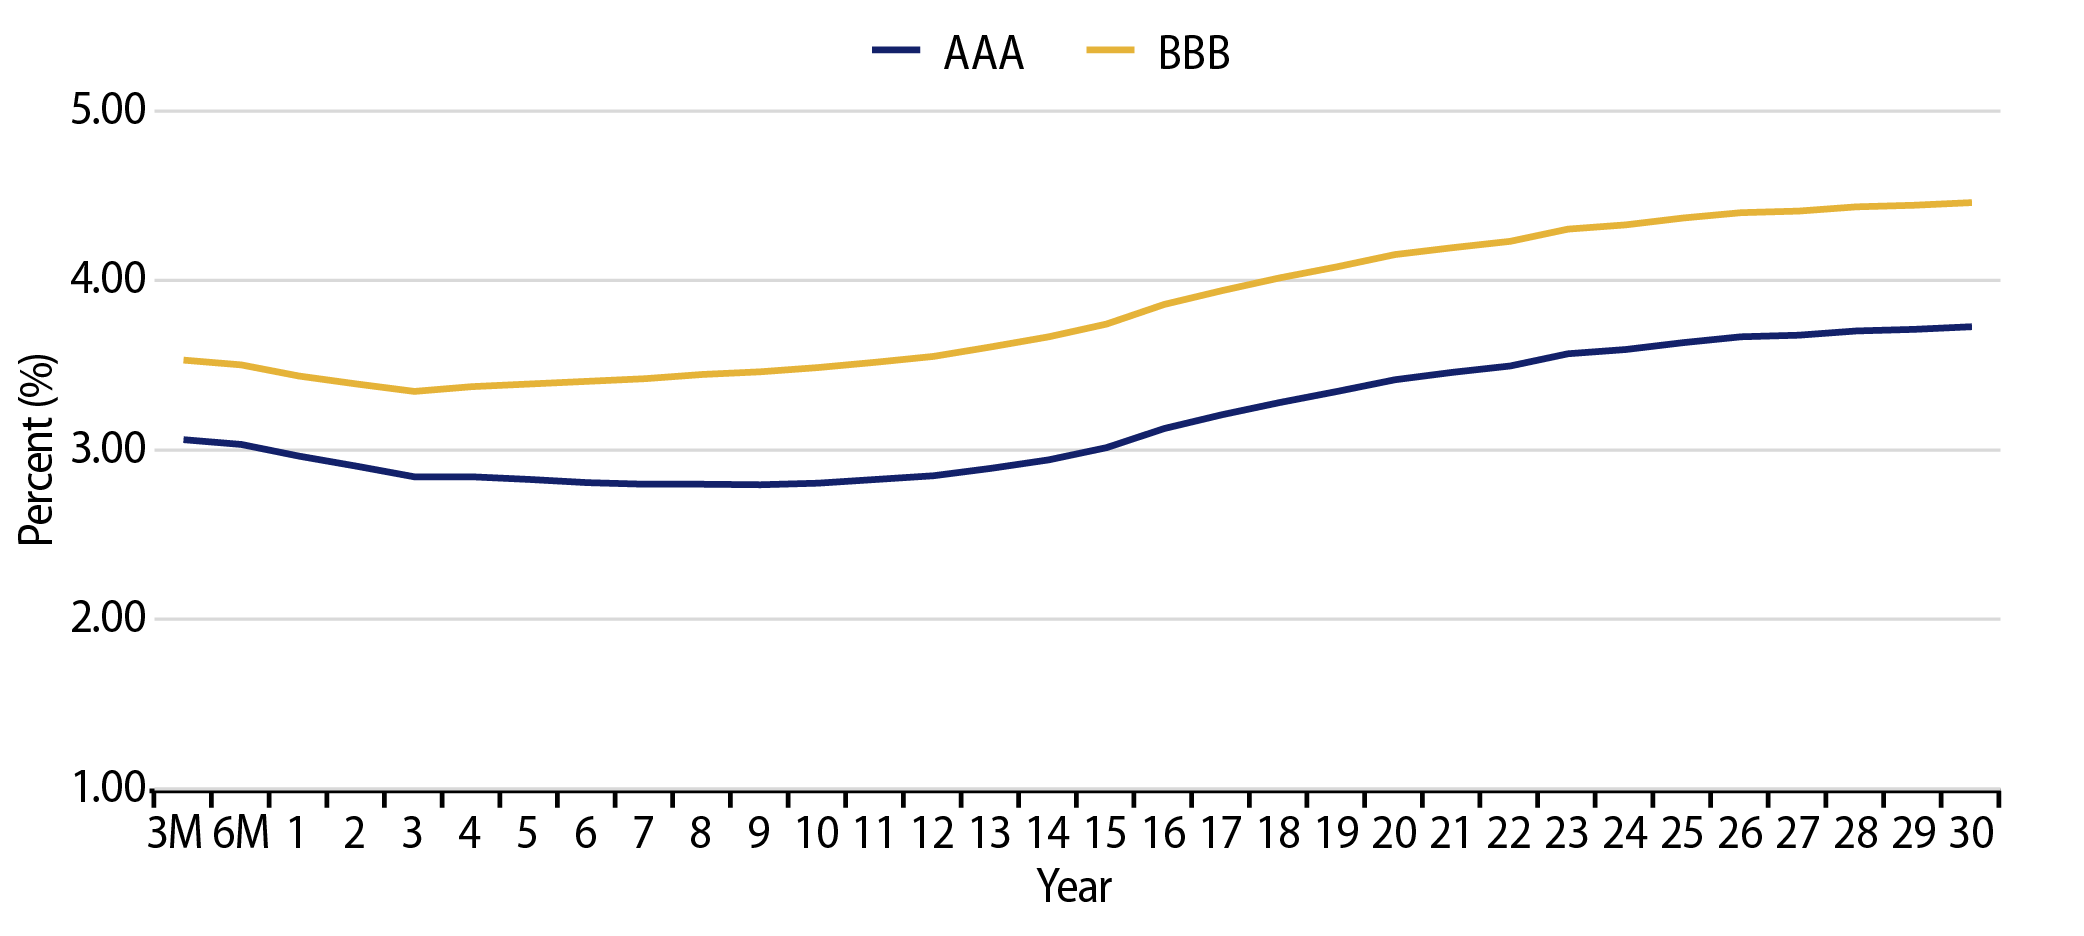
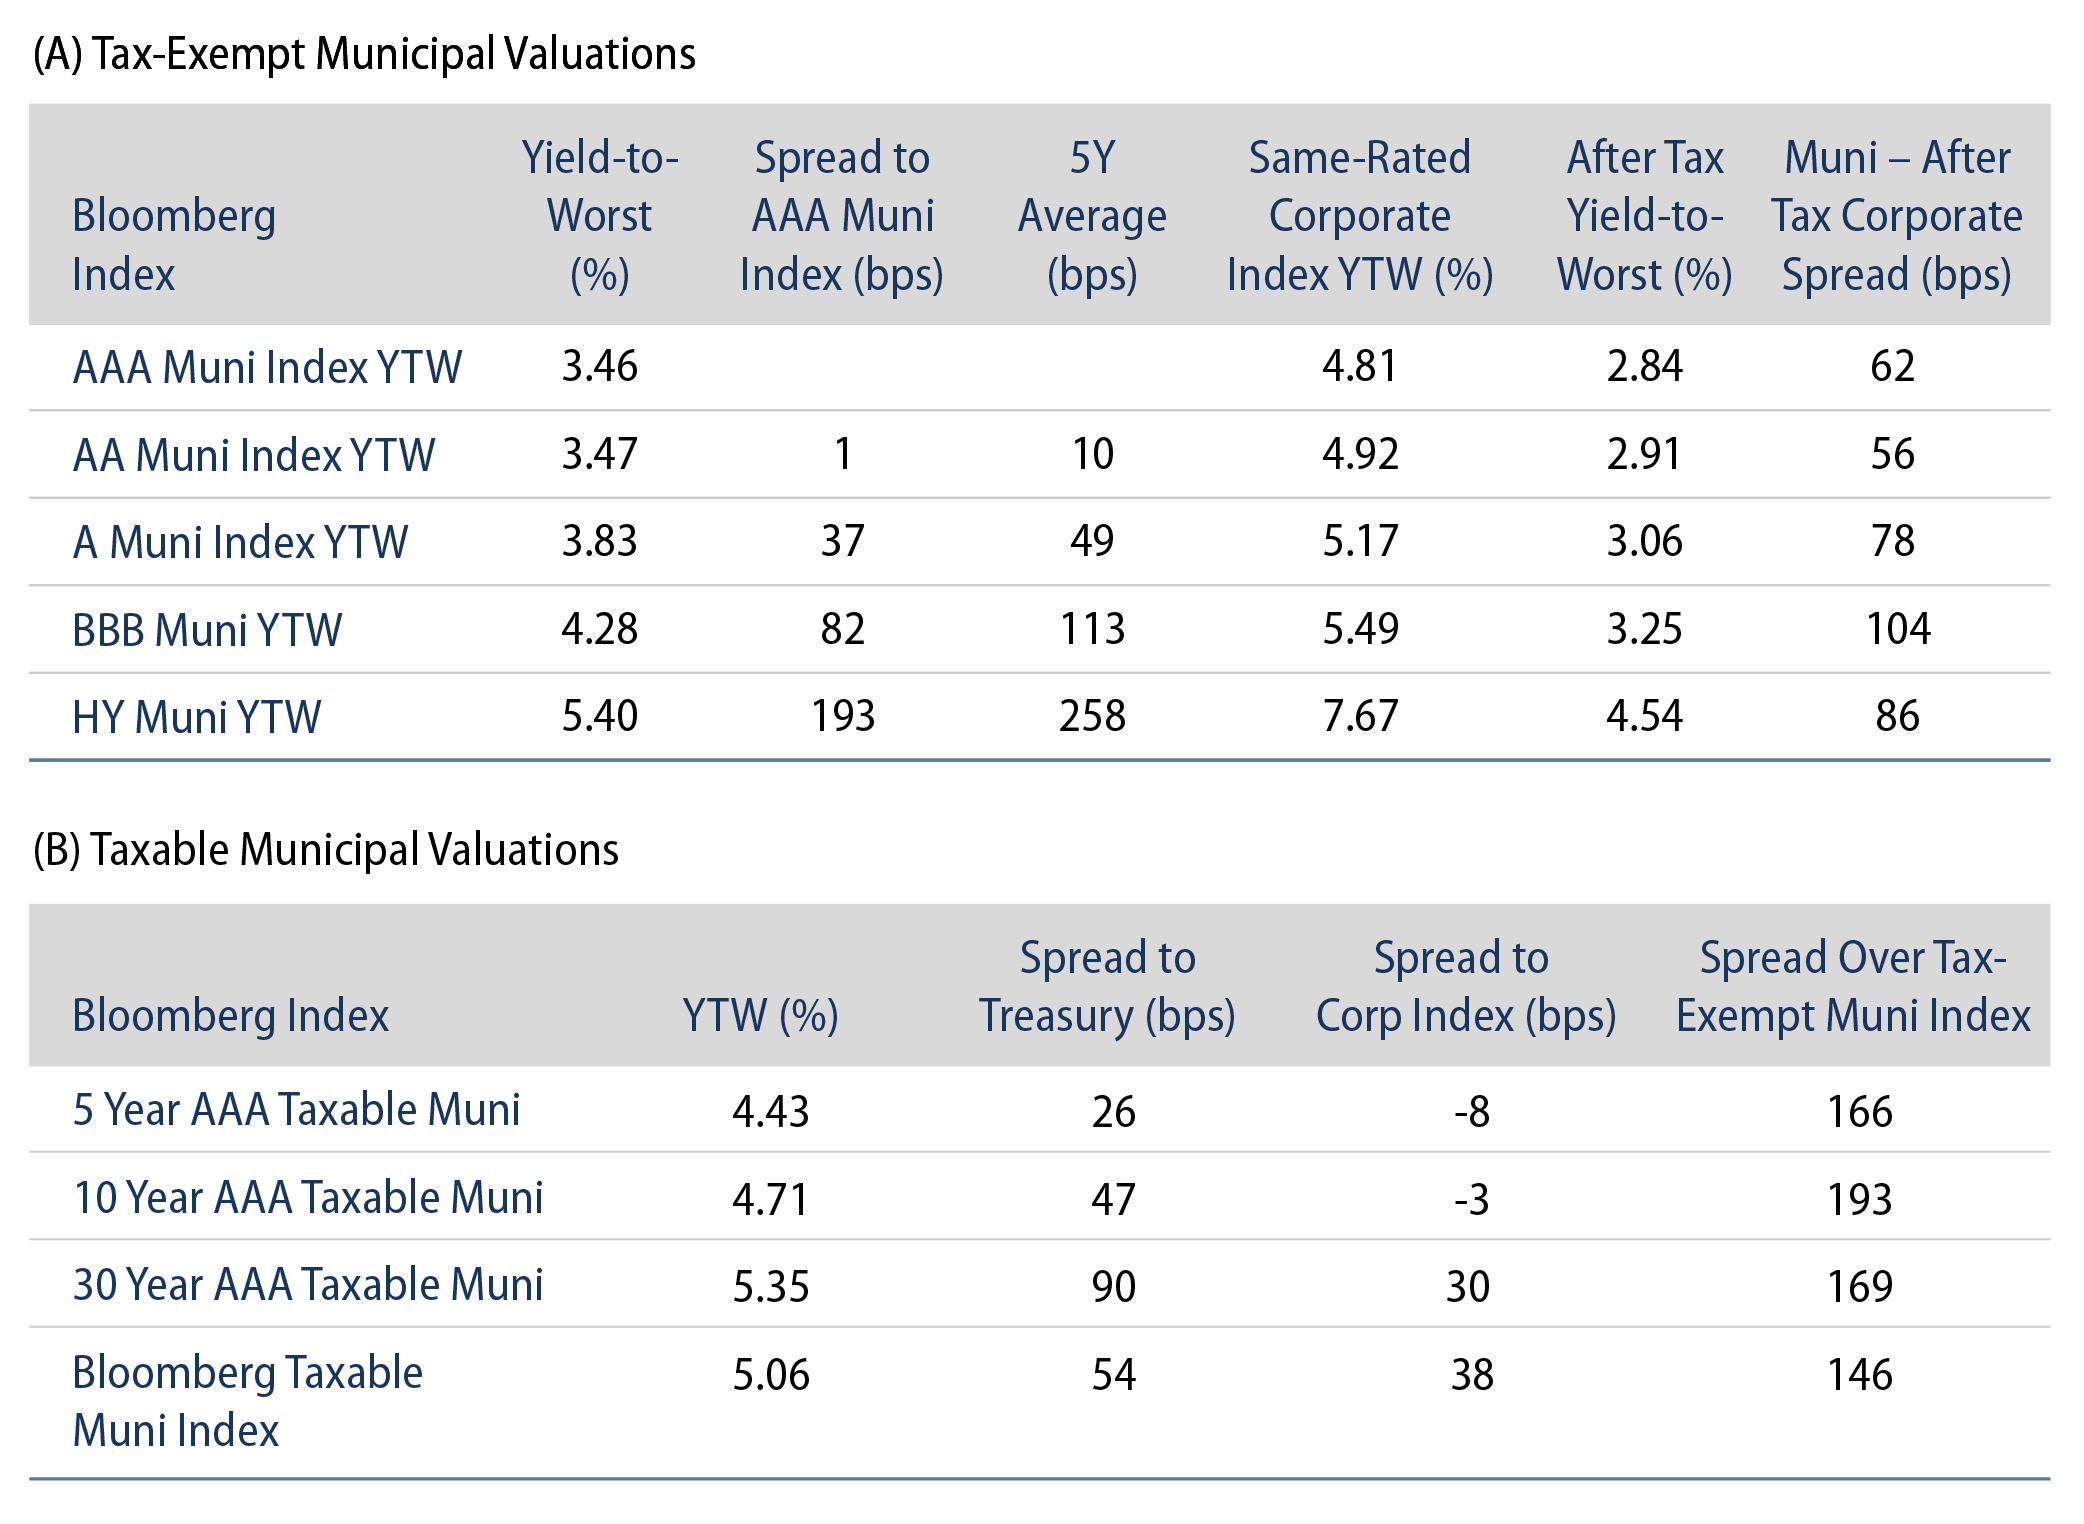
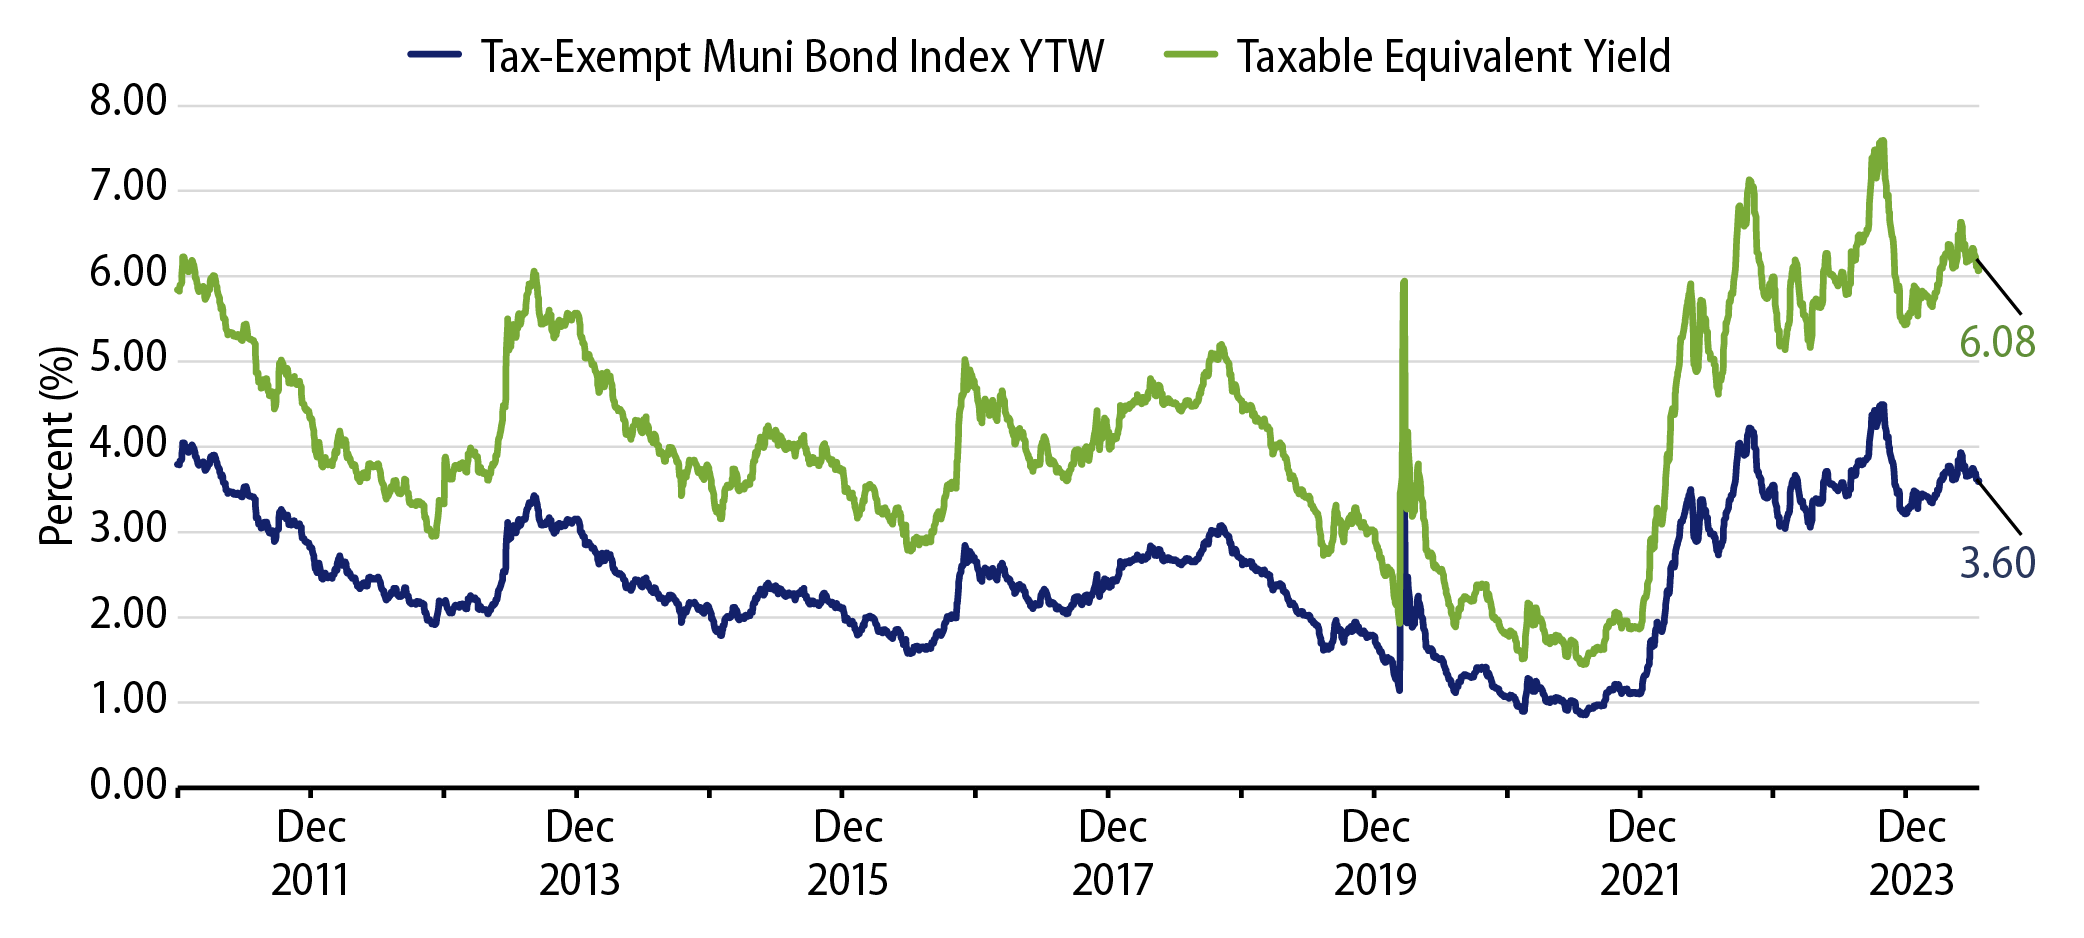
Theme #1: Municipal taxable-equivalent yields and income opportunities are above decade averages.
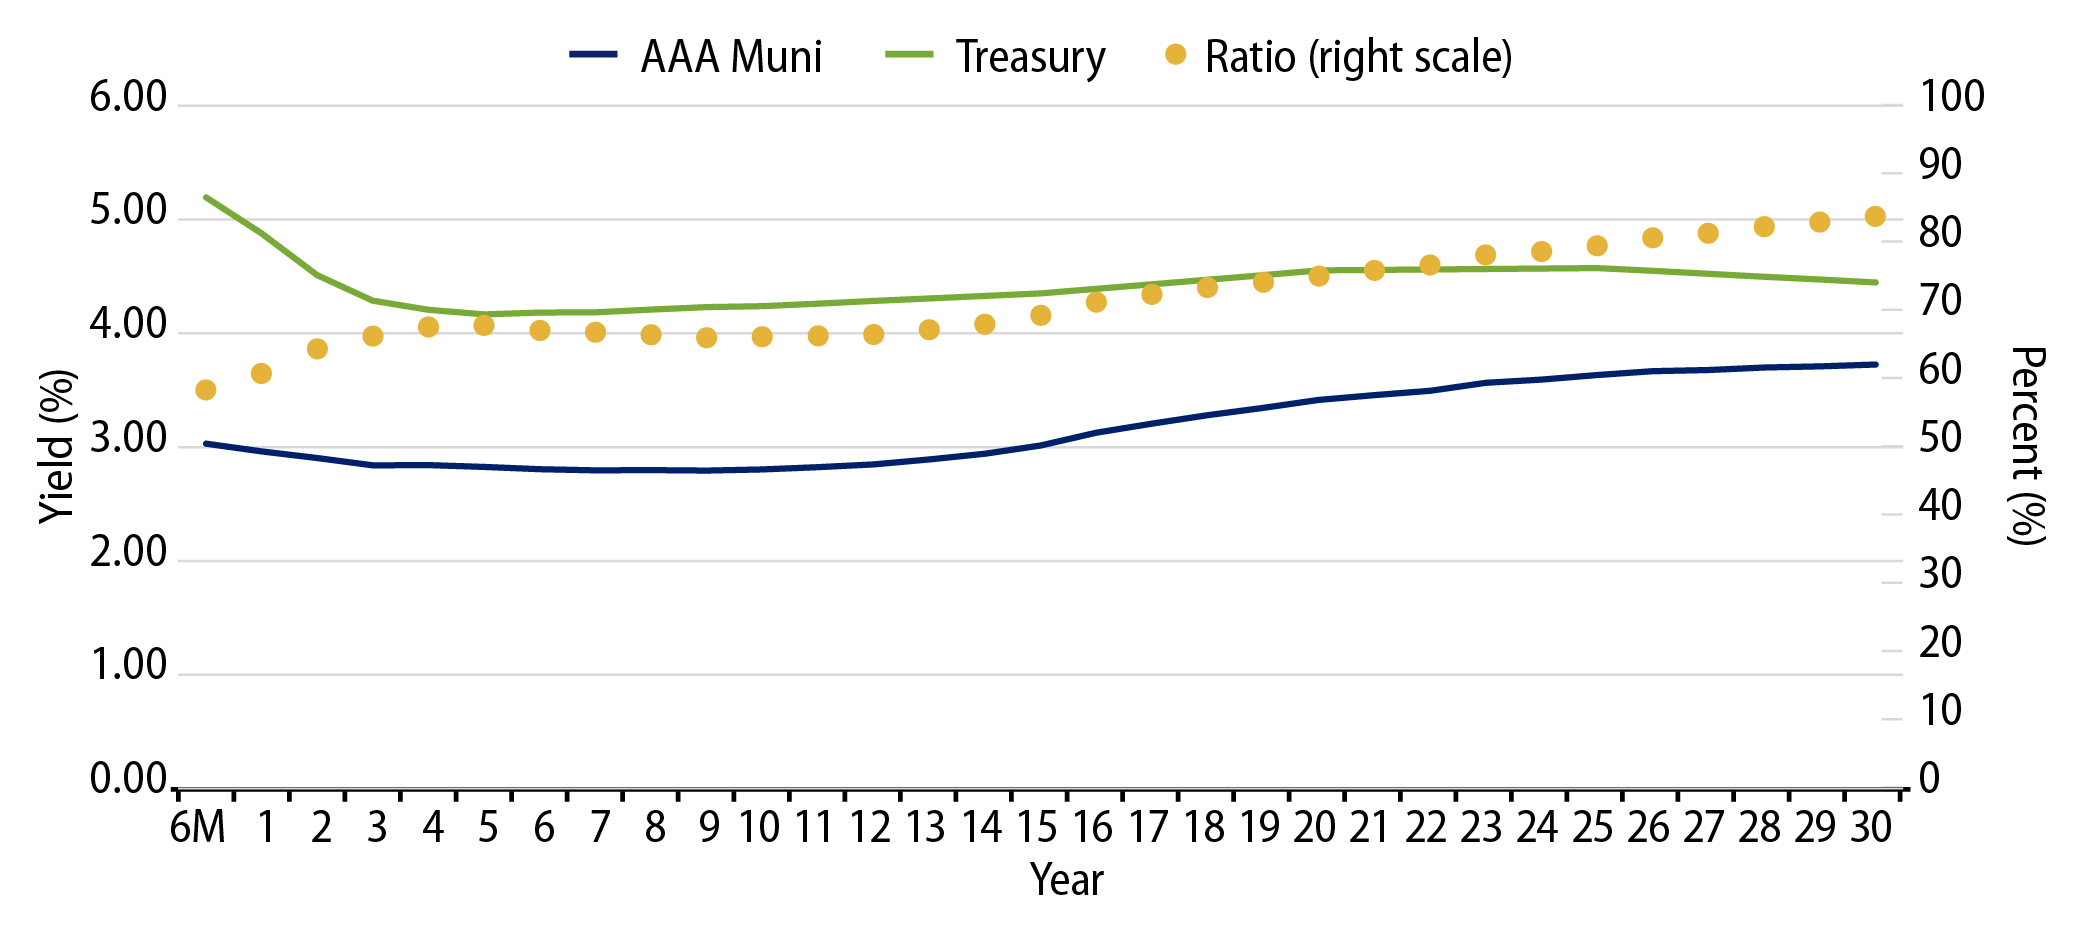
Theme #2: The muni yield curve has disinverted, offering greater value in longer maturities.
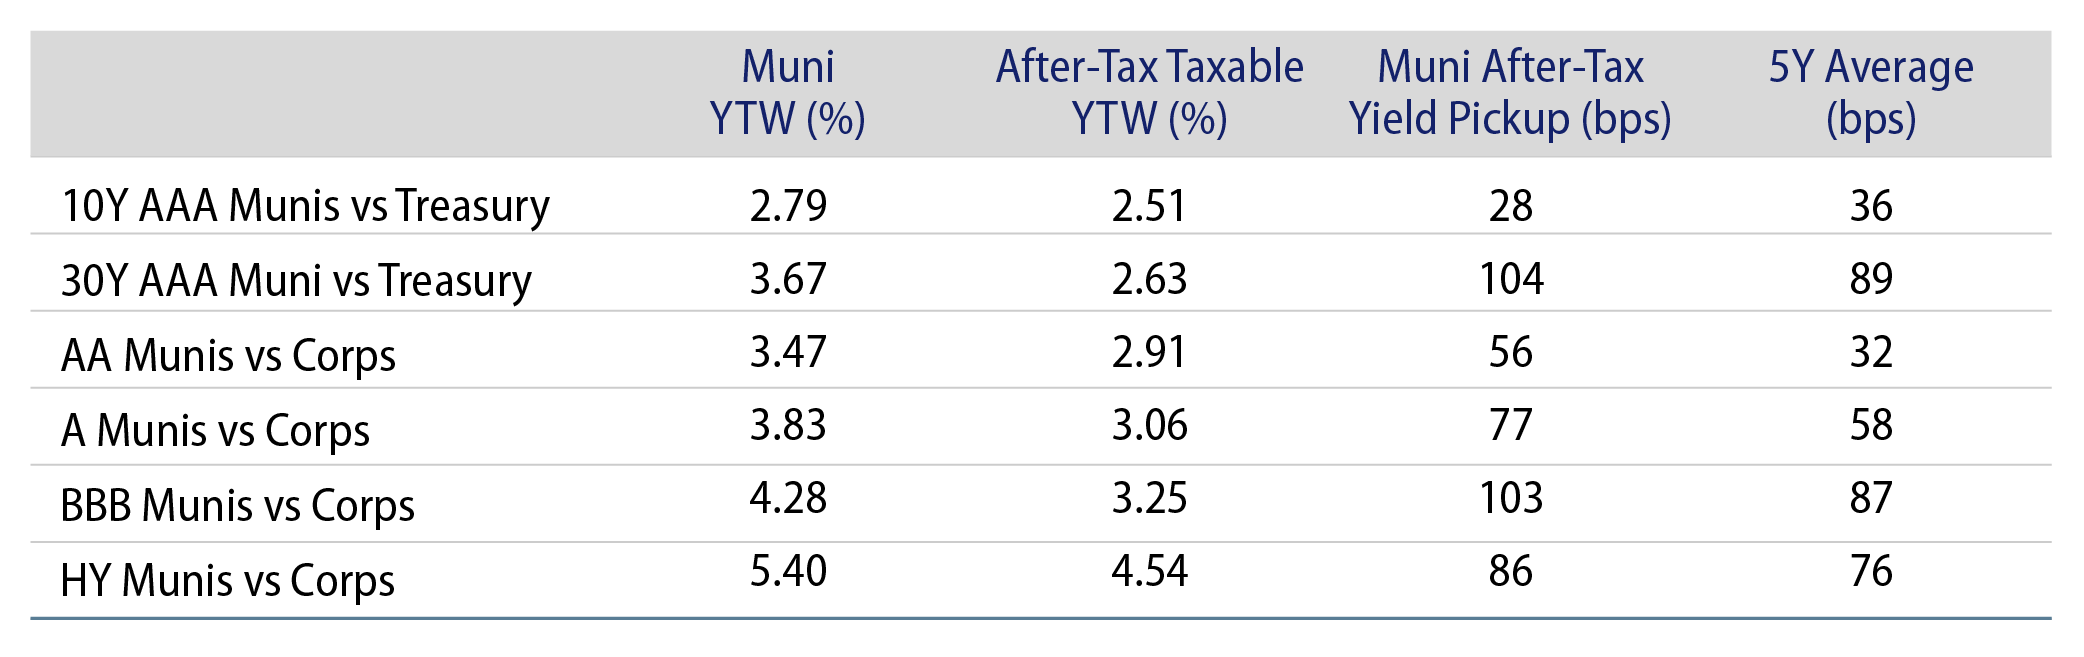
Theme #3: Munis offer attractive after-tax yield pickup versus longer-dated Treasuries and investment-grade corporate credit.