マーケット・ブログ
MARKETS
18 March 2025

Weekly Municipal Monitor—Recessions and Munis

By Sam Weitzman

Macros, Markets and Munis

Munis posted negative returns last week as Treasury yields moved 6 to 16 basis points (bps) higher due to a greater consensus taking shape that the Federal Reserve (Fed) will be unlikely to cut rates this week or during its May meeting. Muni yields moved higher in sympathy with Treasuries but outperformed over the week. Risk sentiment remained weak amid ongoing tariff rhetoric and growth concerns. From an economic data perspective, January job openings came in higher than expected, the February Consumer Price Index (CPI) came in below expectations and declined to 2.8%, and consumer sentiment data moved lower. Meanwhile, muni demand turned negative following seven consecutive weeks of inflows. This week we highlight historical municipal market reactions to recessionary environments.

Demand Weakens as Funds Post Outflows

Fund Flows (down $373 million): During the week ending March 12, weekly reporting municipal mutual funds recorded $373 million of net outflows, according to Lipper. Long-term funds recorded $425 million of outflows, intermediate funds recorded $30 million of inflows and high-yield funds recorded $107 million of inflows. Last week’s outflows broke a seven-week streak of inflows and led year-to-date (YTD) inflows lower to $10 billion.

Supply (YTD supply of $103 billion; up 41% YoY): The muni market recorded $11 billion of new-issue supply last week, down from the prior week. YTD, the muni market has recorded $103 billion of new issuance, up 41% year-over-year (YoY). Tax-exempt and taxable issuance are each up 41%, though tax-exempt issuance has comprised the vast majority (95%) of YTD supply. This week’s calendar is expected to tick lower but remain elevated at $10 billion. The largest deals include $3 billion Dormitory Authority of the State of New York and $1.1 billion Metropolitan Transportation Authority transactions.

This Week in Munis: Recessions and Munis

Recession fears spiked last week as tariff policy and austerity measures drew concern across markets. Equities sold off amid the risk-off sentiment, with the S&P 500 falling 3.9% YTD and the Nasdaq falling 6.1% YTD. Notably, the Atlanta Fed GDPNow indicator declined to as low as -2.8% to start the month, marking the lowest level since the 2020 pandemic drawdowns.

Exhibit 1: Federal Reserve Bank of Atlanta GDP Forecast
Federal Reserve of Atlanta GDP Forecast
Source: Federal Reserve Bank of Atlanta. As of 14 Mar 25. Select the image to expand the view.

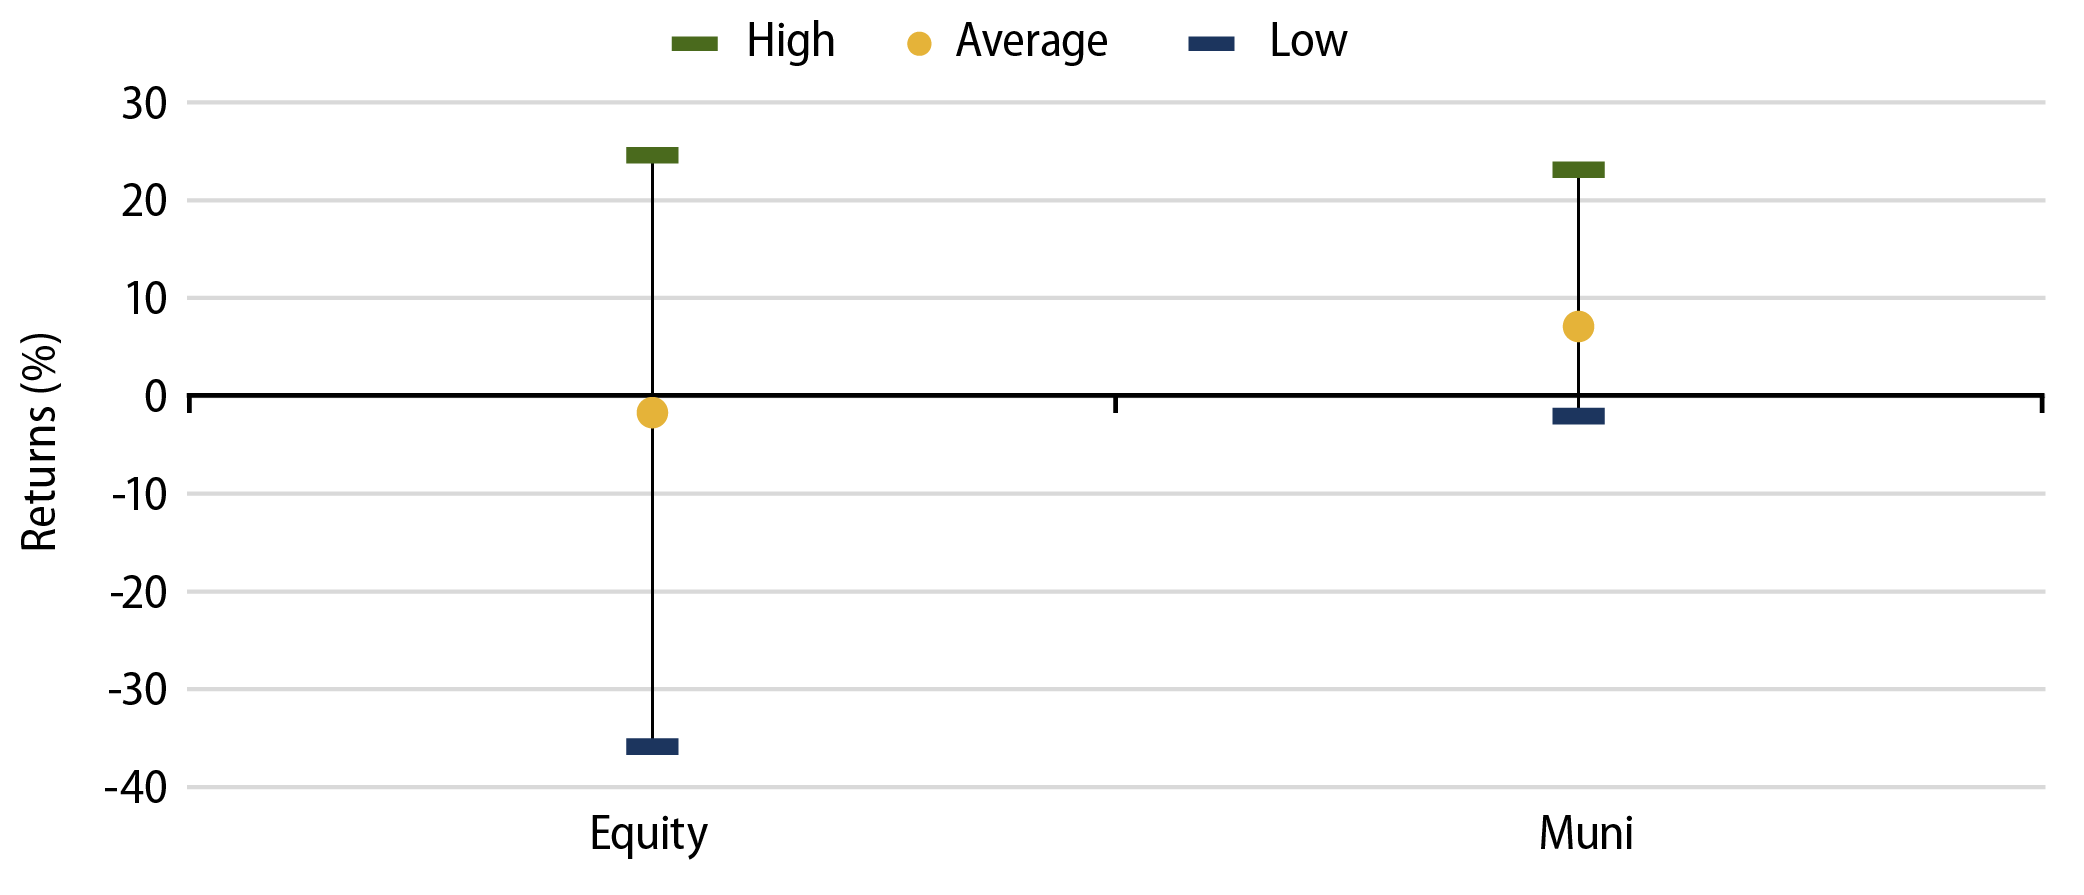
Over the past five recessionary periods, municipals have exhibited attractive risk-adjusted performance compared to equities. When comparing the returns of the Bloomberg Municipal Bond Index to the S&P 500 Index, municipals posted positive returns on average (+7.2%), while equity returns delivered average negative returns (-1.2%). Meanwhile, the maximum drawdown for equities over these periods was 35%, compared to the -1.9% return for the Bloomberg Municipal Bond Index, highlighting the potential for relative stability and resilience of municipal bonds during economic downturns.

Exhibit 2: Performance During Prior Recessions (1981-2020)
Performance During Prior Recessions (1981-2020)
Source: Bloomberg, NBER, Western Asset. As of 14 Mar 25. Muni: index returns represented by the Bloomberg Muni Bond Index. Equity: index returns represented by the S&P 500 Index. Recession scenarios defined as follows—1980: January to July; 1981: July to November 1982; 1990: July 1990 to March 1991; 2001: March 2001 to November 2001; 2007: December 2007 to June 2009; 2020: February 2020-April 2020. Select the image to expand the view.

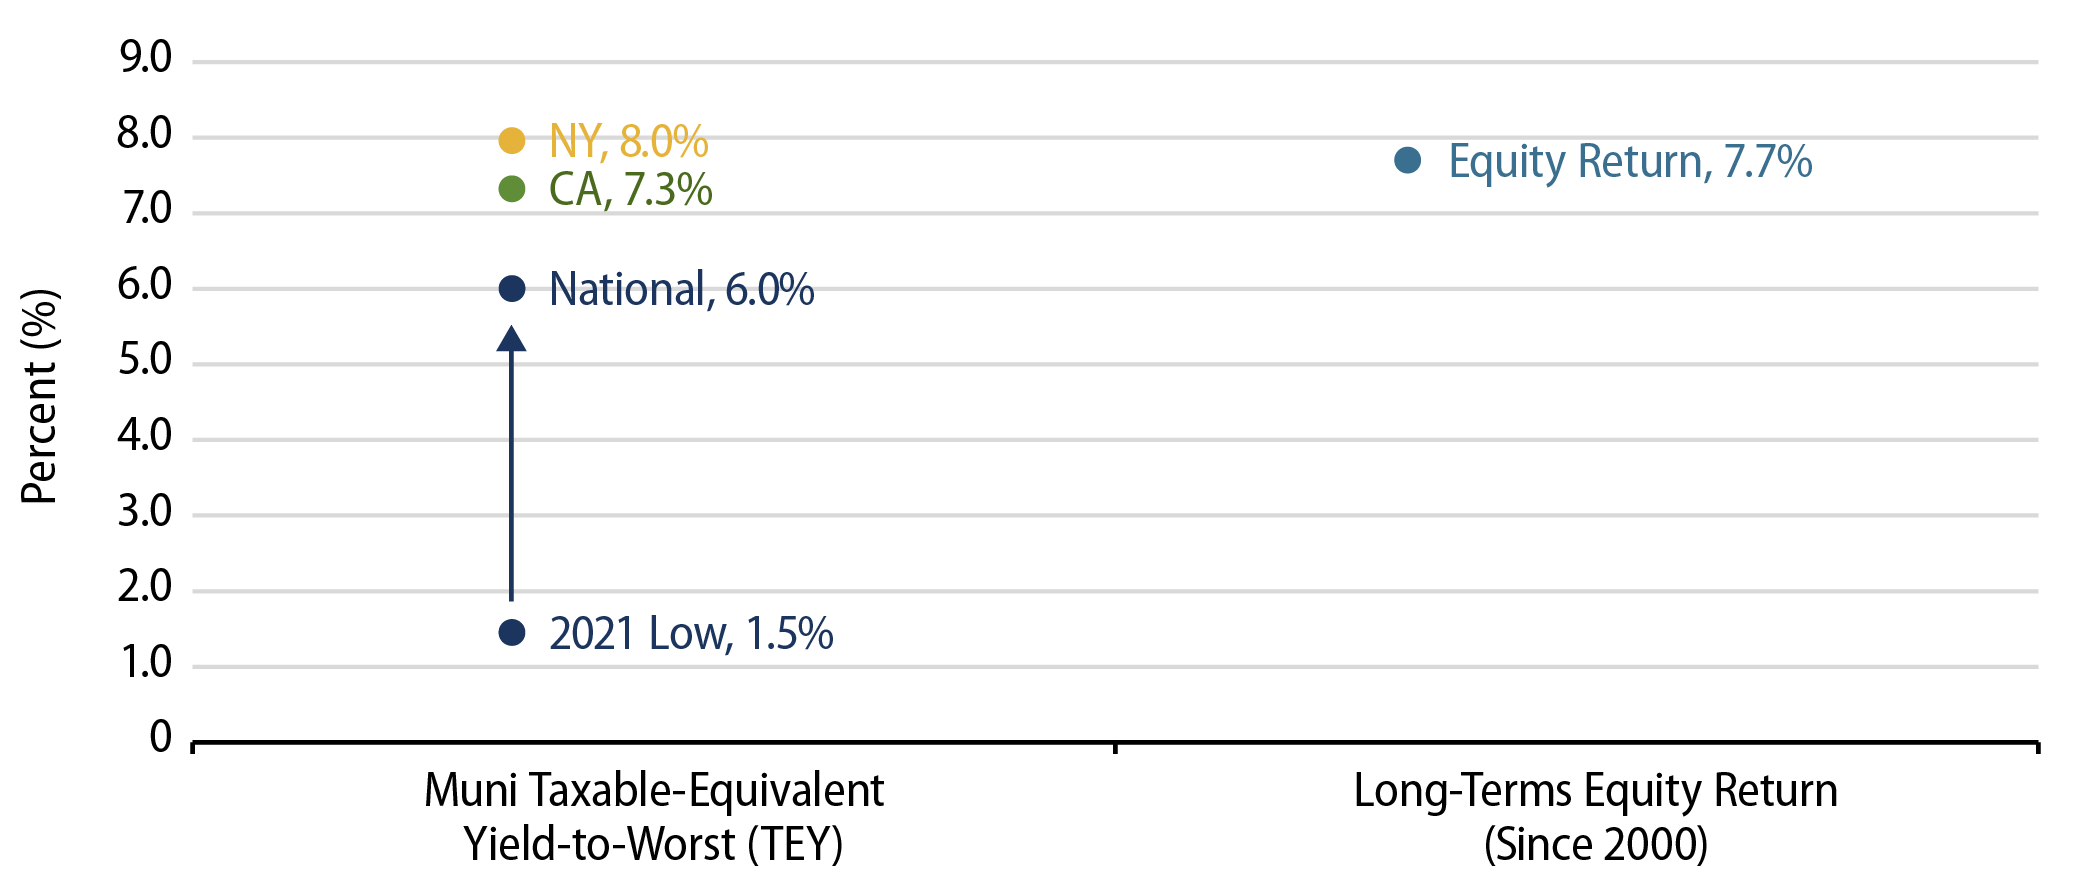
Current muni valuations versus volatile equity counterparts further add to the risk-adjusted value proposition. Considering the Bloomberg Municipal Bond Index starting yield levels, taxable-equivalent income opportunities of 6%-8% offered by munis are presently near long-term equity return levels of 7.7%. This is particularly compelling given that since 2000 the volatility of the S&P 500 Index (15.25%) was more than three times that of the Bloomberg Municipal Bond Index (4.68%). All told, we anticipate the risk-adjusted value proposition to remain supported by favorable fundamental and technical factors, as state and local revenues and reserve balances remain at elevated levels. Meanwhile, we anticipate that demand could also improve should the Fed continue its cutting of short-term rates, making cash solutions less attractive relative to the longer-term after-tax opportunities offered by munis.

Exhibit 3: Muni Taxable-Equivalent Yields Have Approached Long-Term Equity-Like Return Levels
Muni Taxable-Equivalent Yields Have Approached Long-Term Equity-Like Return Levels
Source: Bloomberg, S&P. As of 28 Feb 25. Long-term equity return: S&P 500 Index annualized monthly returns from 01 Jan 00 to 28 Feb 25. Bloomberg indices considering the highest marginal tax rate of 40.8%—National: Bloomberg Municipal Bond Index. CA: Bloomberg California Municipal Bond Index. NY: Bloomberg New York Municipal Bond Index. Yield-to-worst (YTW) is the lowest potential yield that can be received on a bond without the issuer actually defaulting. Select the image to expand the view.

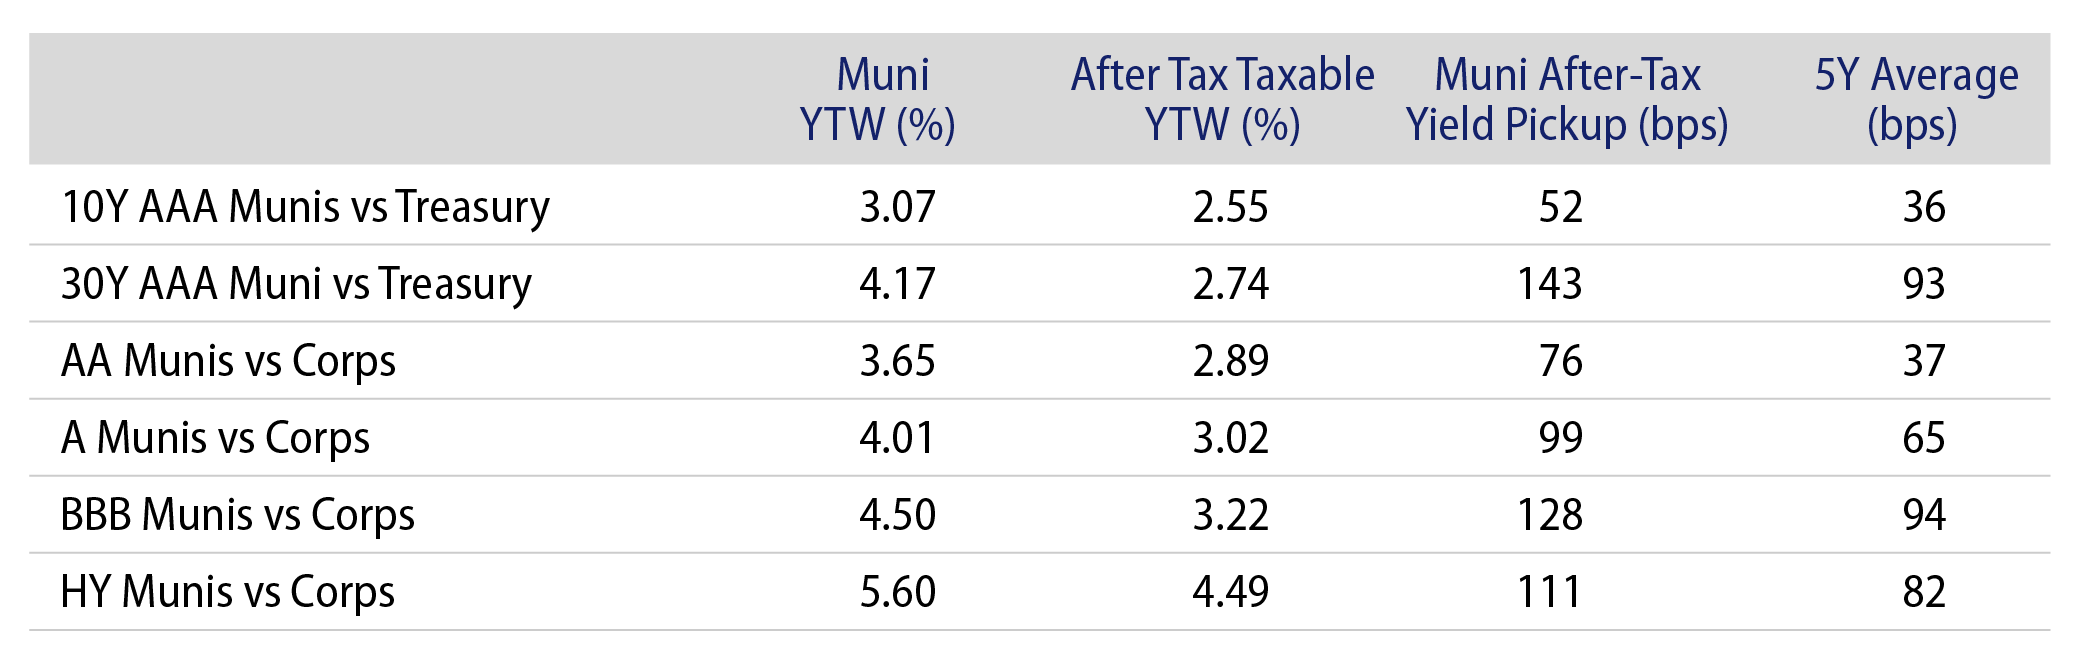
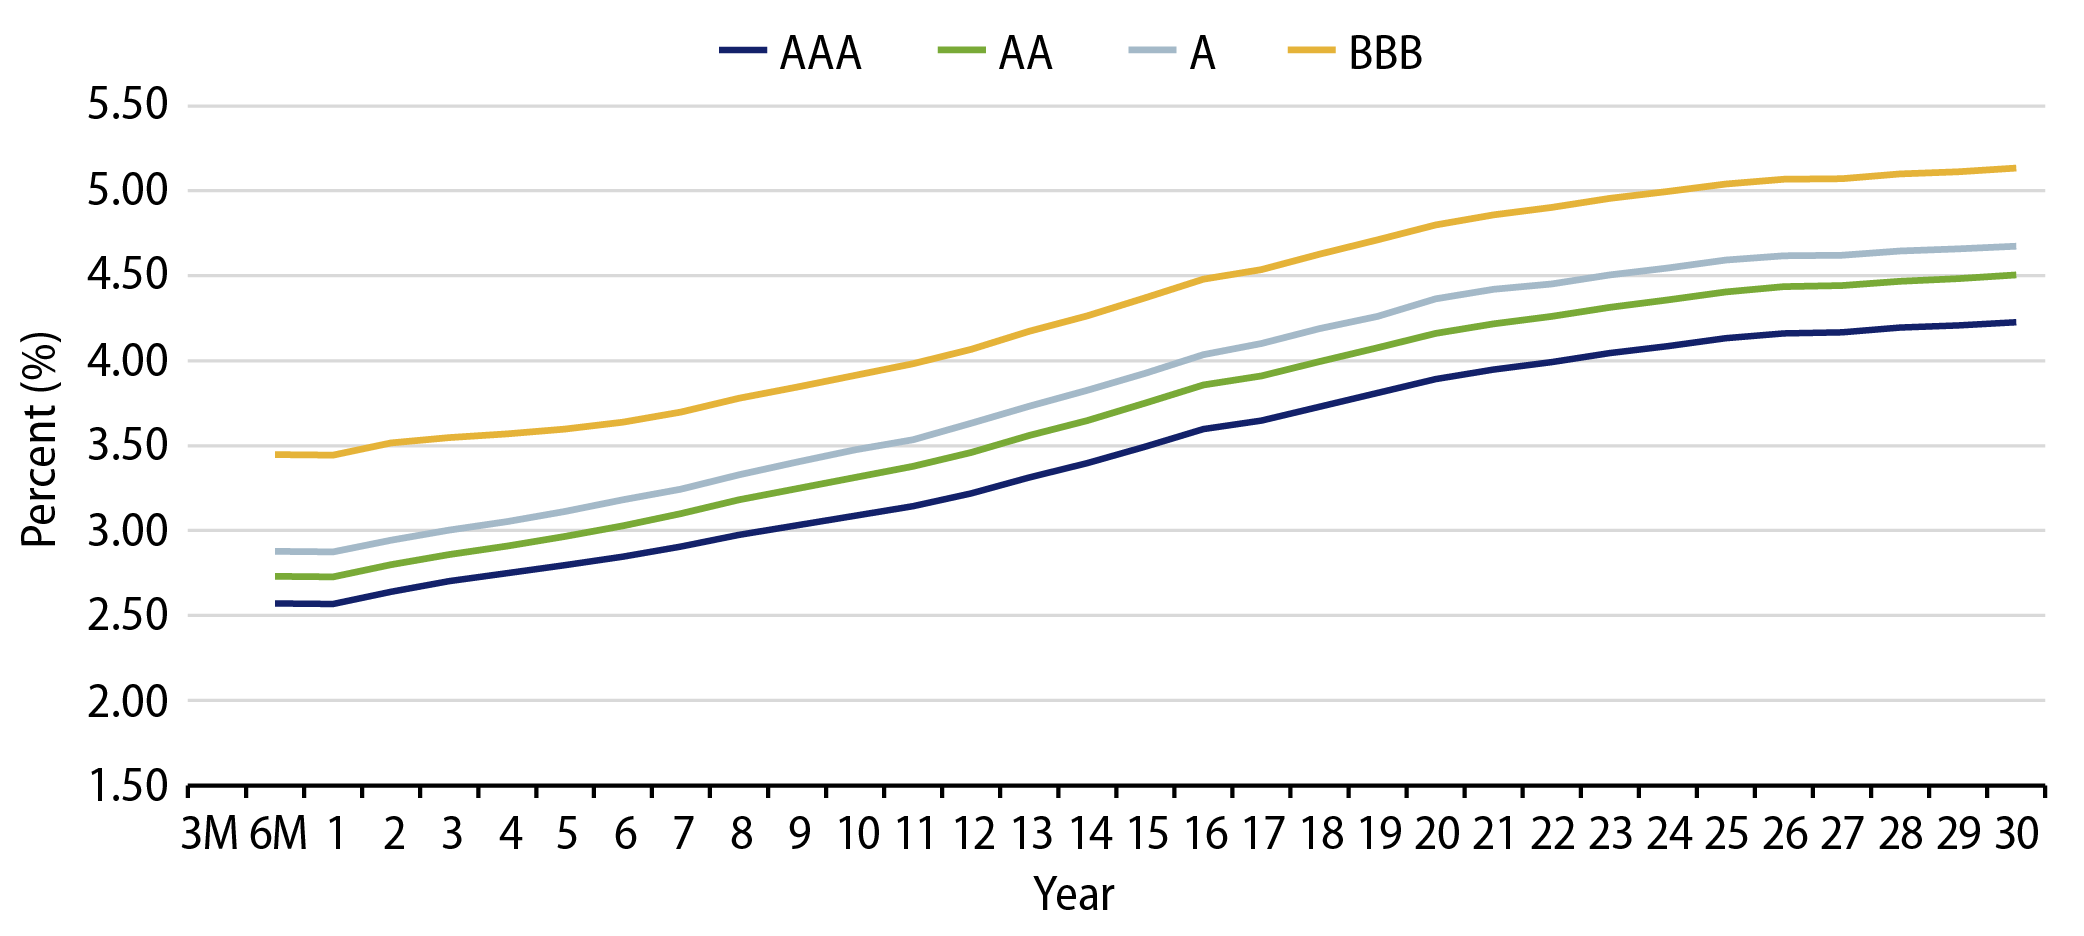
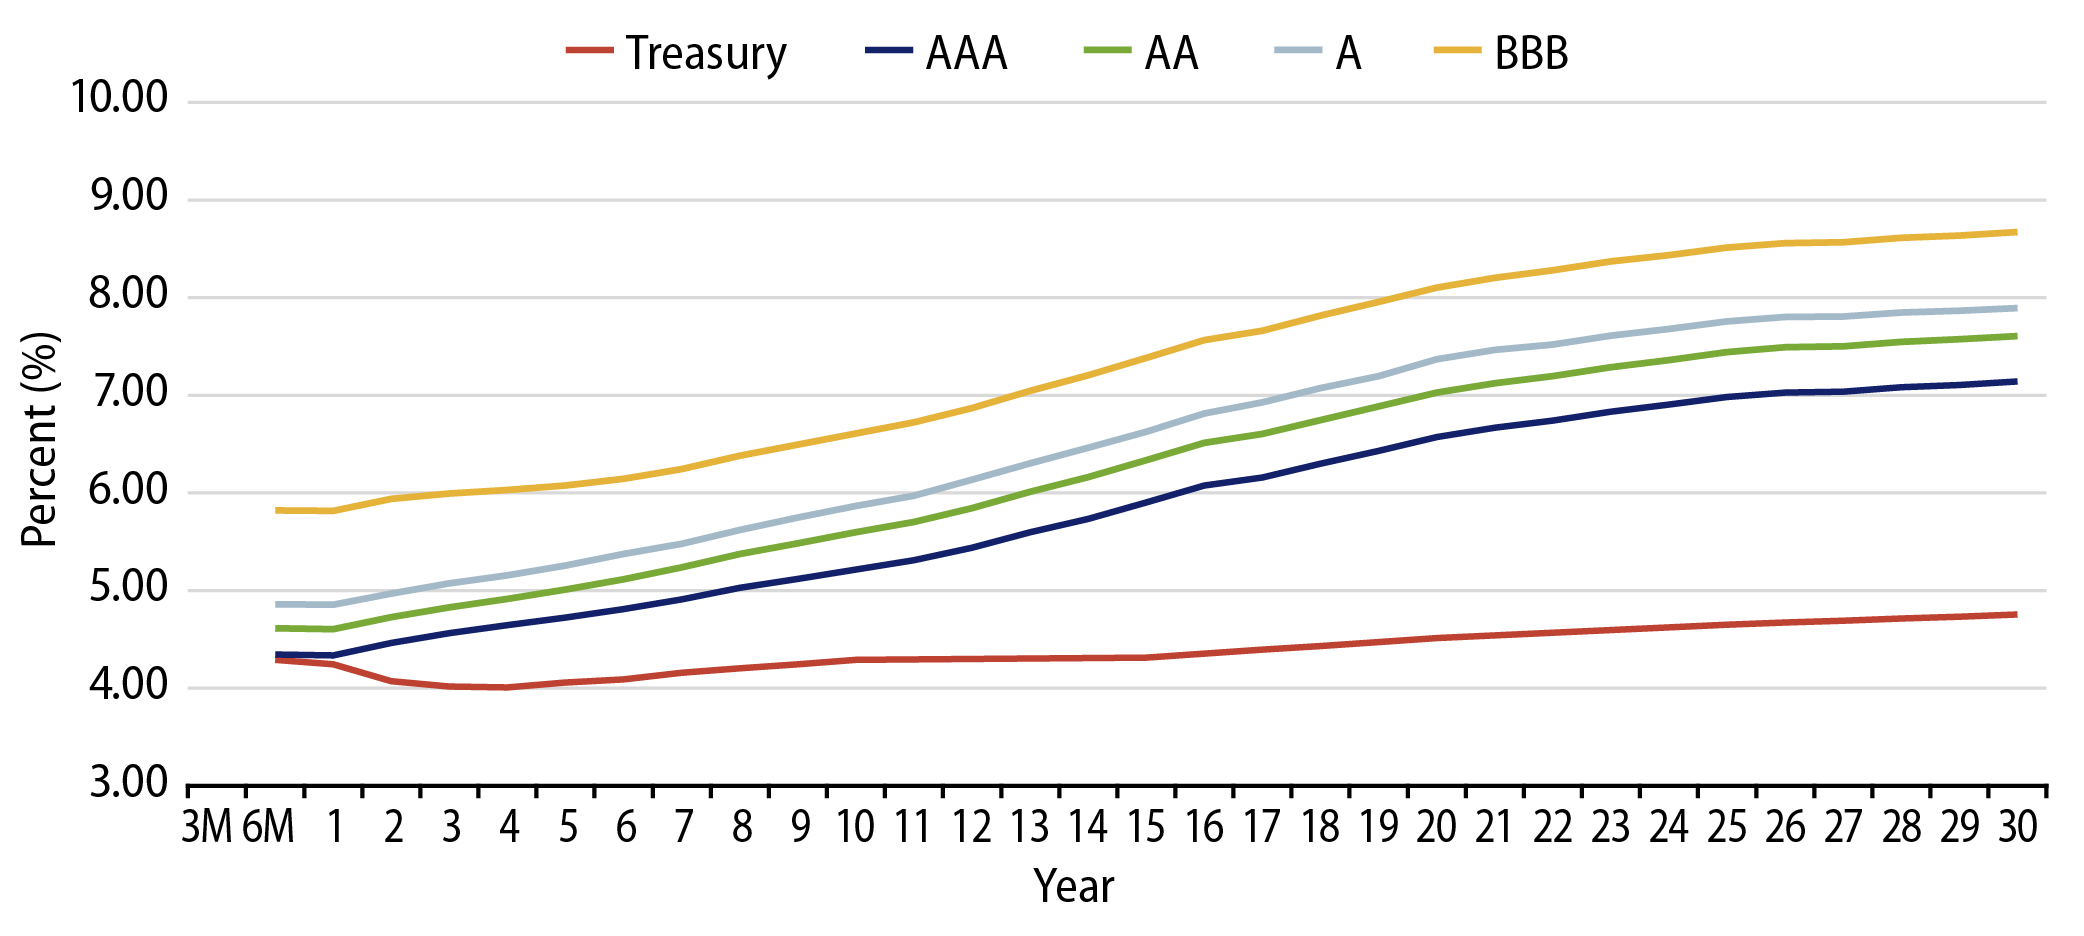
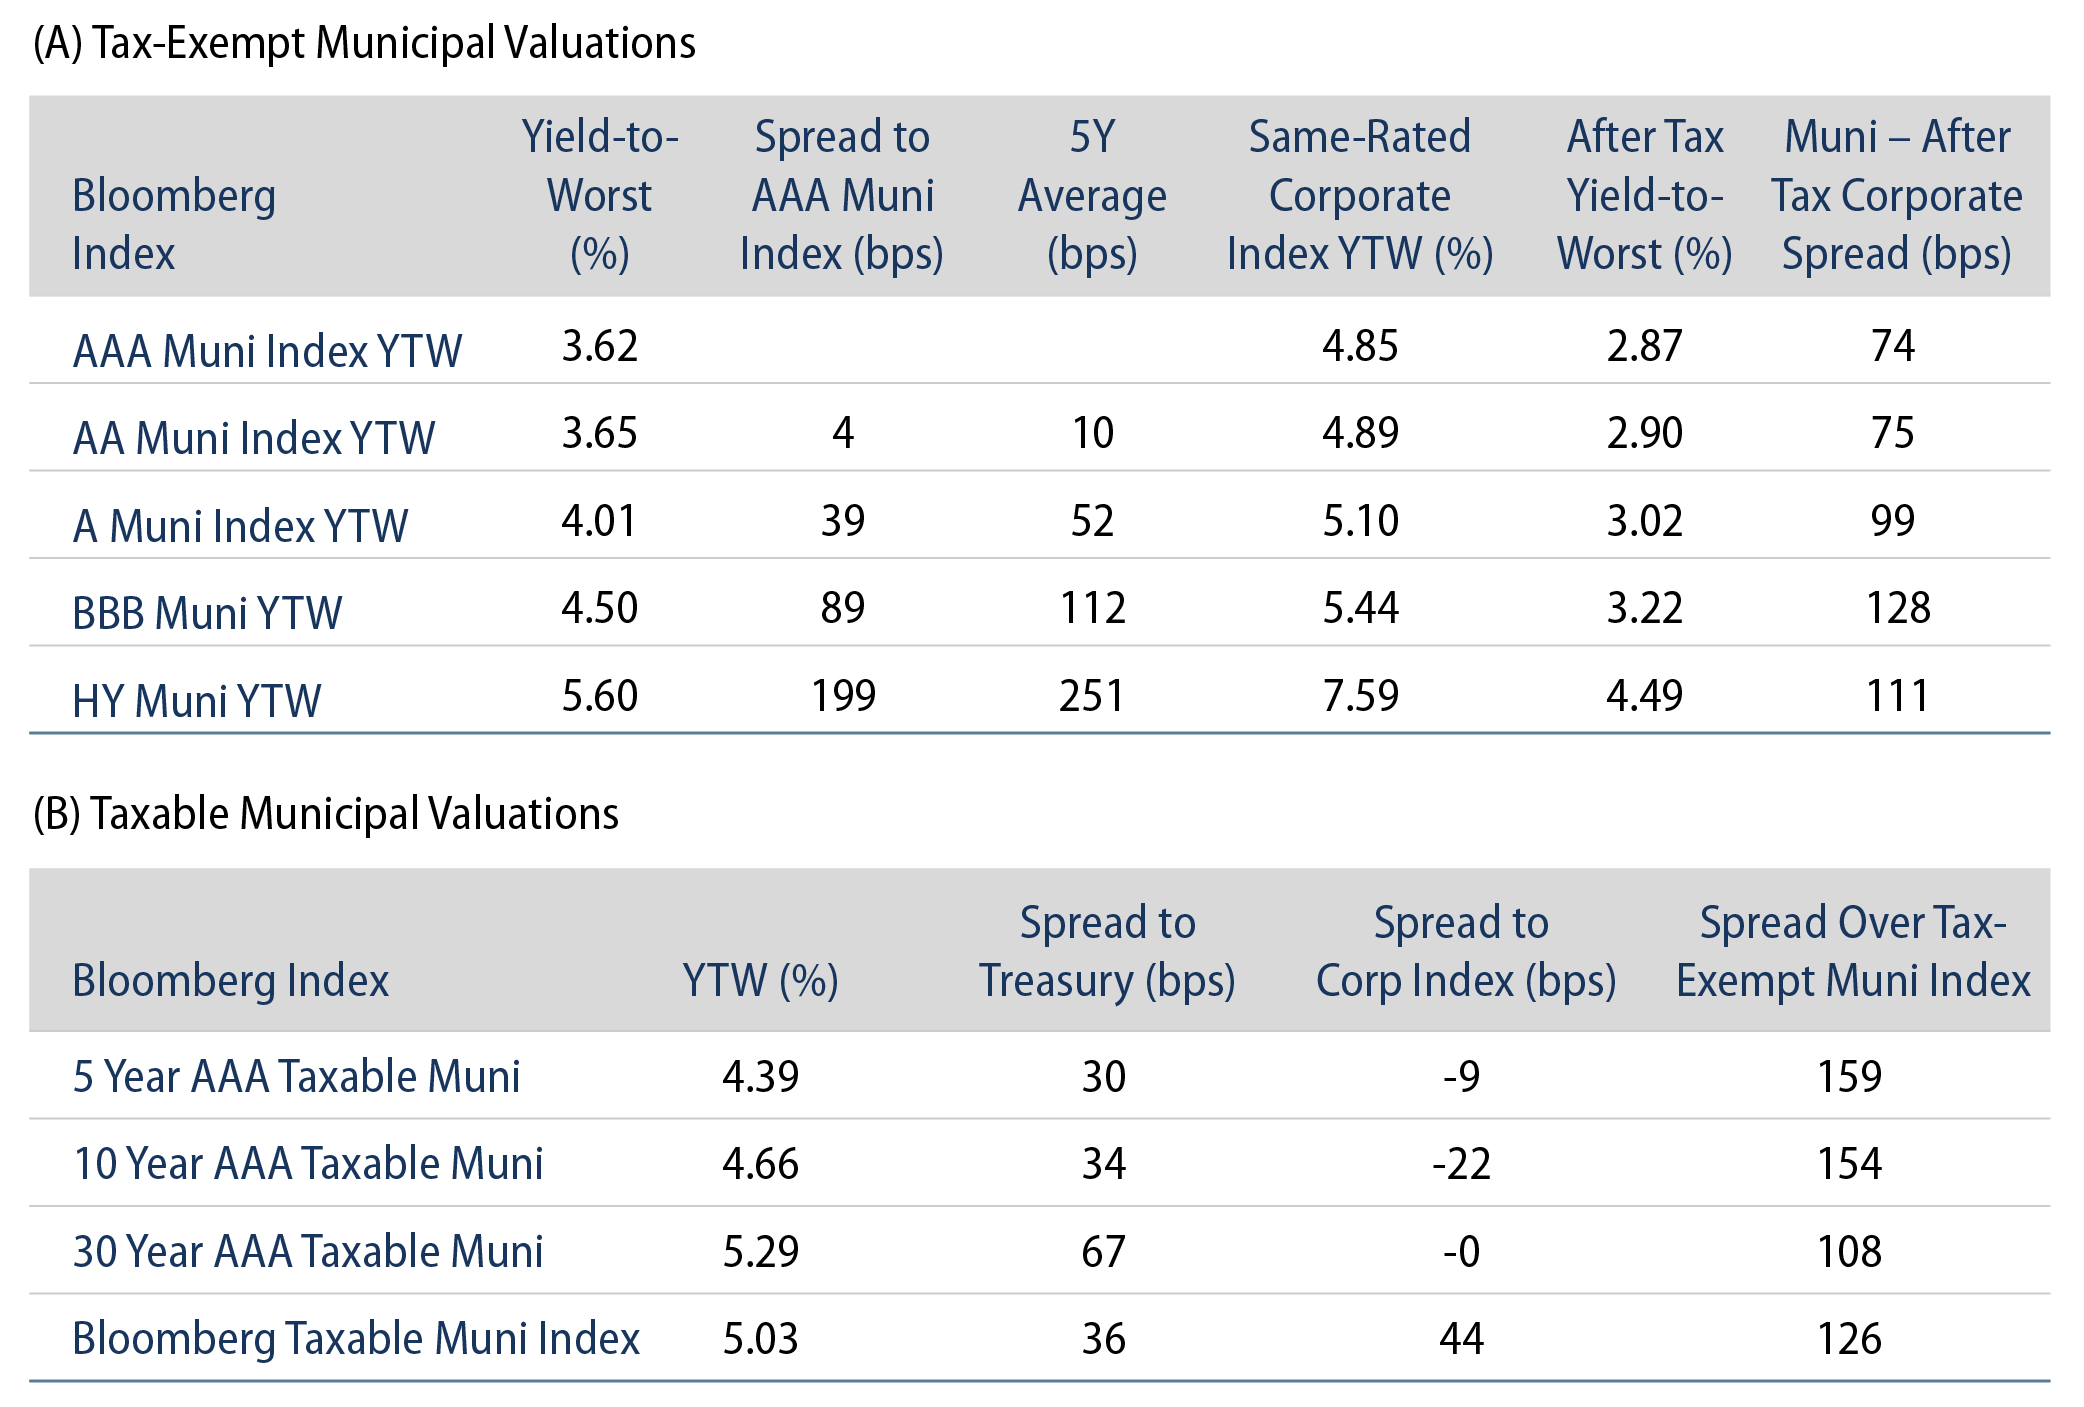
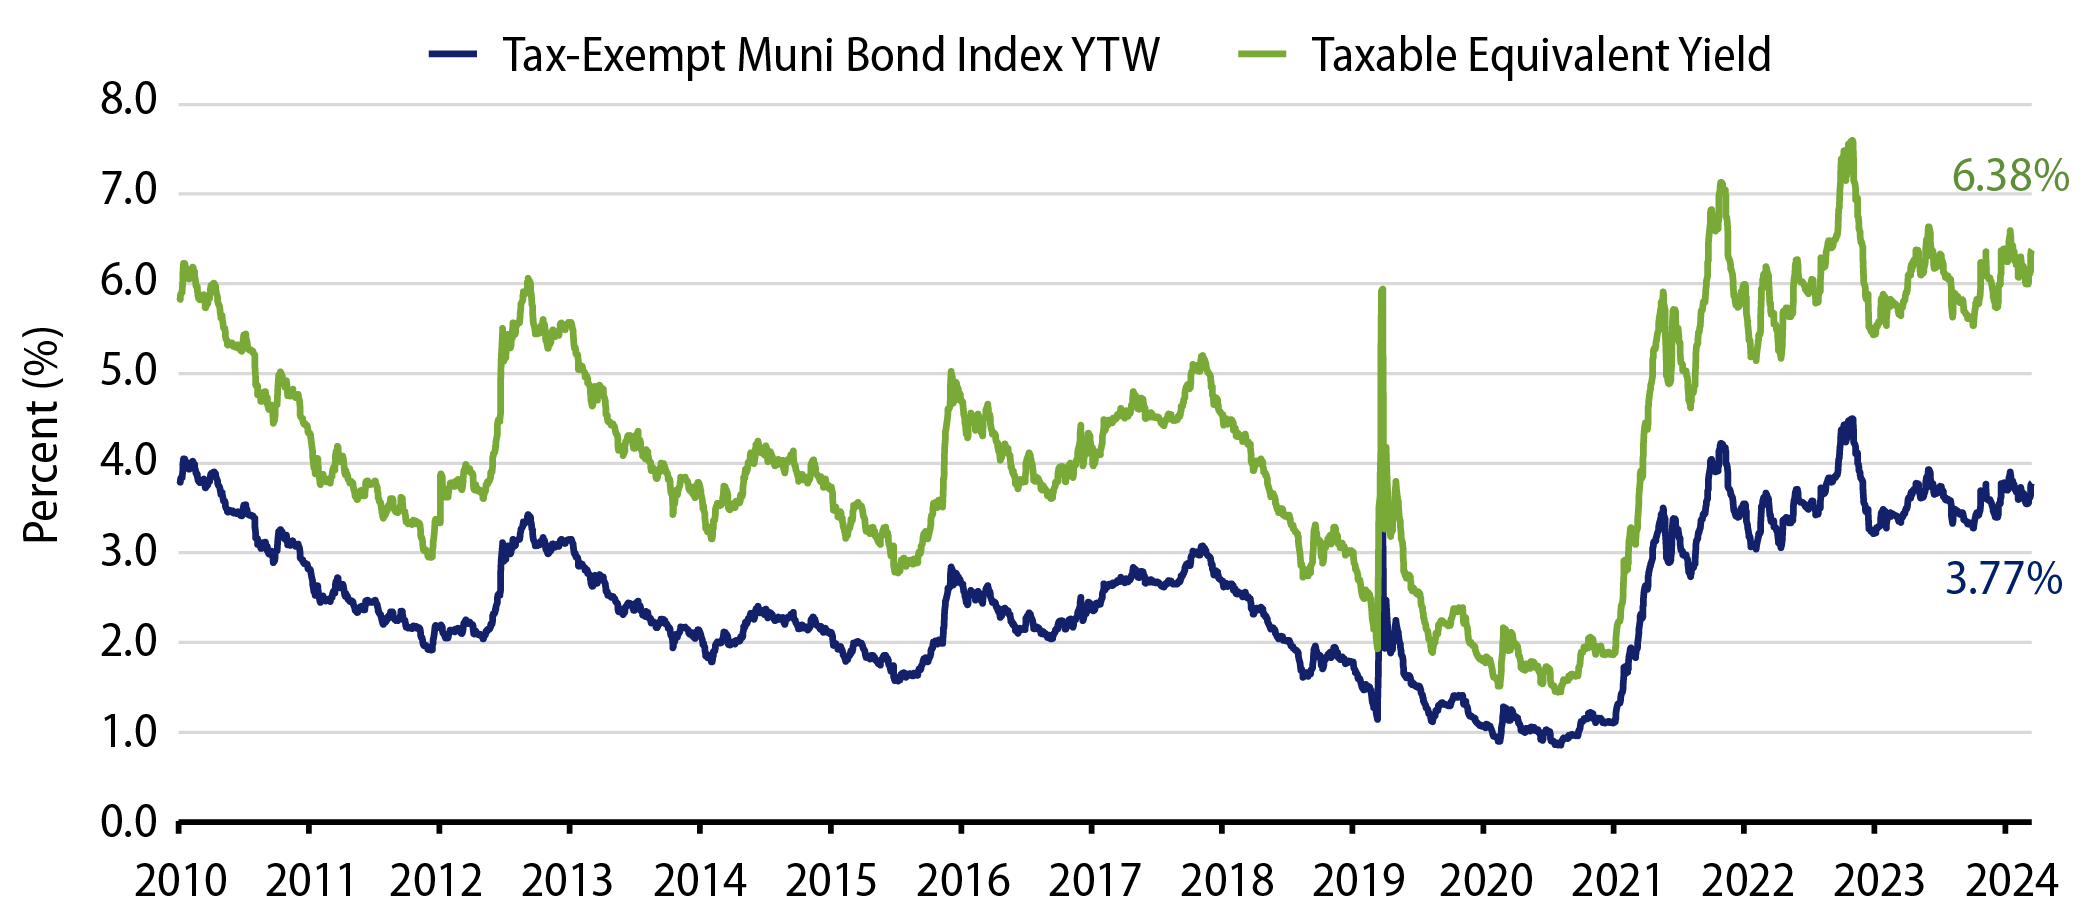
Municipal Credit Curves and Relative Value

Exhibit 4: Muni Credit Curves
Muni Credit Curves
Source: Bloomberg, Western Asset. As of 14 Mar 25. Bloomberg Valuation Service (BVAL) Municipal Credit Indices (AAA, AA, A, BBB, respectively) and US Sovereign Curves. Taxable-Equivalent Muni Credit Curves consider the top marginal effective tax rate of 40.8%. AA Muni is represented by the US General Obligation AA Muni BVAL Yield Curve. The BVAL curve is populated with pricing from uninsured AA General Obligation bonds. A Muni is represented by the US General Obligation A Muni BVAL Yield Curve. The BVAL curve is populated with pricing from uninsured A General Obligation bonds. BBB Muni is represented by the US General Obligation BBB Muni BVAL Yield Curve. The BVAL curve is populated with pricing from uninsured BBB General Obligation bonds. Indices are unmanaged and one cannot directly invest in them. They do not include fees, expenses or sales charges. Past performance is not an indicator or a guarantee of future results. Select the image to expand the view.
Exhibit 5: Taxable-Equivalent Muni Credit Curves
Taxable-Equivalent Muni Credit Curves
Source: Bloomberg, Western Asset. As of 14 Mar 25. Bloomberg Valuation Service (BVAL) Municipal Credit Indices (AAA, AA, A, BBB, respectively) and US Sovereign Curves. Taxable-Equivalent Muni Credit Curves consider the top marginal effective tax rate of 40.8%. AA Muni is represented by the US General Obligation AA Muni BVAL Yield Curve. The BVAL curve is populated with pricing from uninsured AA General Obligation bonds. A Muni is represented by the US General Obligation A Muni BVAL Yield Curve. The BVAL curve is populated with pricing from uninsured A General Obligation bonds. BBB Muni is represented by the US General Obligation BBB Muni BVAL Yield Curve. The BVAL curve is populated with pricing from uninsured BBB General Obligation bonds. Indices are unmanaged and one cannot directly invest in them. They do not include fees, expenses or sales charges. Past performance is not an indicator or a guarantee of future results. Select the image to expand the view.
Exhibit 6: AAA Munis vs. Treasuries
AAA Munis vs. Treasuries
Source: Muni Yields: Thomson Reuters MMD, Treasury Yields: Bloomberg. As of 14 Mar 25. Past performance is not a guarantee of future results. It is not possible to invest directly in an index. Select the image to expand the view.
Exhibit 7: Tax-Exempt and Taxable Muni Valuations
Tax-Exempt and Taxable Muni Valuations
Source: Bloomberg, Western Asset. As of 14 Mar 25. Yield-to-worst (YTW) is the lowest potential yield that can be received on a bond without the issuer actually defaulting. AAA, AA, A, BBB Corporate Indices; After-Tax Yield assumes a top effective tax rate of 40.8%. Taxable Muni Index Corporate comparable used is the Global Corporate Aggregate (ex. BBB) to better align credit quality and duration. Select the image to expand the view.

Western Asset Key Themes for Muni Investors

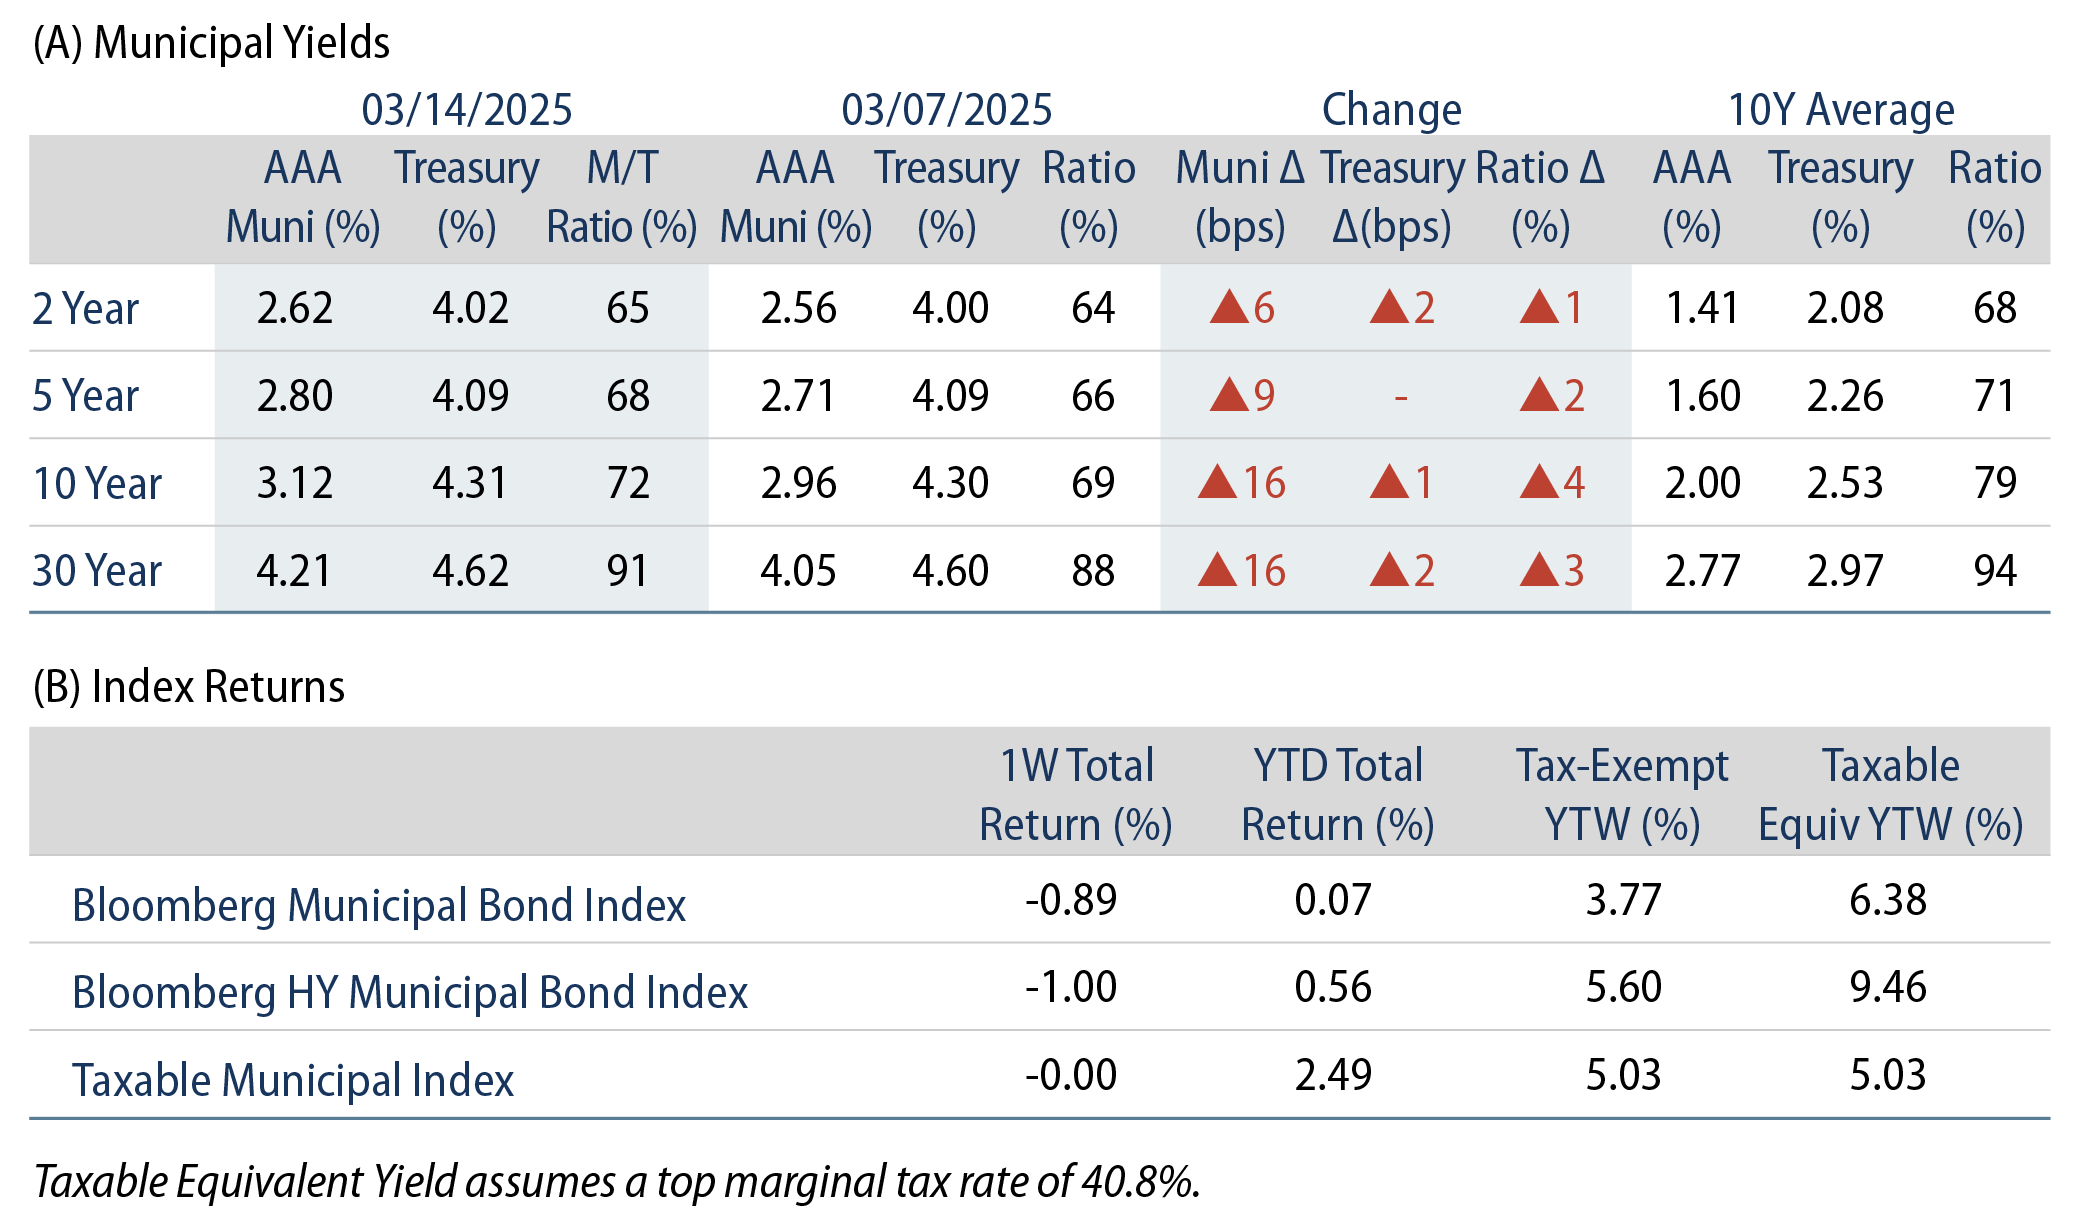
Theme #1: Municipal taxable-equivalent yields and income opportunities remain above decade averages.

Exhibit 8: Muni and Taxable-Equivalent Muni Yield-to-Worst
Muni and Taxable-Equivalent Muni Yield-to-Worst
Source: Bloomberg, Western Asset. As of As of 14 Mar 25. Bloomberg Municipal Bond Index yield considering highest marginal tax rate of 40.8%. Indexes are unmanaged and one cannot directly invest in them. They do not include fees, expenses or sales charges. Past performance is not an indicator or a guarantee of future results. Select the image to expand the view.

Theme #2: The muni curve has steepened, offering better value in intermediate and longer maturities.

Exhibit 9: AAA Municipal vs. Treasury Yield Curves
AAA Municipal vs. Treasury Yield Curves
Source: Bloomberg, Western Asset. As of 14 Mar 25. Bloomberg Valuation Service (BVAL) AAA Muni Curve and US On-/Off-the-Run Sovereign Curve. Indexes are unmanaged and one cannot directly invest in them. They do not include fees, expenses or sales charges. Past performance is not an indicator or a guarantee of future results. Select the image to expand the view.

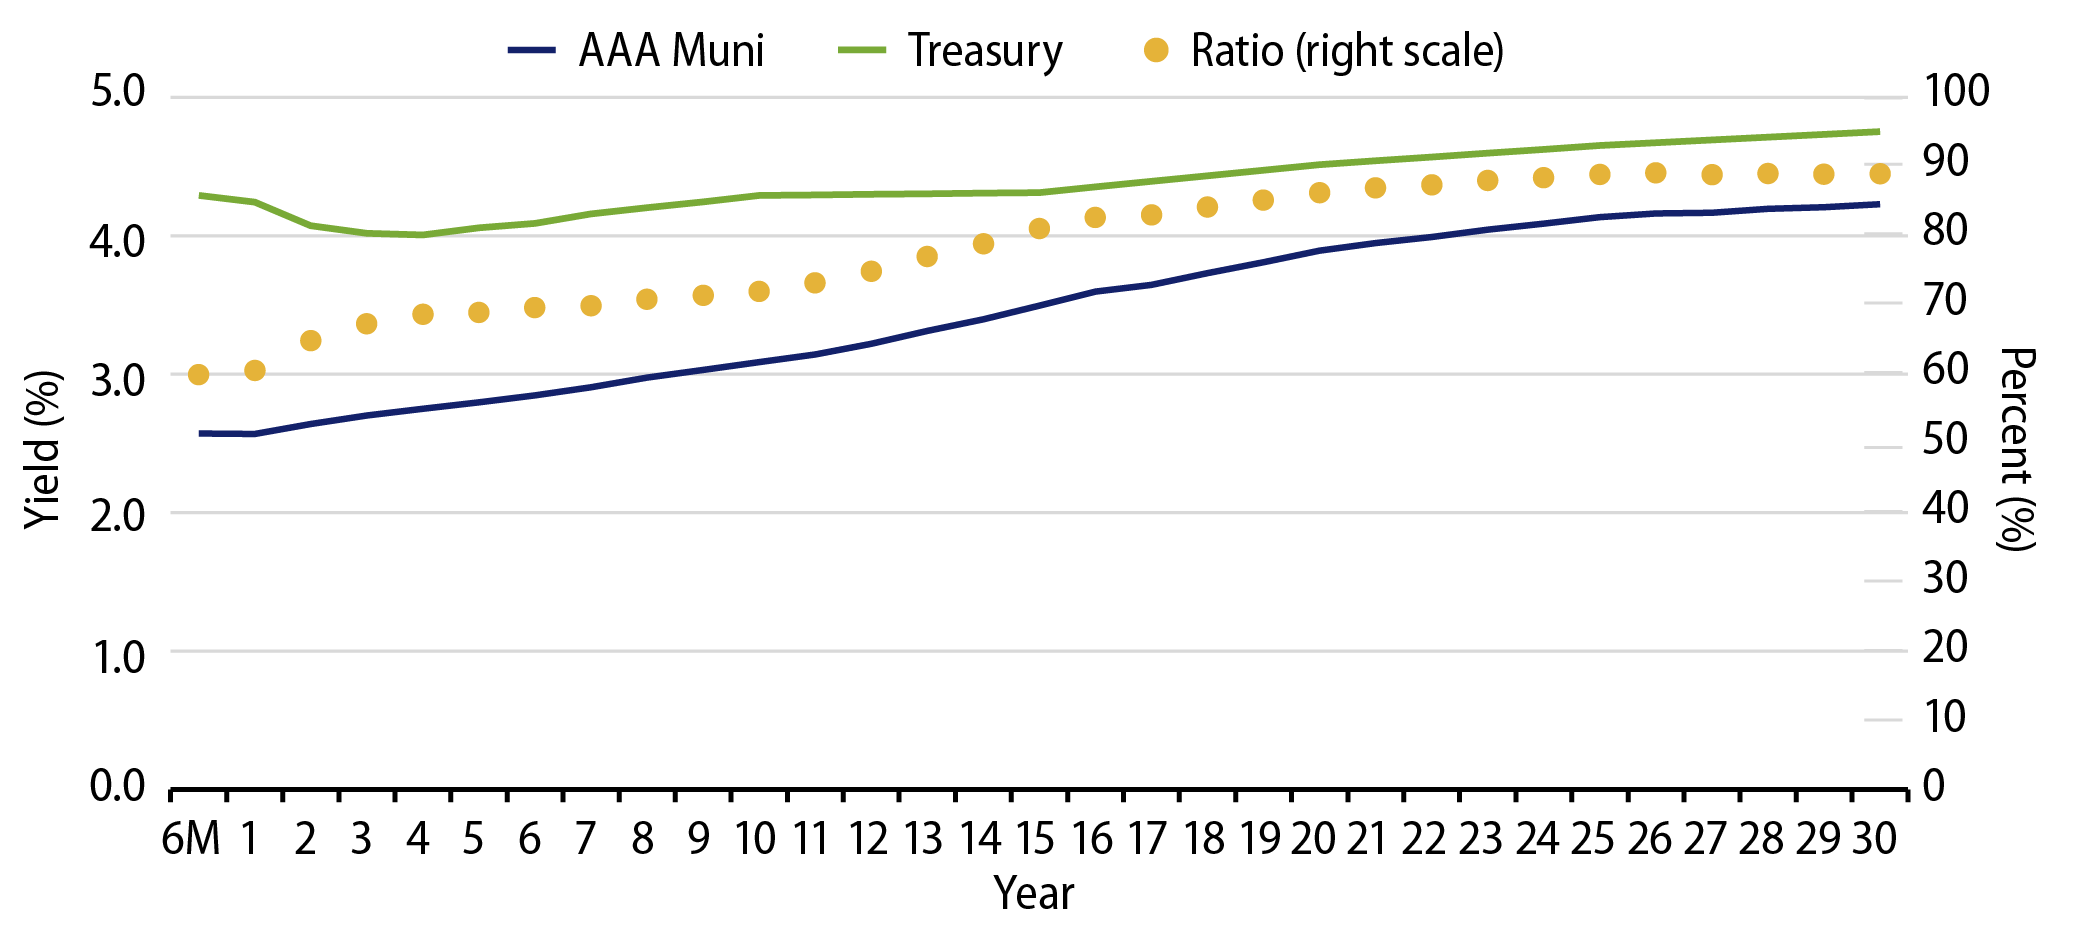
Theme #3: Munis offer attractive after-tax yield pickup versus longer-dated Treasuries and investment-grade corporate credit.

Exhibit 10: Municipal vs. Taxable Fixed-Income Yields by Quality
Municipal vs. Taxable Fixed-Income Yields by Quality
Source: Western Asset, Bloomberg. As 14 Mar 25. 10- and 30-Year comparison reflects Bloomberg Valuation Service (BVAL) AAA Muni Curve and US On-/Off-the-Run Sovereign Curve. AA Muni reflects the Bloomberg AA Muni Bond Index. A Muni reflects the Bloomberg A Muni Bond Index. BBB Muni reflects the Bloomberg BBB Muni Bond Index. HY Muni reflects the Bloomberg High Yield Muni Bond Index. AA Corp reflects the Bloomberg AA Corporate Bond Index. A Corp reflects the Bloomberg A Corporate Bond Index. BBB Corp reflects the Bloomberg BBB Corporate Bond Index. After-tax yield considers top marginal tax rate of 40.8%. Indexes are unmanaged and one cannot directly invest in them. They do not include fees, expenses or sales charges. Past performance is not an indicator or a guarantee of future results. Select the image to expand the view.

投資一任契約および金融商品に係る投資顧問料(消費税を含む):
投資一任の場合は運用財産の額に対して、年率1.1%(税抜き1.0%)を上限とする運用手数料を、運用戦略ごとに定めて おります。 また、別途運用成果に応じてお支払いいただく手数料(成功報酬)を設定する場合があります。
その料率は、運用成果の評価方法や固定報酬率の設定方法により変動しますので、手数料の金額や計算方法をこの書 面に記載することはできません。

投資信託の場合は投資信託ごとに信託報酬が定められておりますので、目論見書または投資信託約款でご確認くださ い。有価証券の売買又はデリバティブ取引の売買手数料を運用財産の中からお支払い頂きます。投資信託に投資する 場合は信託報酬、管理報酬等の手数料が必要となります。これらの手数料には多様な料率が設定されているためこの 書面に記載することはできません。デリバティブ取引を利用する場合、運用財産から委託証拠金その他の保証金を預託 する場合がありますが、デリバティブ取引の額がそれらの額を上回る可能性があります。その額や計算方法はこの書面に 記載することはできません。投資一任契約に基づき運用財産の運用を行った結果、金利、通貨の価格、金融商品市場に おける相場その他の指標に係る変動により、損失が生ずるおそれがあります。損失の額が、運用財産から預託された委 託証拠金その他の保証金の額を上回る恐れがあります。個別交渉により、一部のお客様とより低い料率で投資一任契約 を締結する場合があります。

©Western Asset Management Company Ltd 2025. 本資料の著作権は、ウエスタン・アセット・マネジメント株式会 社およびその関連会社(以下「ウエスタン・アセット」という)に帰属するものであり、意図した受取人のみを対象として 作成されたものです。本資料に記載の内容は、秘密情報及び専有情報としてお取り扱いください。ウエスタン・アセット の書面による事前の承諾なしに、全部又は一部を無断で複写、複製することや転載することを堅くお断りいたします。

過去の運用実績は将来の運用実績を示すものではありません。また、本資料は、将来の実績を予測または予想するも のではありません。

本資料は、適格機関投資家、特定投資家、企業年金基金、公的年金等、豊富な投資経験と高度な専門知識とを備えたプ ロフェッショナルのお客様のみにご提供するものです


本資料は情報の提供のみを目的としています。資料作成時点のウエスタン・アセットの見解を掲載したものであり、将来 予告なしに変更する場合があります。また、リアルタイムの市場動向や運用に関する見解ではありません。

本資料で第三者のデータが使用されている場合、ウエスタン・アセットはそのデータが公表時点で正確であると信じてい ますが、それを保証するものではありません。ウエスタン・アセットの戦略・商品の受賞またはランキングが含まれている 場合、これらは独立した第三者または業界出版物により公平な定量・定性情報に基づき決定されたものです。ウエスタ ン・アセットは、これらの第三者の標準的な業界サービスを利用したり、出版物を購読したりする場合がありますが、それ らは、すべてのアセット・マネージャーが利用可能なものであり、ランキングや受賞に影響を与えるものではありません。

本資料に記載の戦略・商品には、元本の一部または全部の損失を含む大きなリスクが伴う場合があります。また、当該 戦略や商品に投資することは大きな変動を伴なう可能性があり、投資家にはそのようなリスクを受け入れる経済力およ び意思を持つことが求められます。

特段の注記がない限り、本資料に記載の戦略のパフォーマンスはコンポジットのデータです。コンポジットではないその他 のデータについては、当戦略の運用方針に最も近いと考えられる口座を、コンポジットの代表口座として掲載しています。 つまり、代表口座は運用結果により選択されるものではありません。代表口座のポートフォリオ特性は、コンポジットやそ の他のコンポジット構成口座と異なる場合があります。これらの口座についての情報はご依頼に応じてご提供いたします。

本資料に記載している内容は、ウエスタン・アセットの投資家に対する投資助言ではありません。個別銘柄・発行体に関 する一般的または具体的に言及する内容は、例としてご提示したものであり、購入または売却を推奨するものでもありま せん。また、ウエスタン・アセットの役職員及びお客様は、本資料に記載の有価証券を保有している可能性があります。

本資料は、会計、法務、税務、投資またはその他の助言の提供を意図したものではなく、またそれらに依存すべきでは ありません。お客様は、ウエスタン・アセットが提供する戦略・商品への投資を行うにあたり、経済的リスクやメリットな どについて助言が必要である場合は、ご自身の弁護士、会計士、投資家、税理士、その他のアドバイザーに相談して下さ い。お客様は、居住国で適用される法令を遵守する責任を負います。

ウエスタン・アセットは世界有数の運用専門会社です。1971年の設立以来、債券運用に特化したアクティブ運用機関として 最大規模の運用資産と運用チームを有しています。拠点は米国カリフォルニア州パサデナ、ニューヨーク、英国ロンドン、 シンガポール、東京、豪メルボルン、ブラジル・サンパウロ、香港、スイス・チューリッヒにあり、フランクリン・リソーシズInc の完全子会社ですが、経営全般に独立性を保っており、次の6法人で構成されています。米国:ウエスタン・アセット・マネ ジメント・カンパニーLLC(米証券取引委員会(SEC)登録の投資顧問会社)。ブラジル・サンパウロ:ウエスタン・アセット・ マネジメント・カンパニーDTVM Limitada(ブラジル証券取引委員会とブラジル中央銀行が認可・規制)。メルボルン:ウ エスタン・アセット・マネジメント・カンパニーPty Ltd(事業者番号ABN 41 117 767 923、AFSライセンス303160)。シンガ ポール:ウエスタン・アセット・マネジメント・カンパニーPte. Ltd(. CMSライセンスCo. Reg. No. 200007692R、シンガポール 通貨監督庁が監督)。日本:ウエスタン・アセット・マネジメント株式会社(金融商品取引業者、金融庁が規制)。英国:ウ エスタン・アセット・マネジメント・カンパニーLimited(英金融行動監視機構(FCA)が認可(FRN145930)、規制)。本資料 は英国ではFCAが定義する「プロフェッショナルな顧客」のみを対象とした宣伝目的に使用されます。許可された欧州経 済領域 (EEA)加盟国へ配信する場合もあります。最新の承認済みEEA加盟国のリストは、ウエスタン・アセット(電話:+44 (0)20 7422 3000)までお問い合わせください。詳細は当社ウエブサイトwww.westernasset.co .jpをご参照ください。
ウエスタン・アセット・マネジメント株式会社について
業務の種類: 金融商品取引業者(投資運用業、投資助言・代理業、第二種金融商品取引業)
登録番号: 関東財務局長(金商)第427号
加入協会: 一般社団法人日本投資顧問業協会(会員番号 011-01319)
一般社団法人投資信託協会