
Municipals Posted Positive Returns Last Week
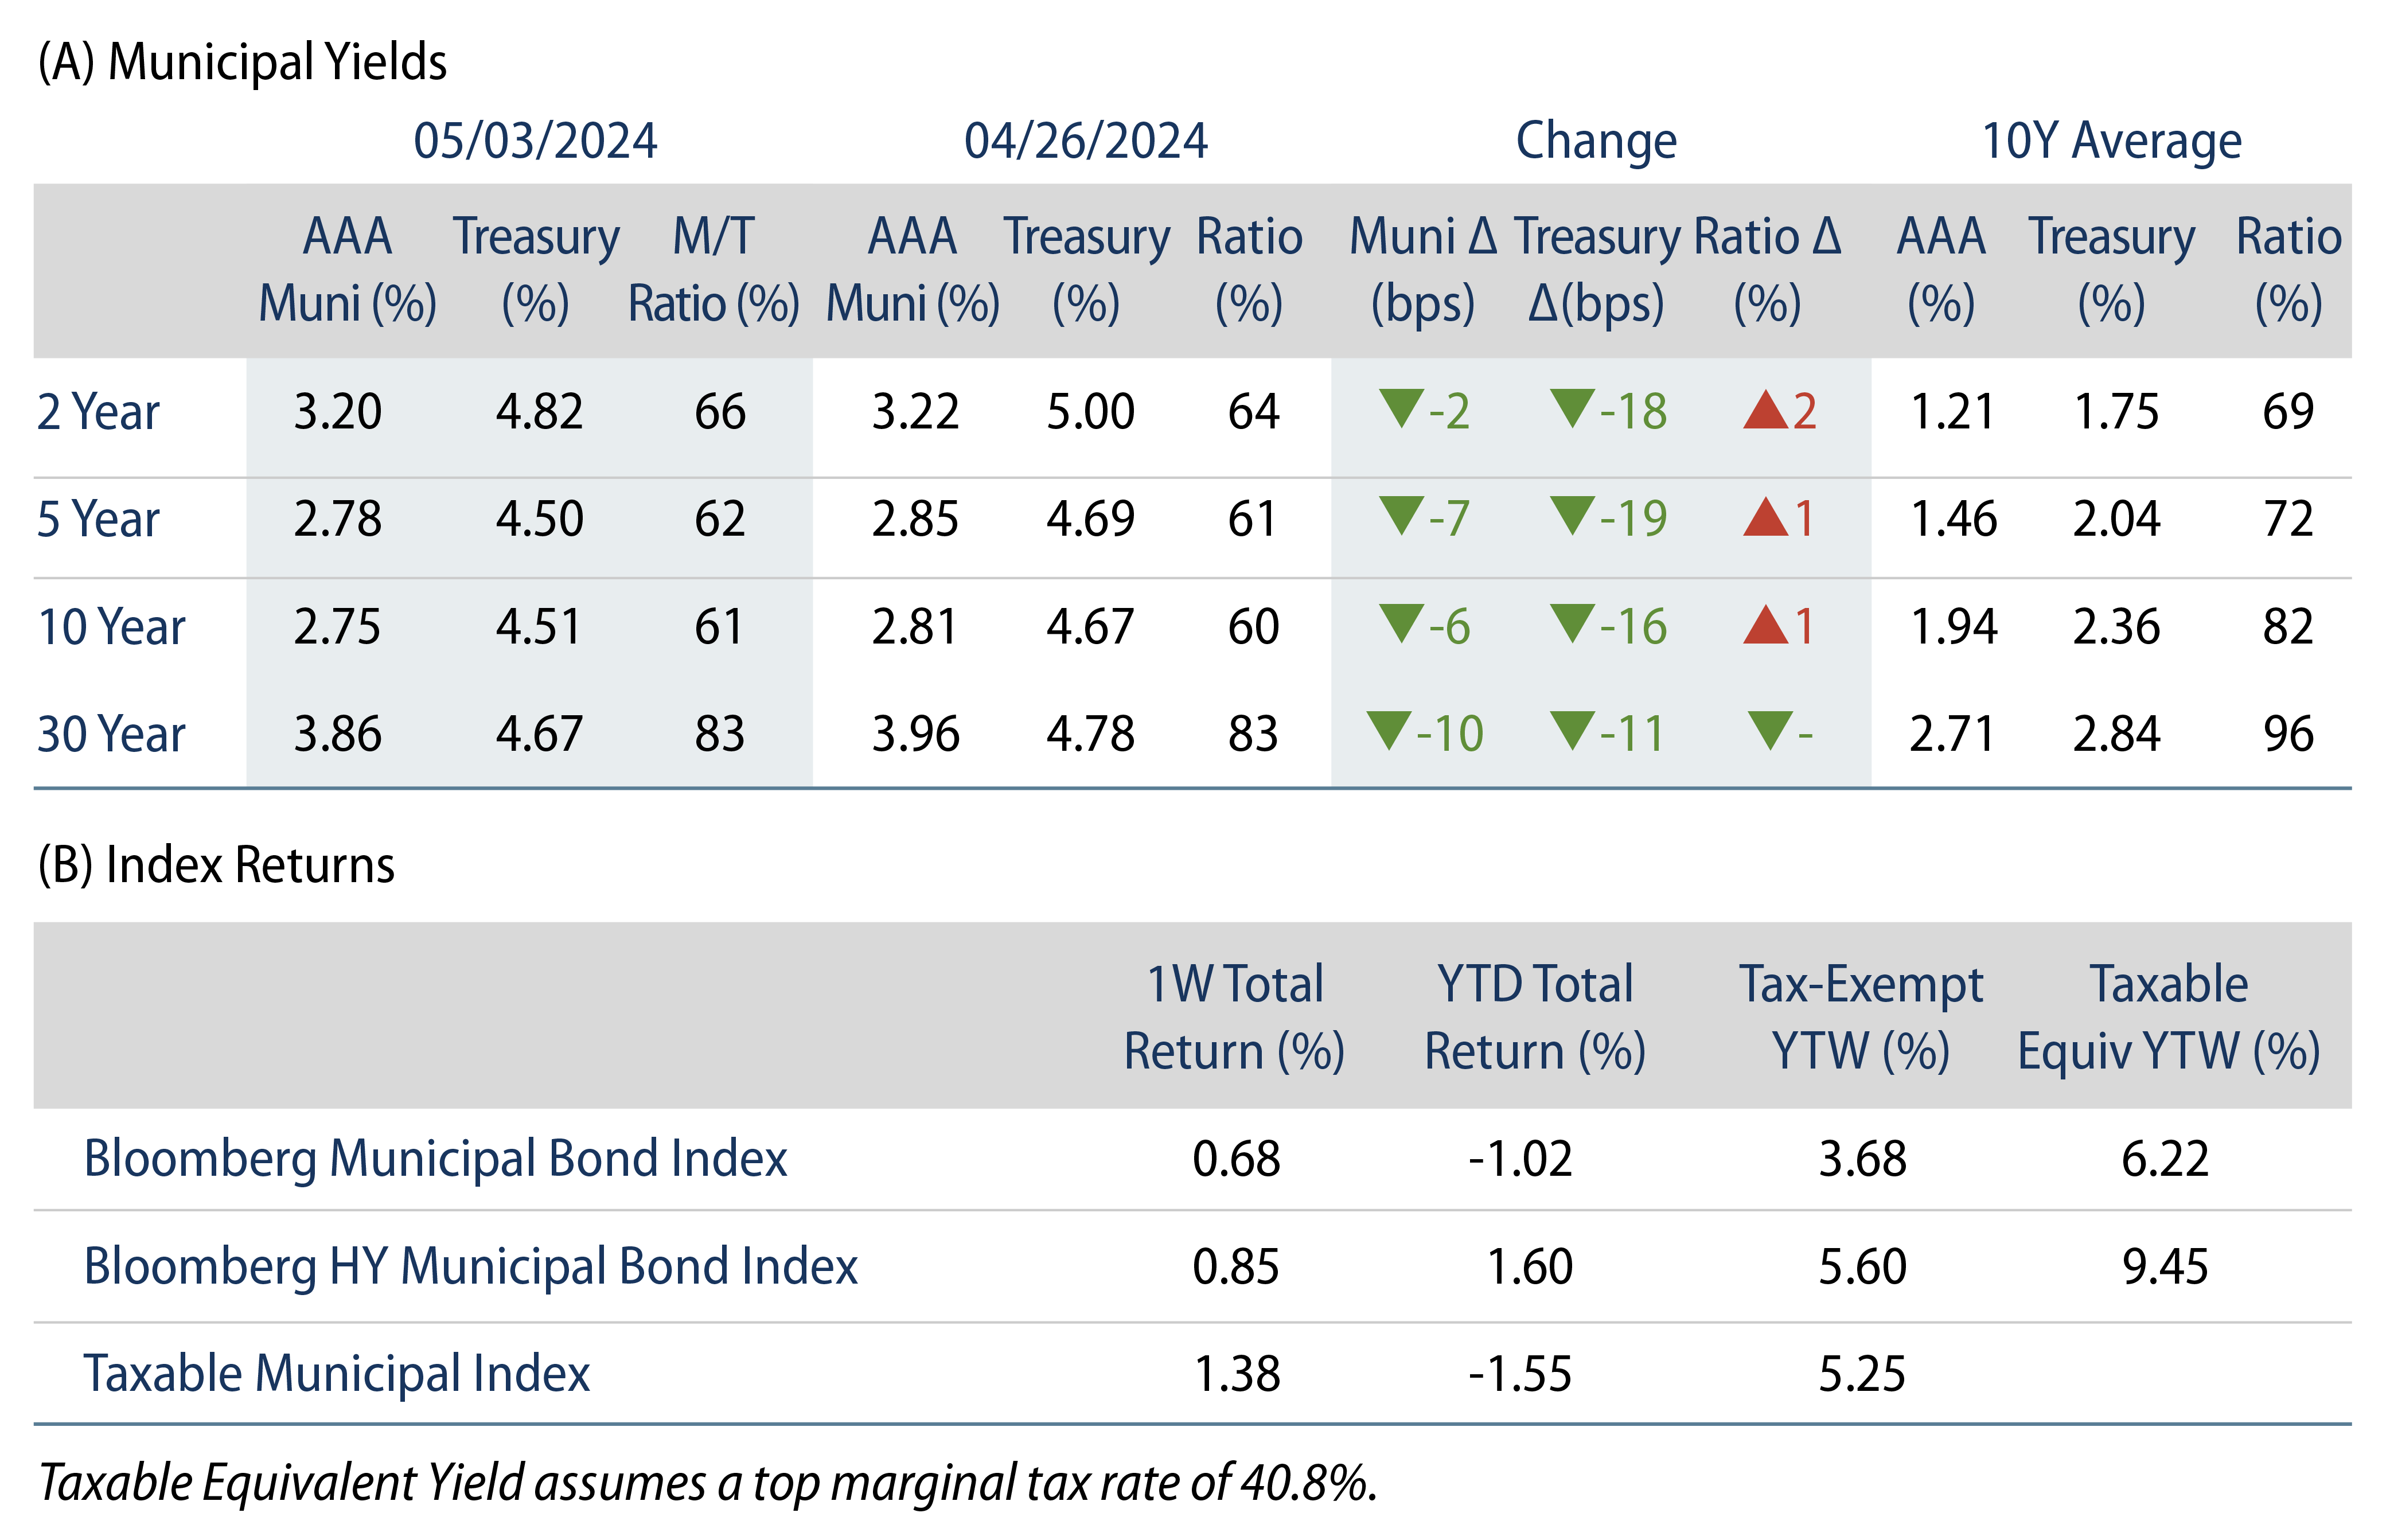
Top-grade munis posted positive returns yet underperformed Treasuries last week, which moved lower on weaker-than-expected payroll data. Meanwhile, market technicals improved on fund inflows and lower supply conditions. The Bloomberg Municipal Index returned 0.68% during the week, the High Yield Muni Index returned 0.85% and the Taxable Muni Index returned 1.38%. This week we highlight drivers of challenged muni performance during the month of April.
Technicals Improved on Fund Inflows, Lower Supply Conditions
Fund Flows: During the week ending May 1, weekly reporting municipal mutual funds recorded $515 million of net inflows, according to Lipper. Long-term funds recorded $456 million of inflows, intermediate funds recorded $31 million of inflows and high-yield funds recorded $193 million of inflows. Short-term funds recorded $12 million of inflows. This week’s inflows lead estimated year-to-date (YTD) net inflows higher to $9.6 billion.
Supply: The muni market recorded $7 billion of new-issue volume last week, down 52% from the prior week. YTD issuance of $146 billion is 37% higher than last year’s level, with tax-exempt issuance 45% higher and taxable issuance 24% lower year-over-year (YoY). This week’s calendar is expected to jump to $12 billion. Largest deals include $1.8 billion State of Illinois and $947 million University of Chicago transactions.
This Week in Munis: Spring Slump
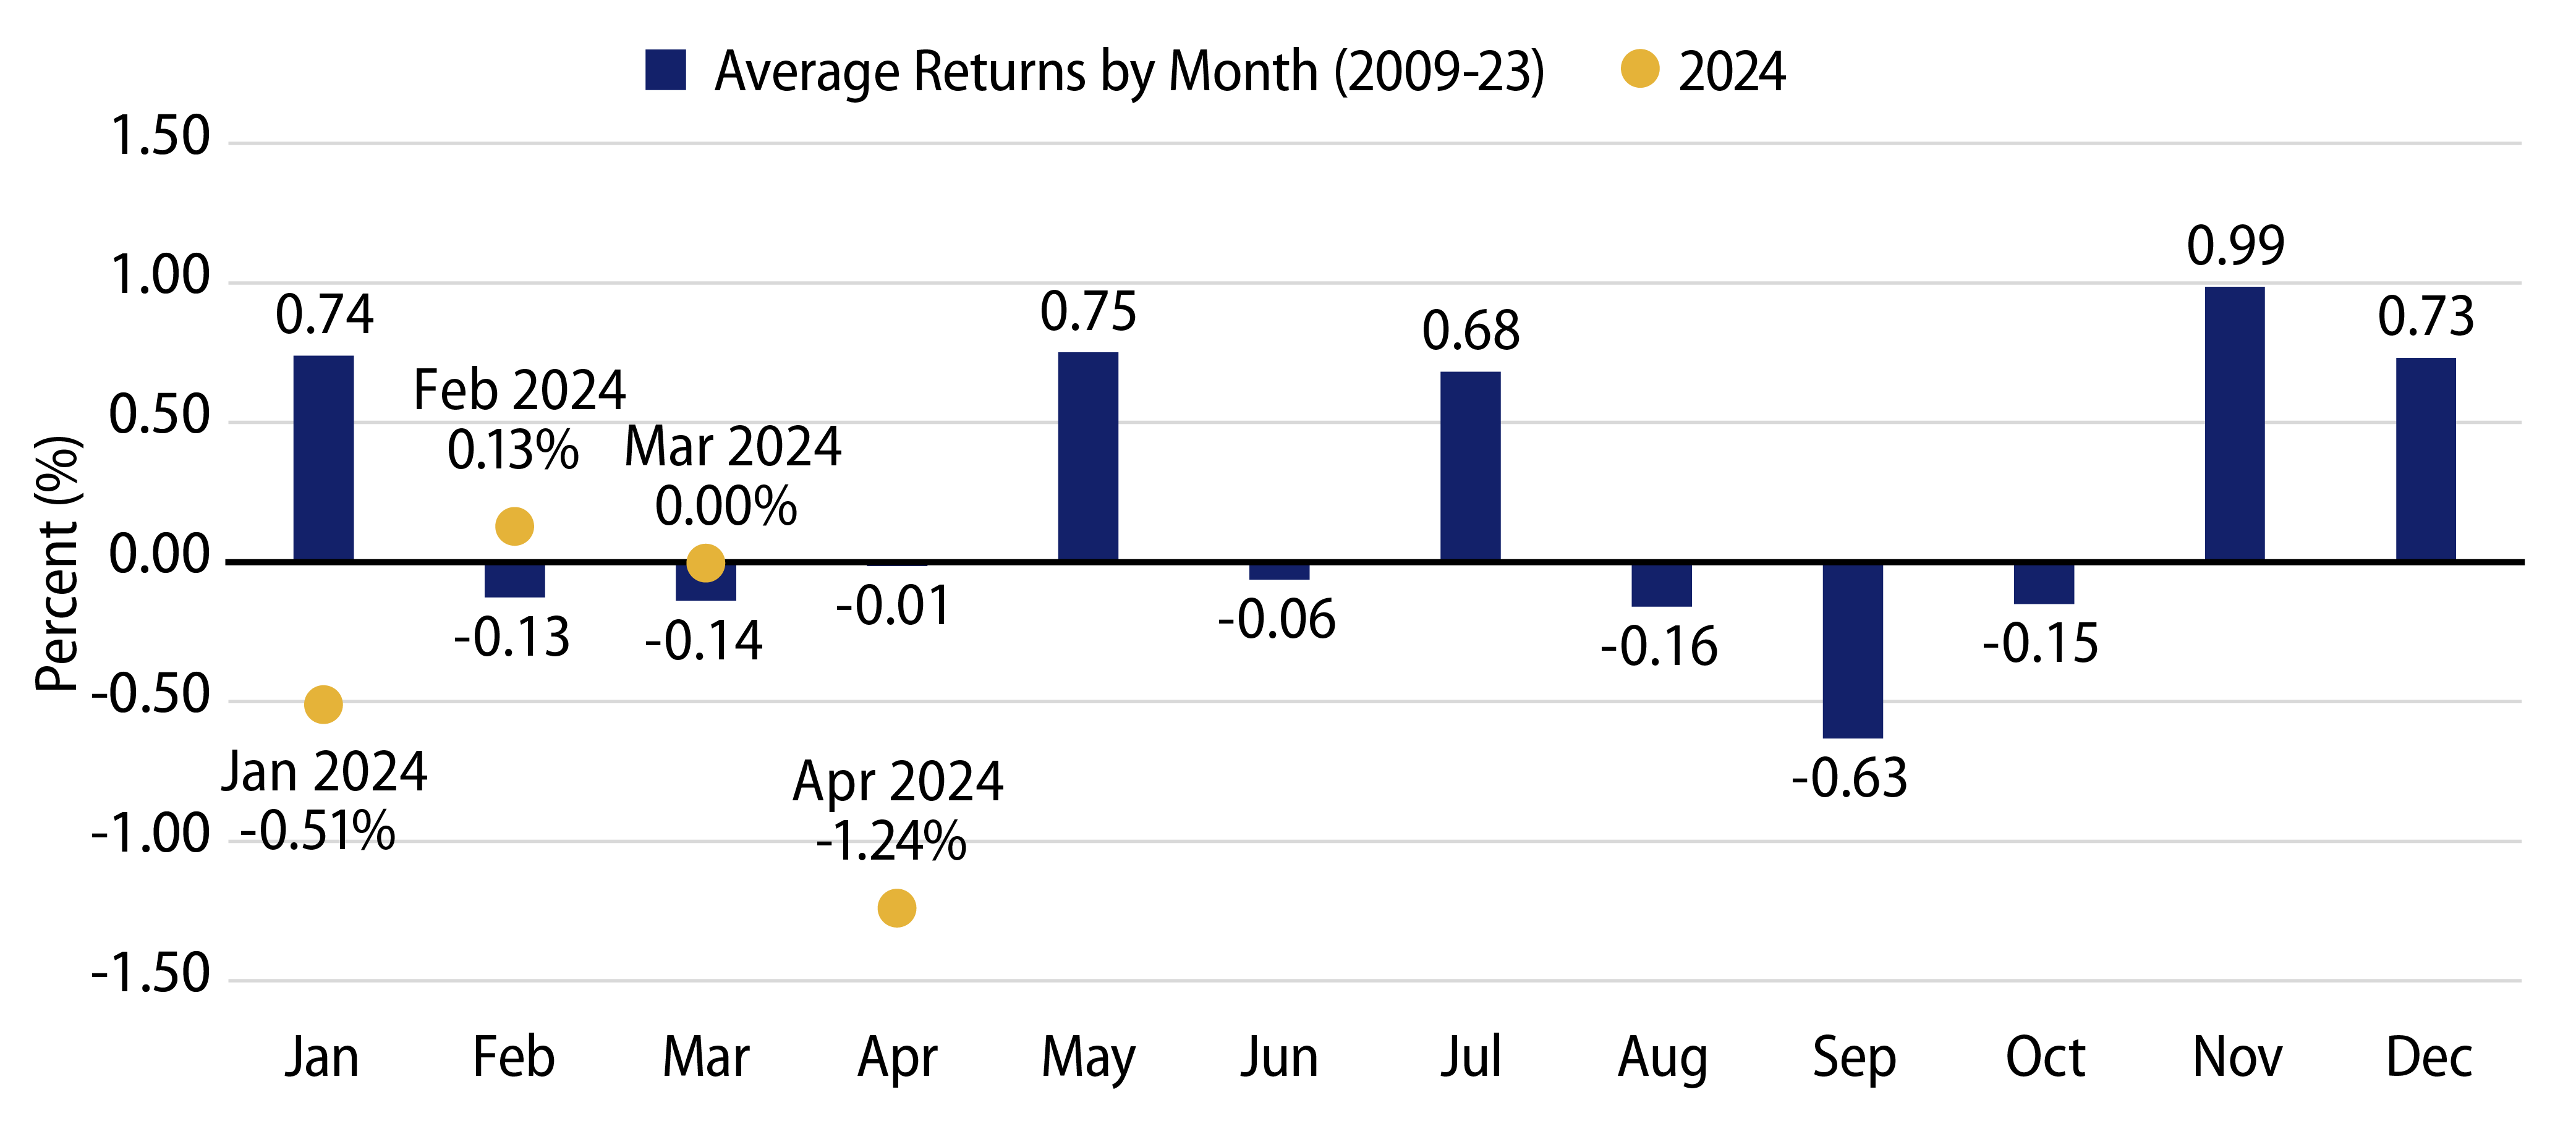
The municipal market posted negative returns in April as the Bloomberg Municipal Bond Index returned -1.24% for the month, which brought the YTD total return down to -1.62%. Higher-quality and shorter-maturity bonds generally outperformed during the month, while longer-duration maturities experienced the most weakness. AAA rated muni yields1 moved 25-31 bps higher in 2- to 30-year maturities, in sympathy with Treasuries which increased due to stronger-than-anticipated inflation and labor data.
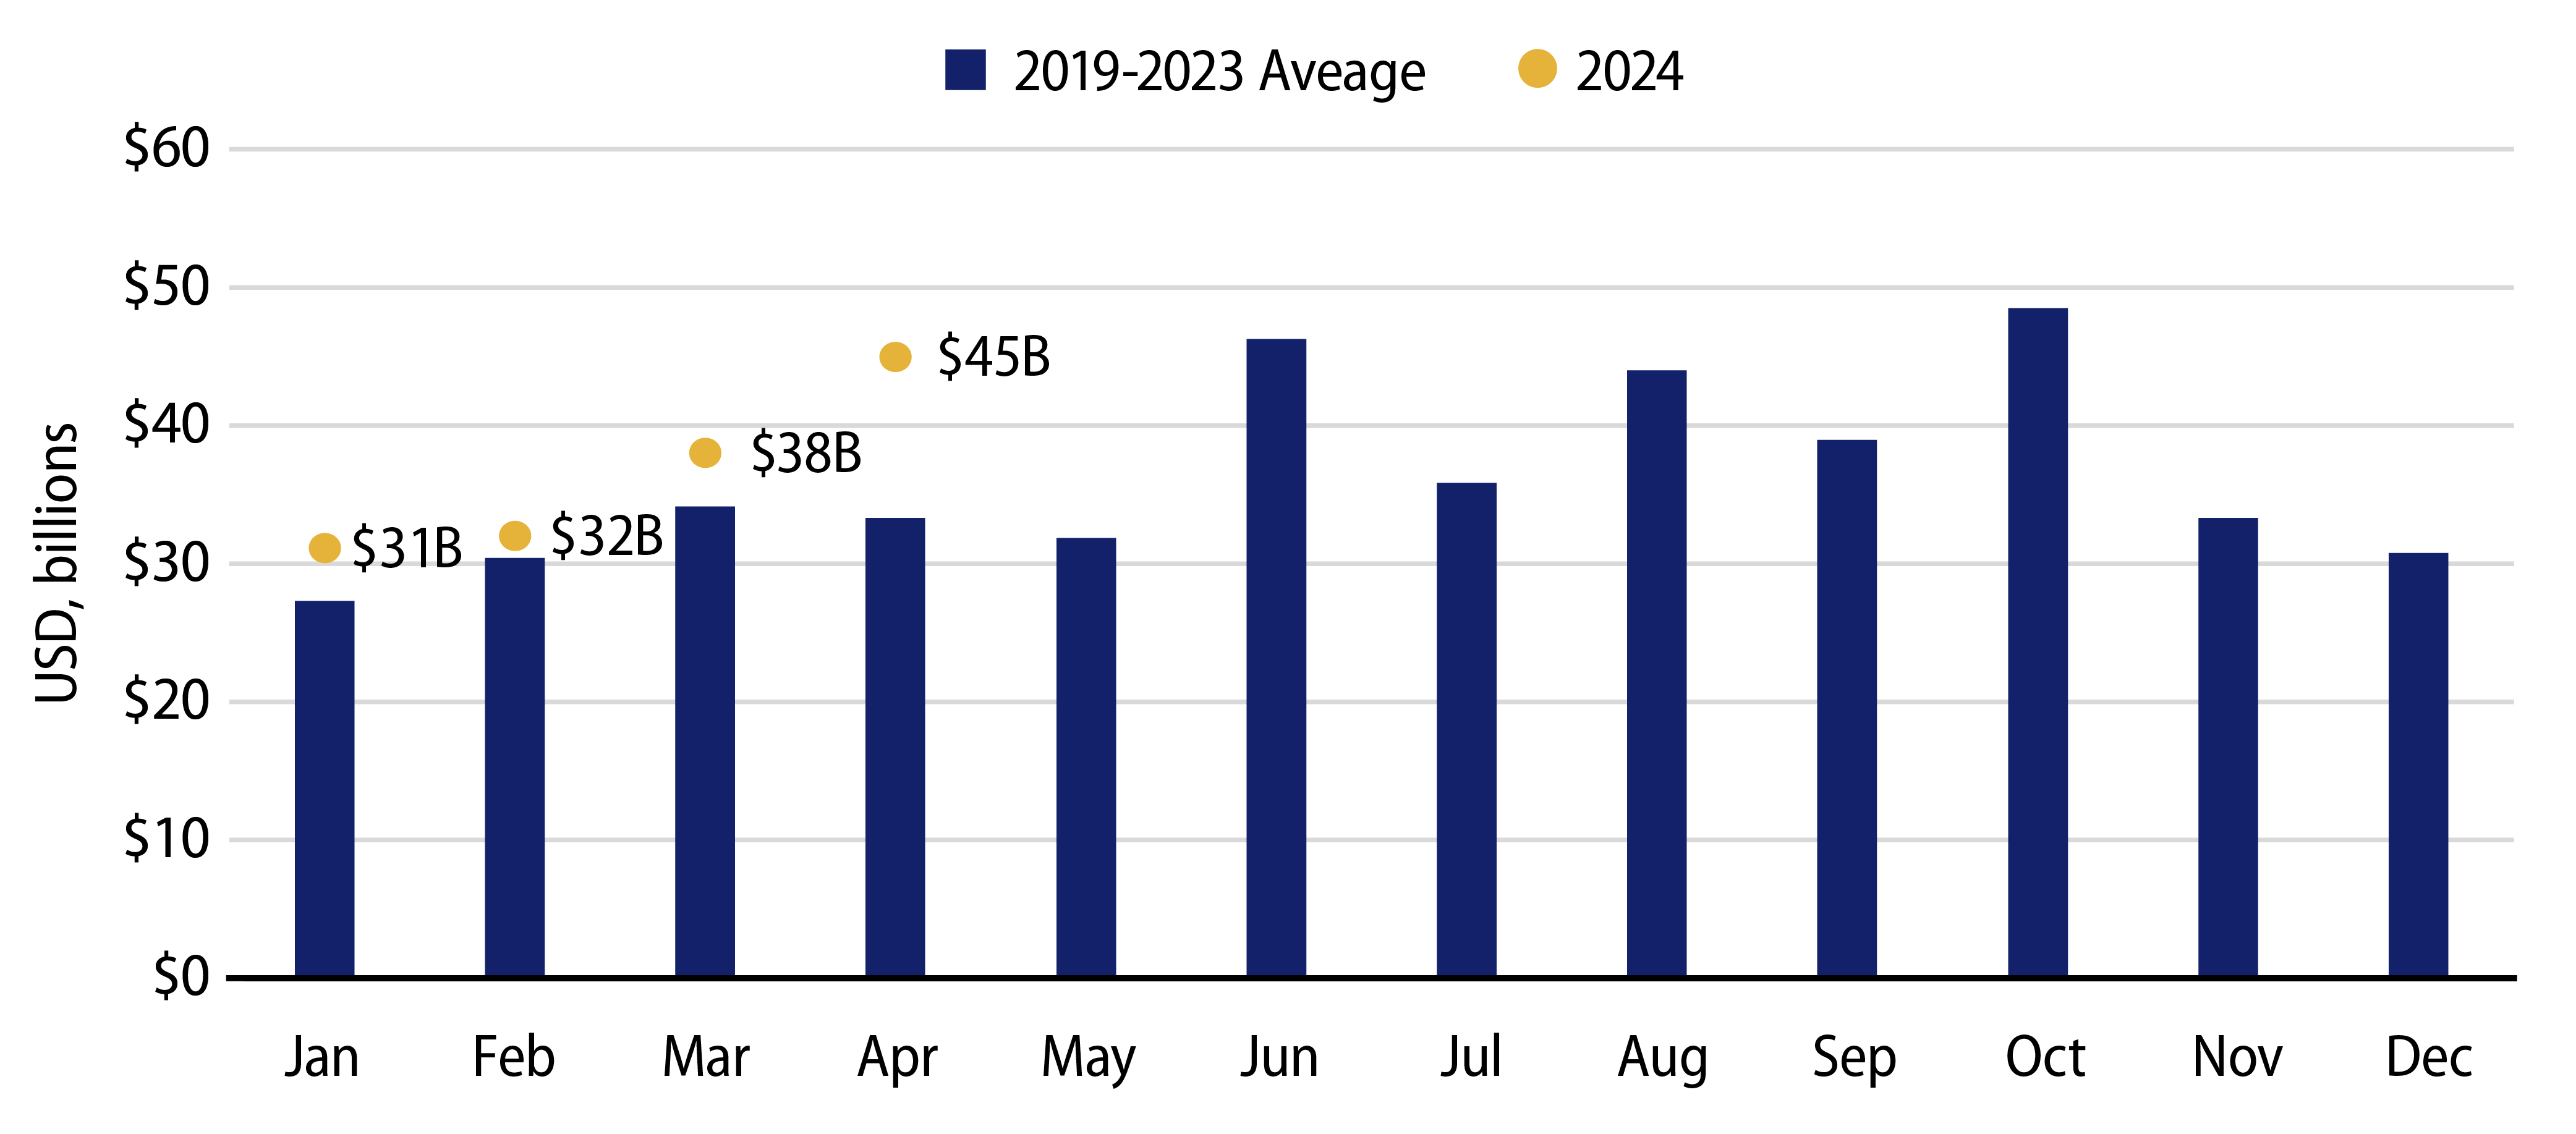
Municipal supply and demand technicals were relatively weak and contributed to the negative tone in April. Total municipal issuance reached $45 billion during the month, 18% higher than March levels and 30% higher than April 2023. YTD new-issue supply of $146 billion was 34% higher YoY, with tax-exempt issuance rising by 44% and taxable issuance falling by 23%. Tax-exempt issuance has comprised 91% of YTD issuance, and has been bolstered by the refunding of taxable debt into the tax-exempt market.
Municipal demand was fairly muted in April, as Lipper reported a modest $8 million of net outflows, with Long-Term and High-Yield funds recording inflows, while Short and Intermediate categories experiencing outflows. Municipal mutual funds have recorded $9.6 billion of inflows YTD.
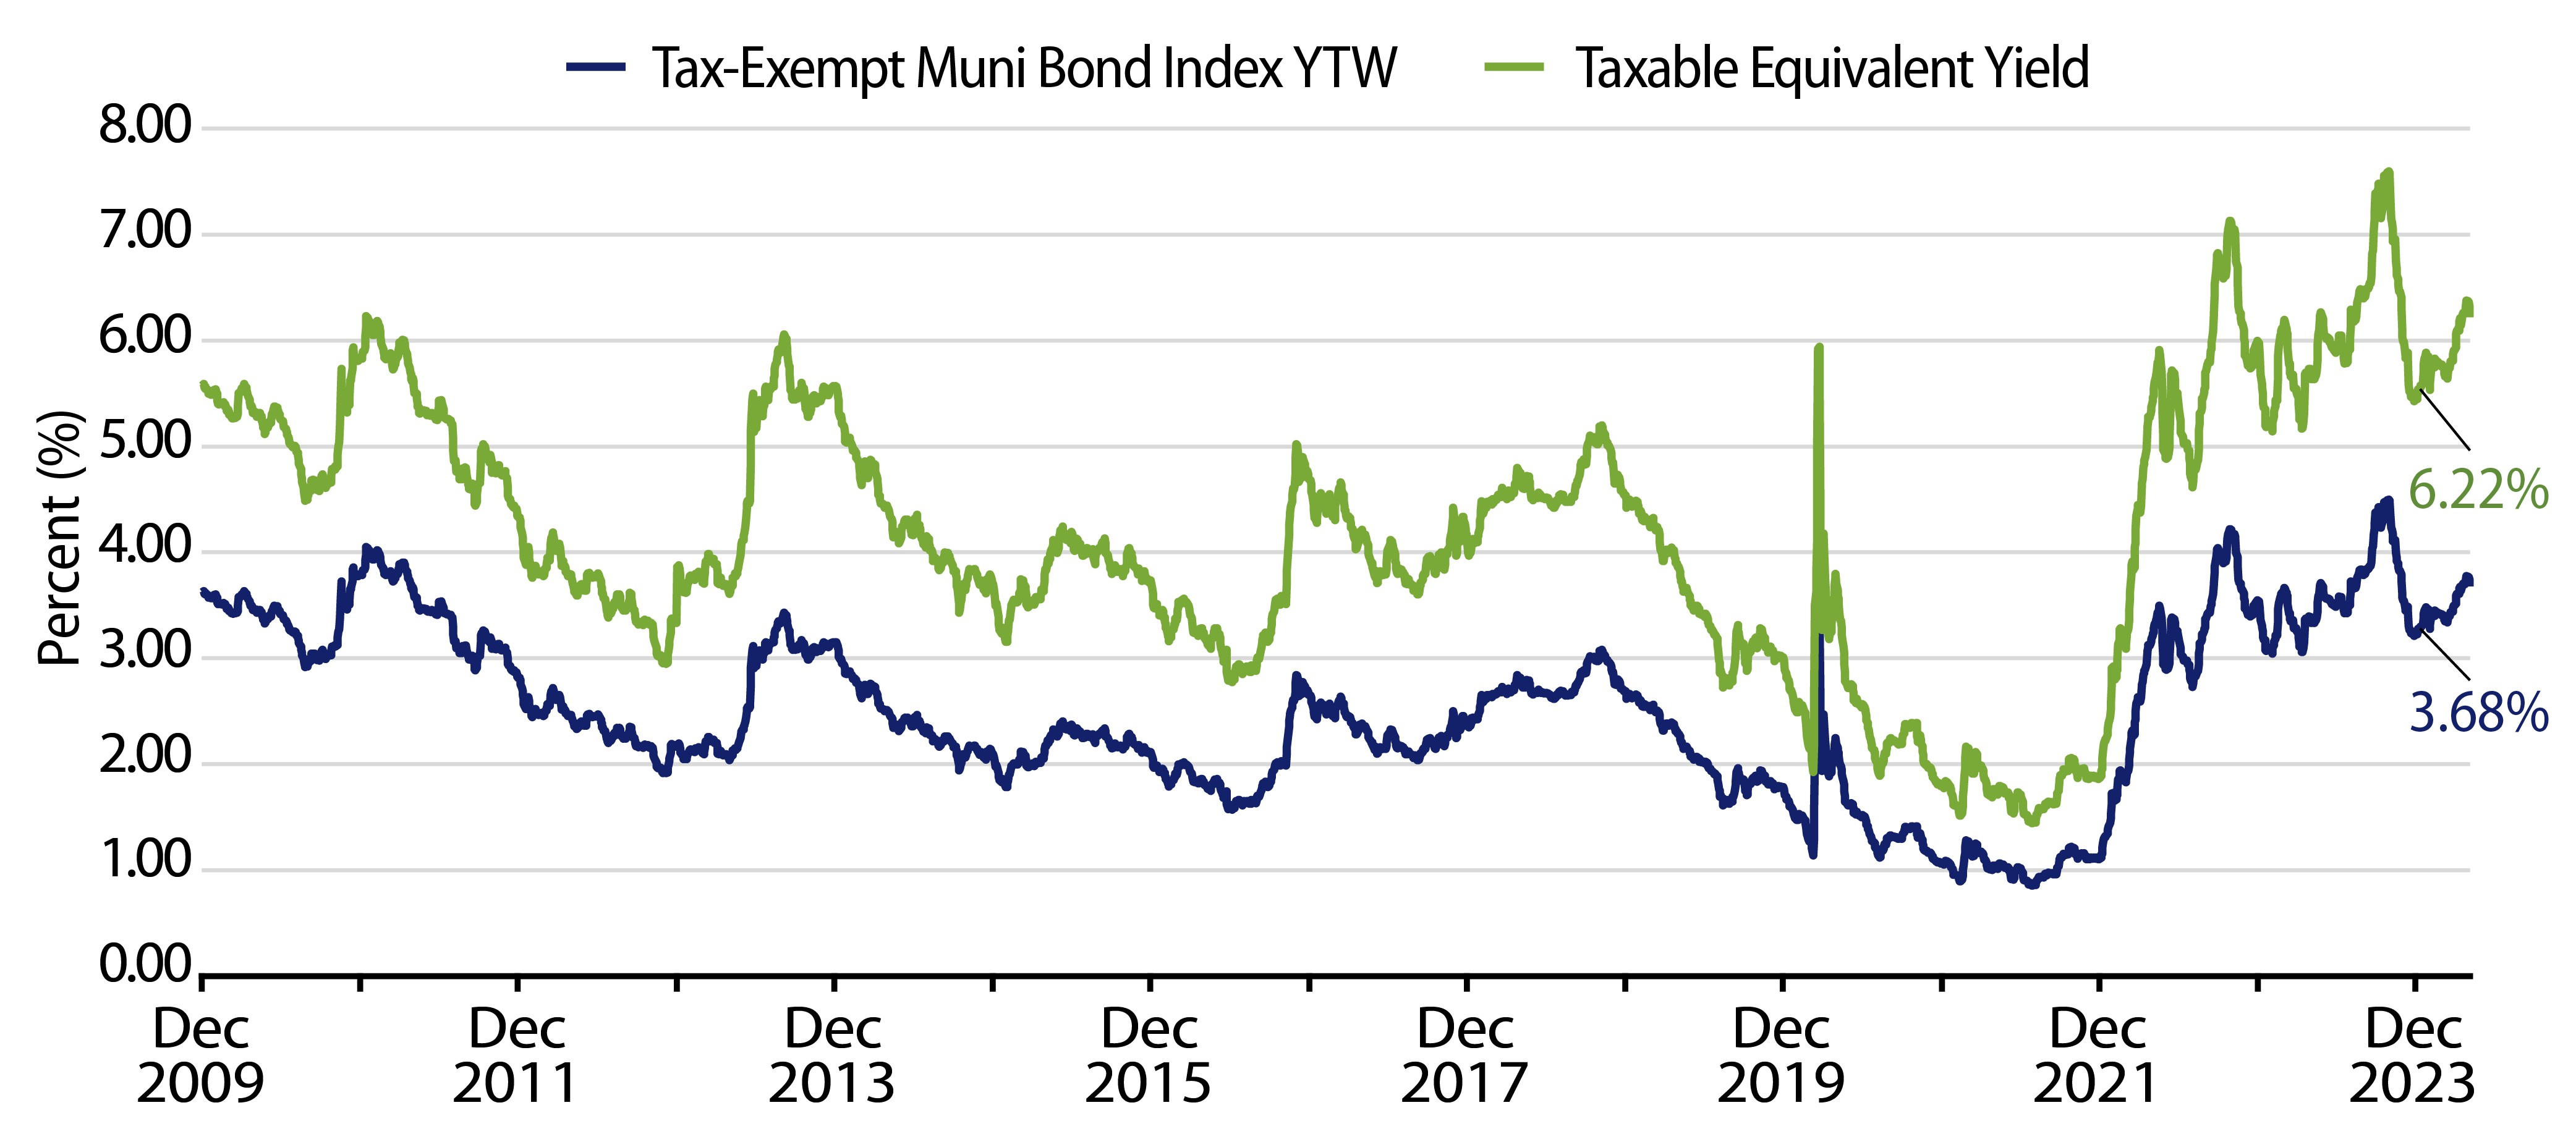
The seasonally negative spring performance has contributed to relatively higher municipal yields and tax-exempt income opportunities. The average yield-to-worst of the Bloomberg Municipal Index has increased by 0.55% YTD, reaching 3.77%, equivalent to 6.37% on a taxable-equivalent basis for an investor in the highest marginal tax bracket. However, Western Asset considers the relative valuations within the municipal index to be bifurcated. Strong recent demand for high-grade SMA products has led to relatively tight valuations in the highest-quality segment of the municipal market, while lower investment-grade credits present more attractive after-tax valuations compared to corporate bonds.
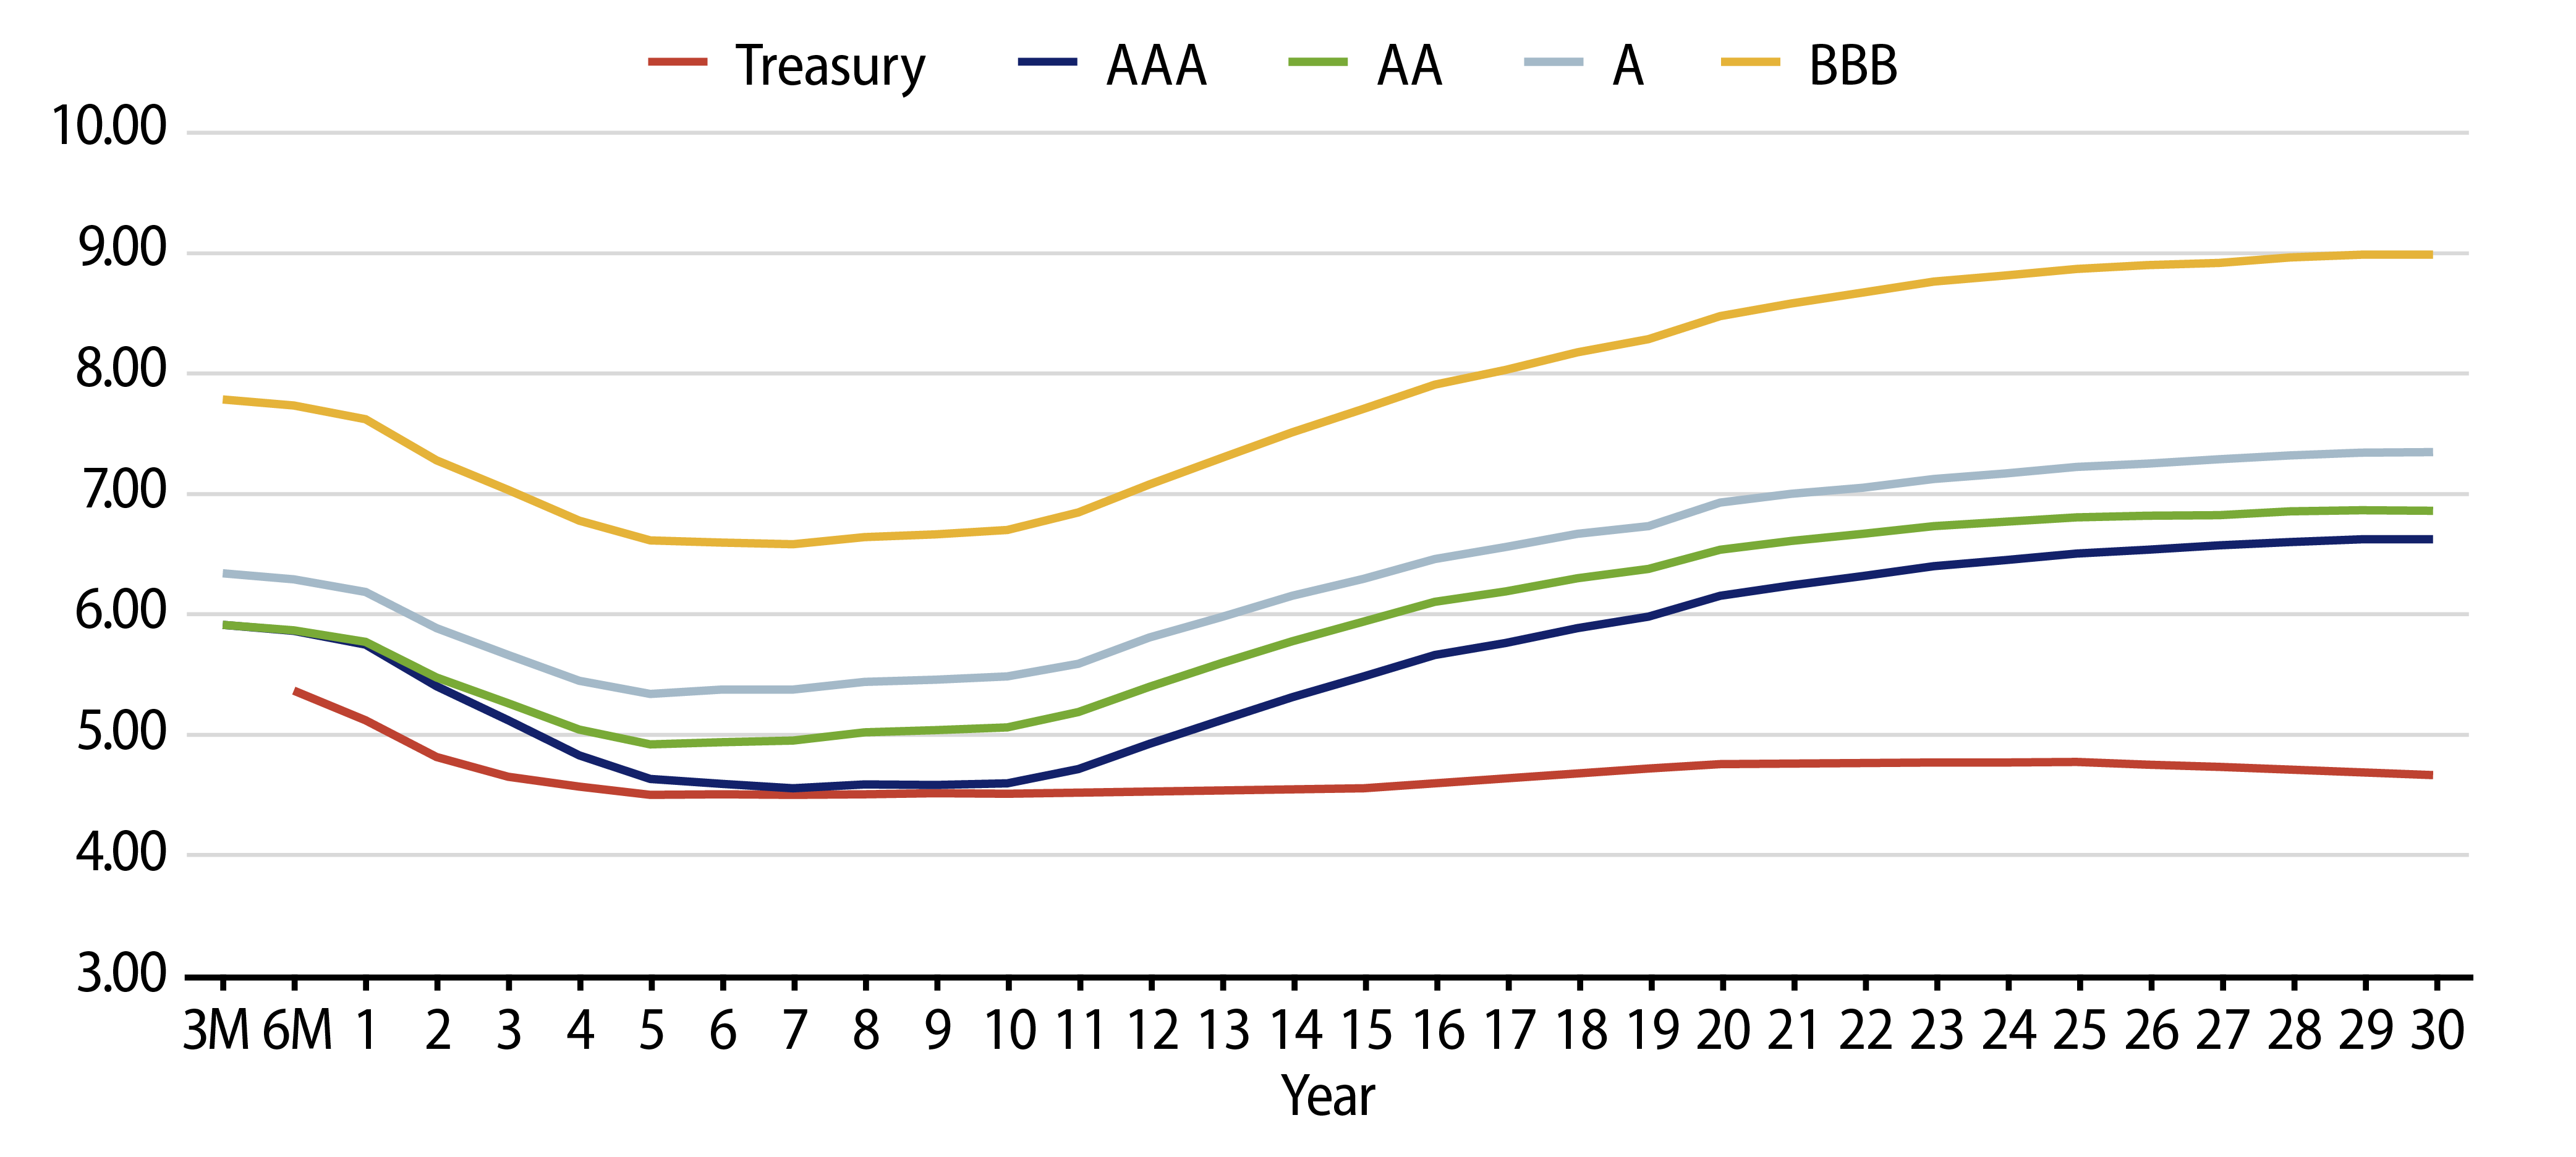
Municipal Credit Curves and Relative Value
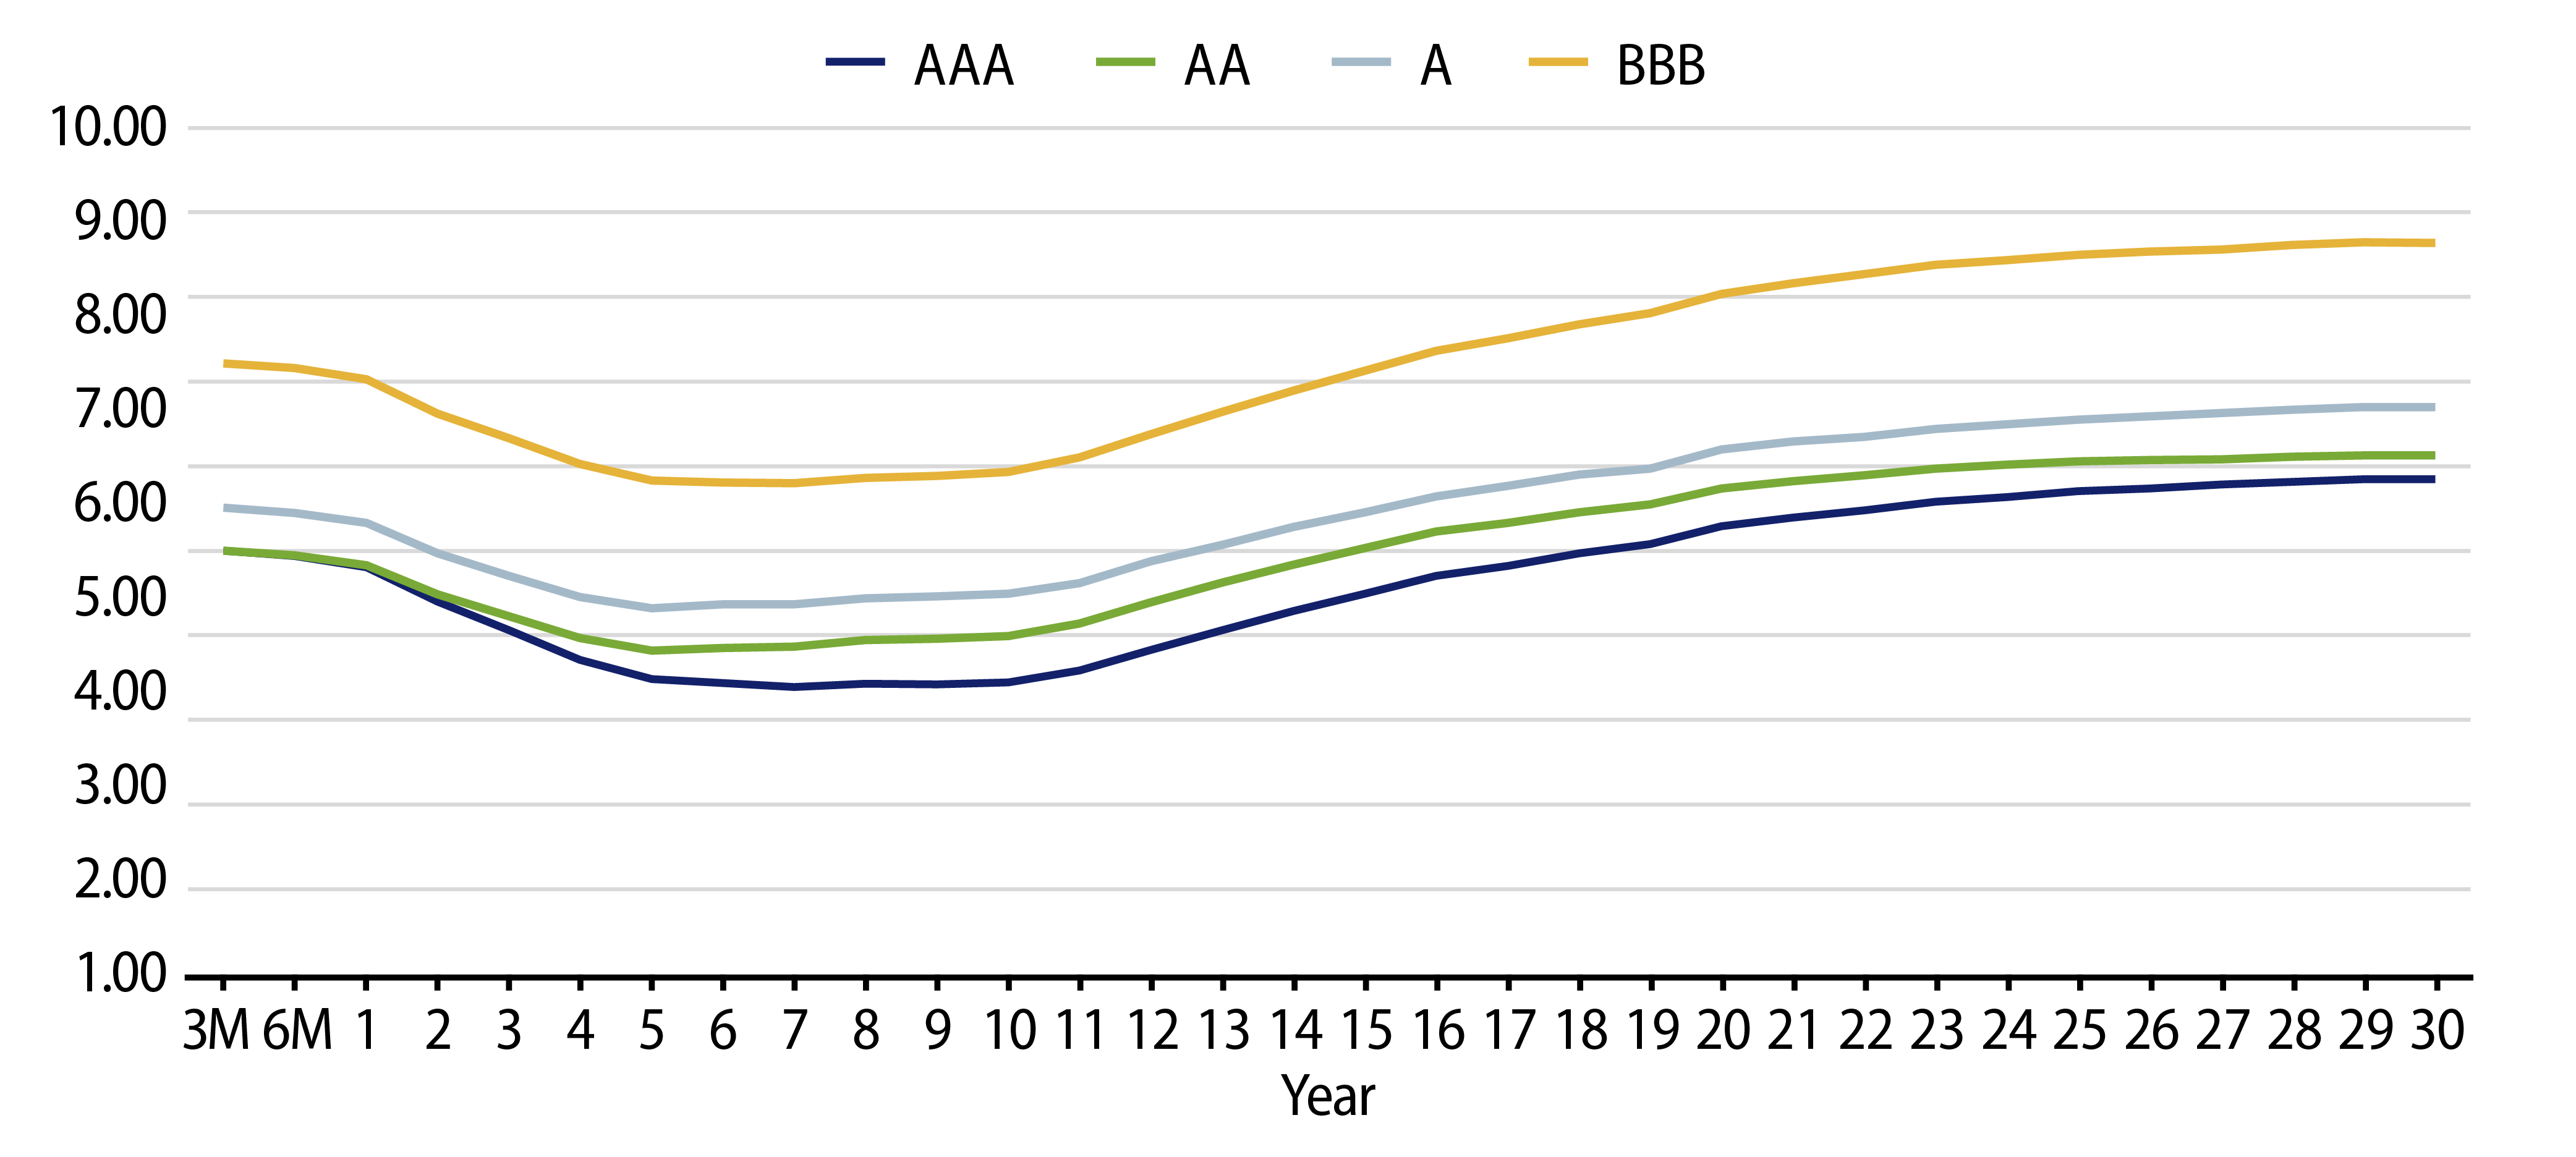
Theme #1: Municipal taxable-equivalent yields are above decade averages.
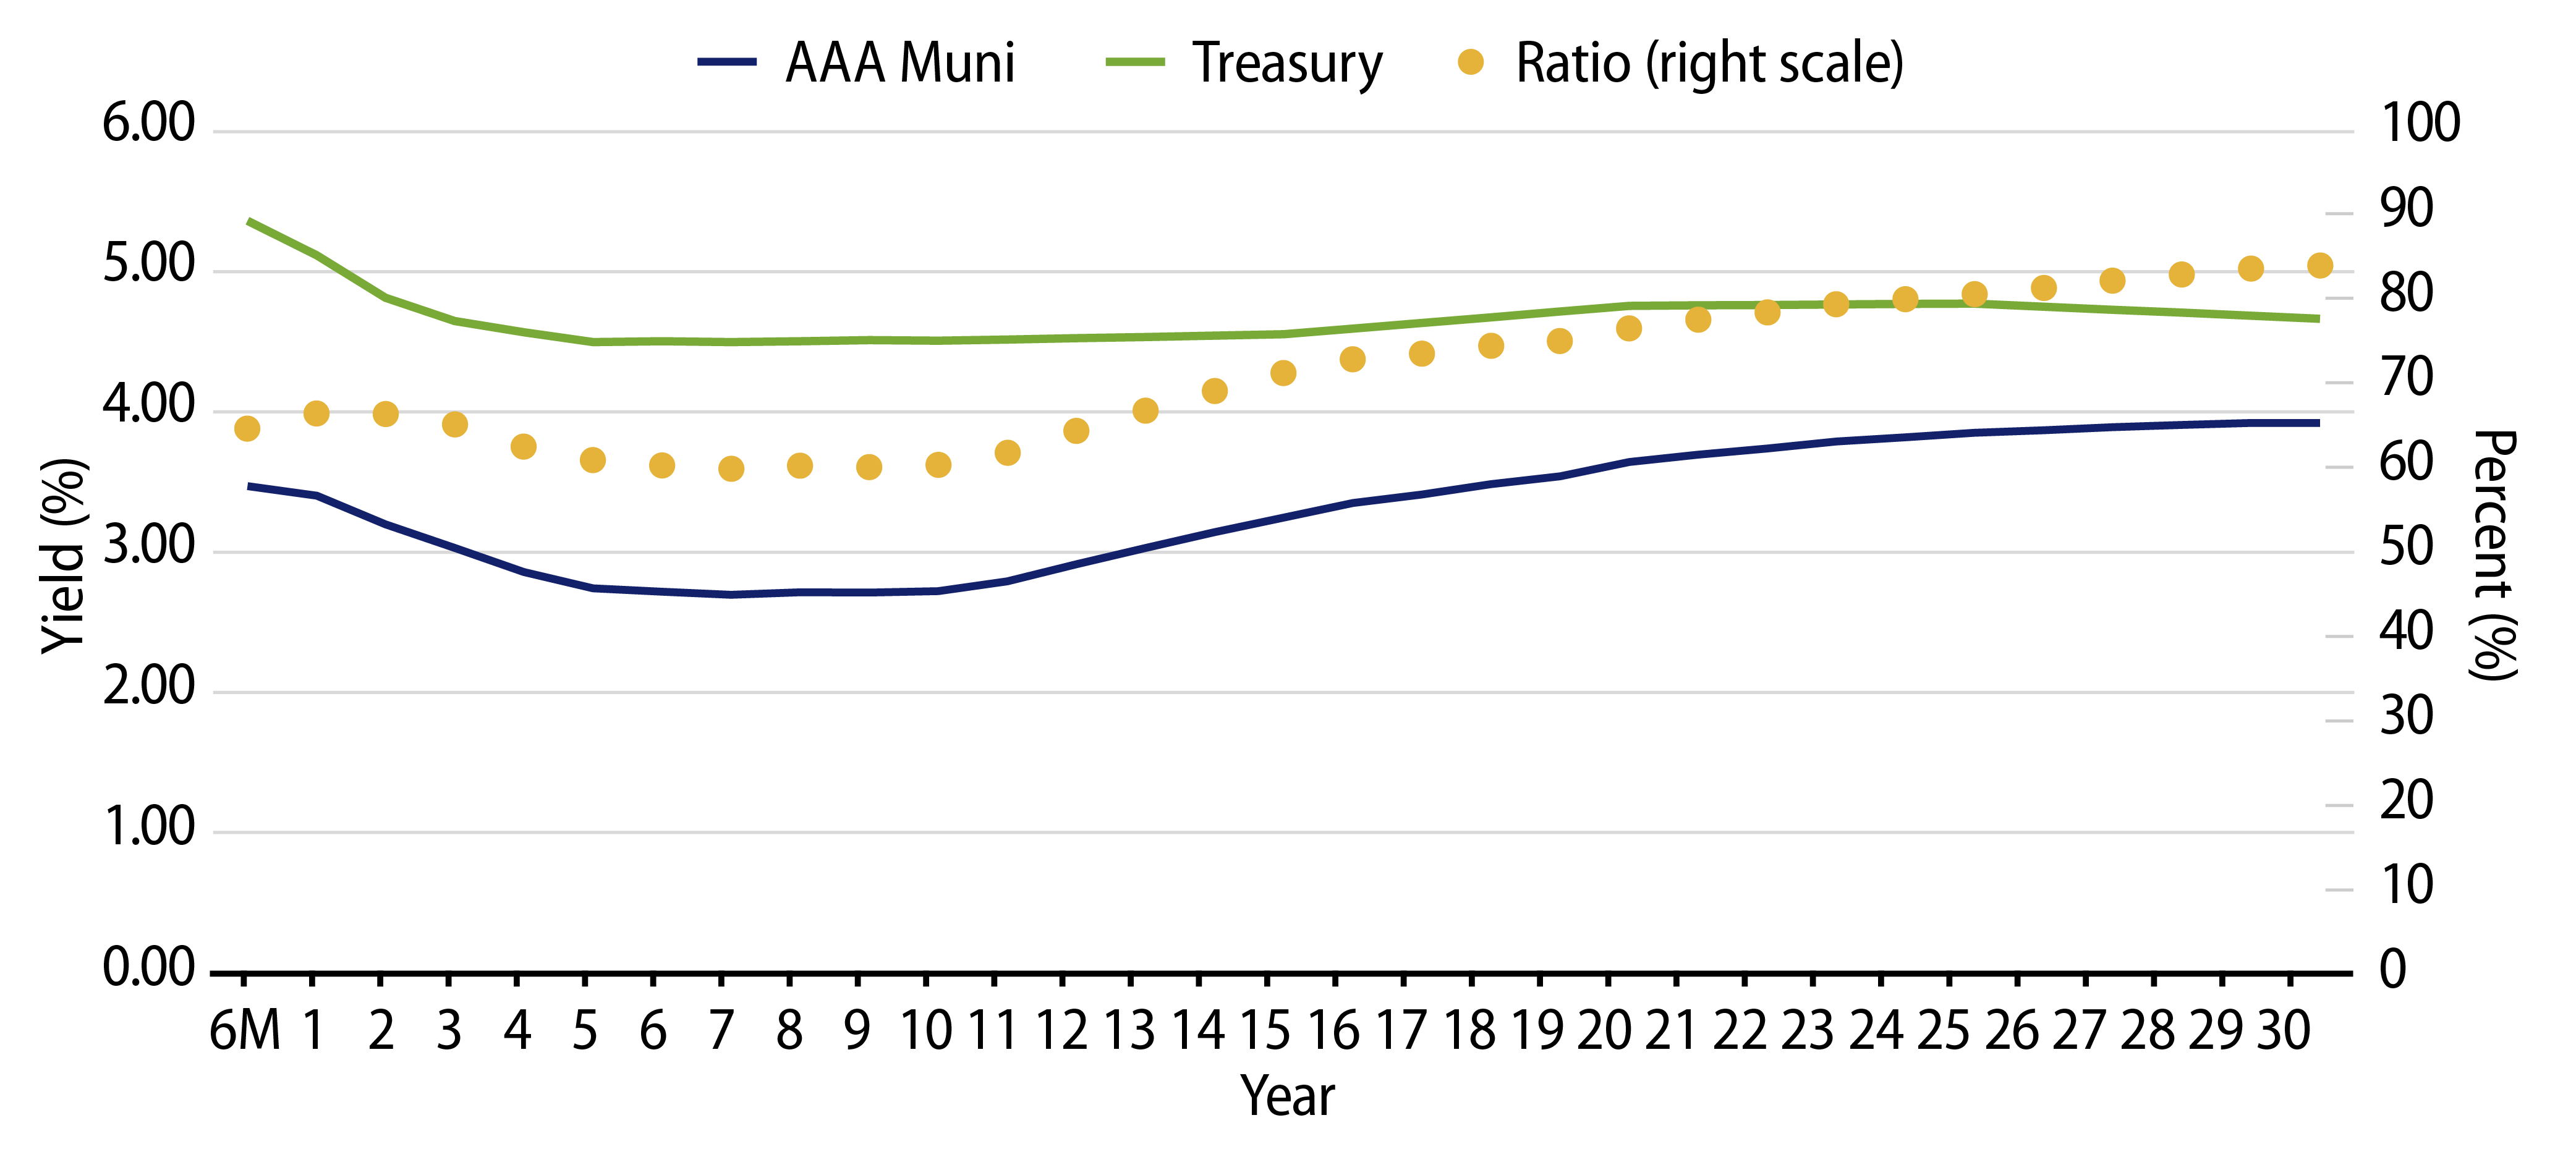
Theme #2: The inverted yield curve suggests less relative value in 5- and 10-year maturities.
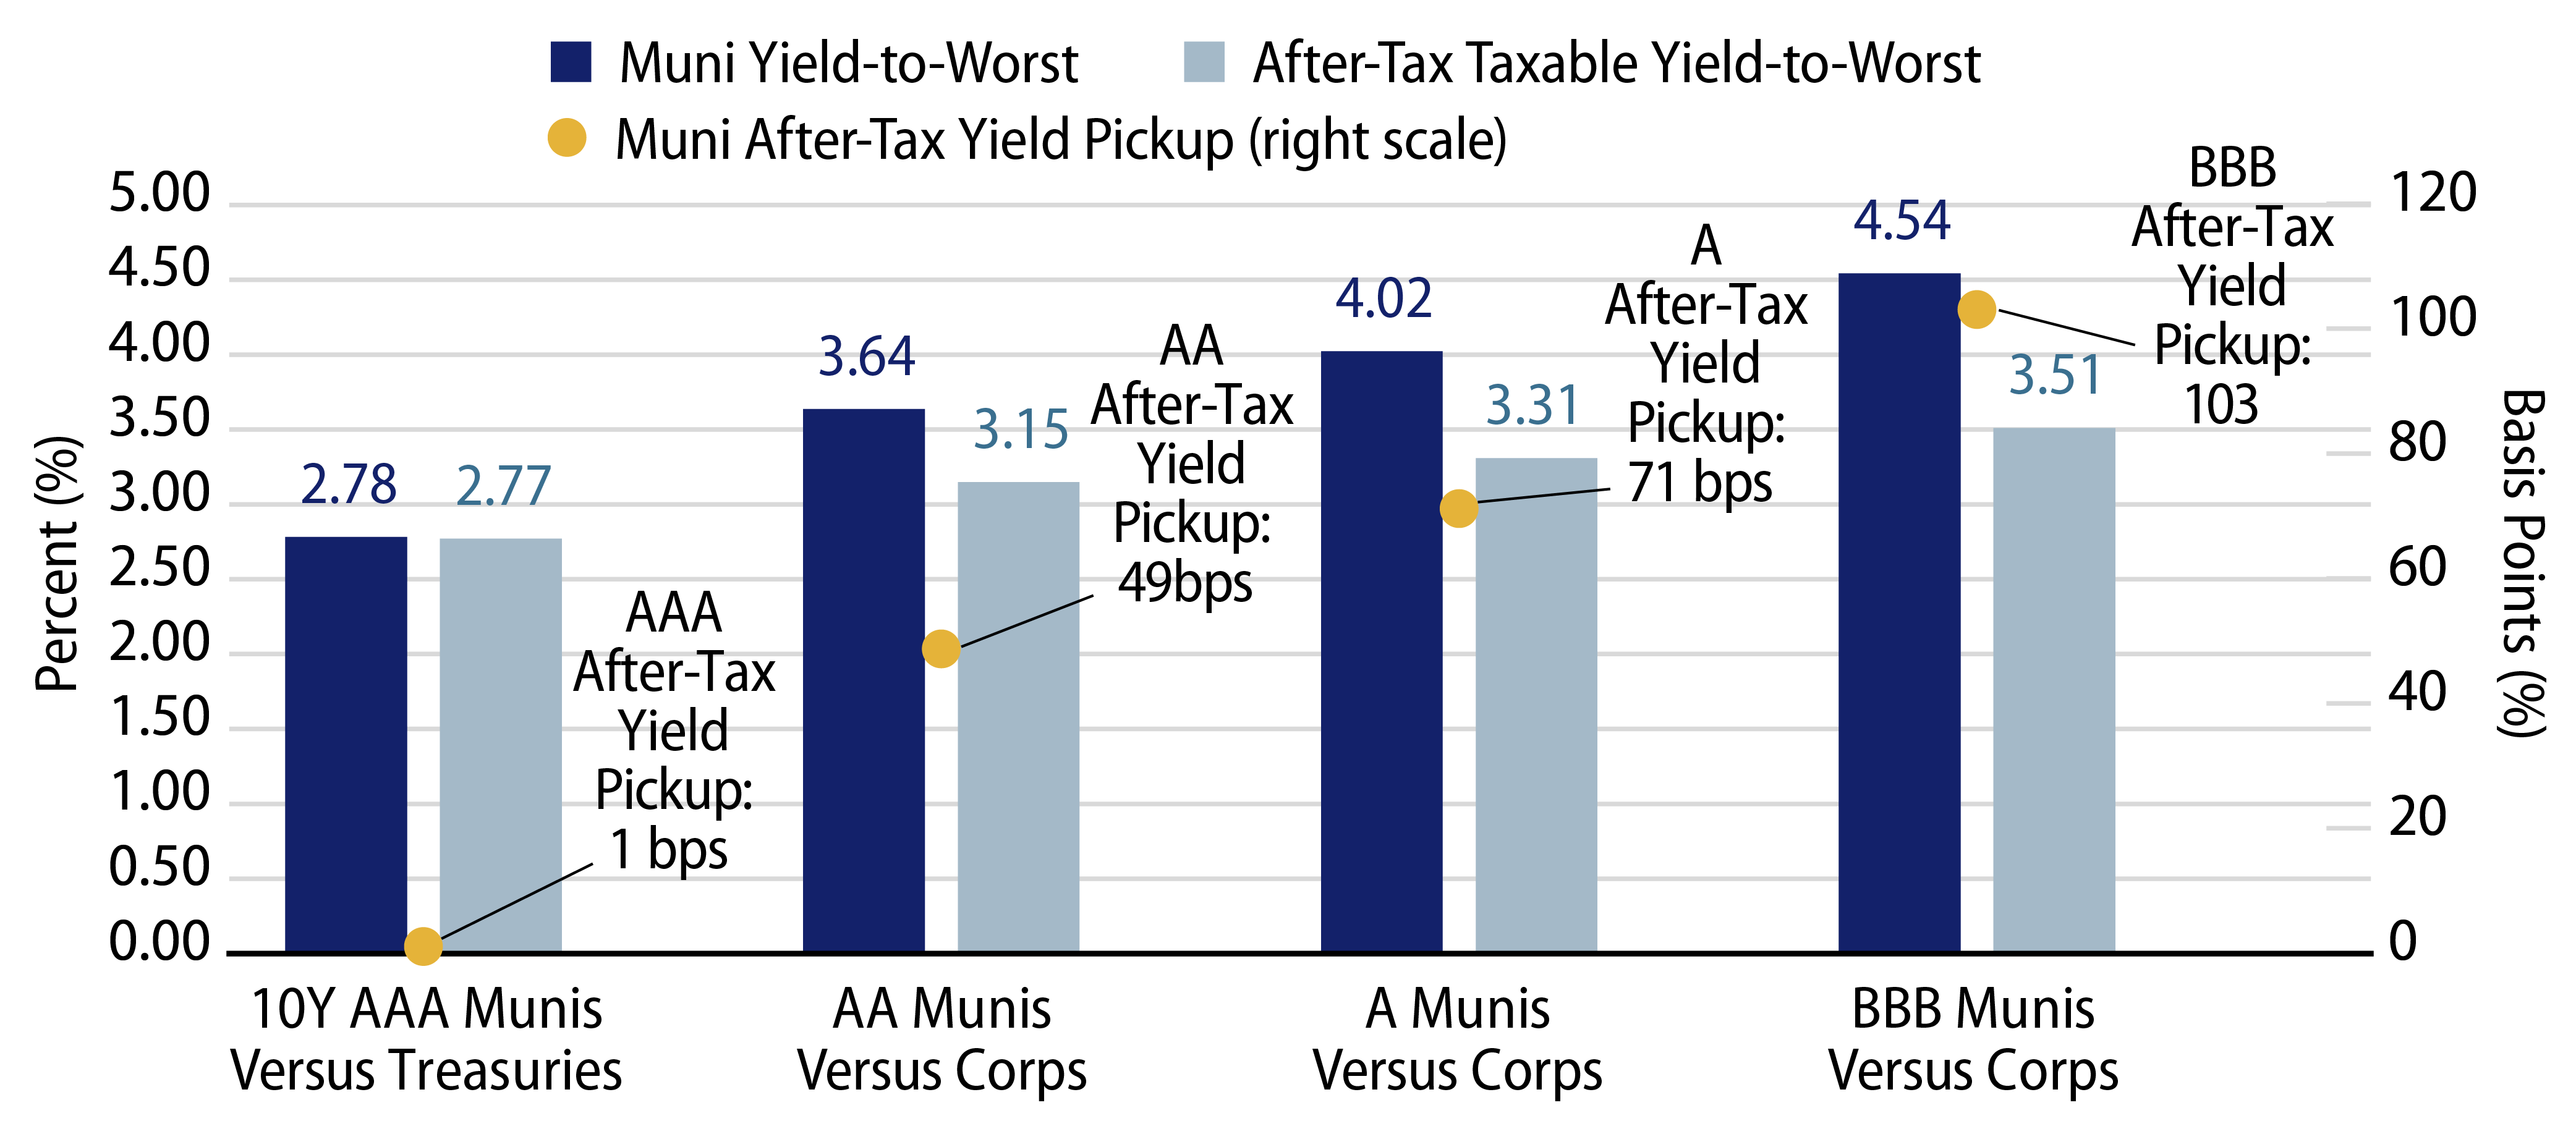
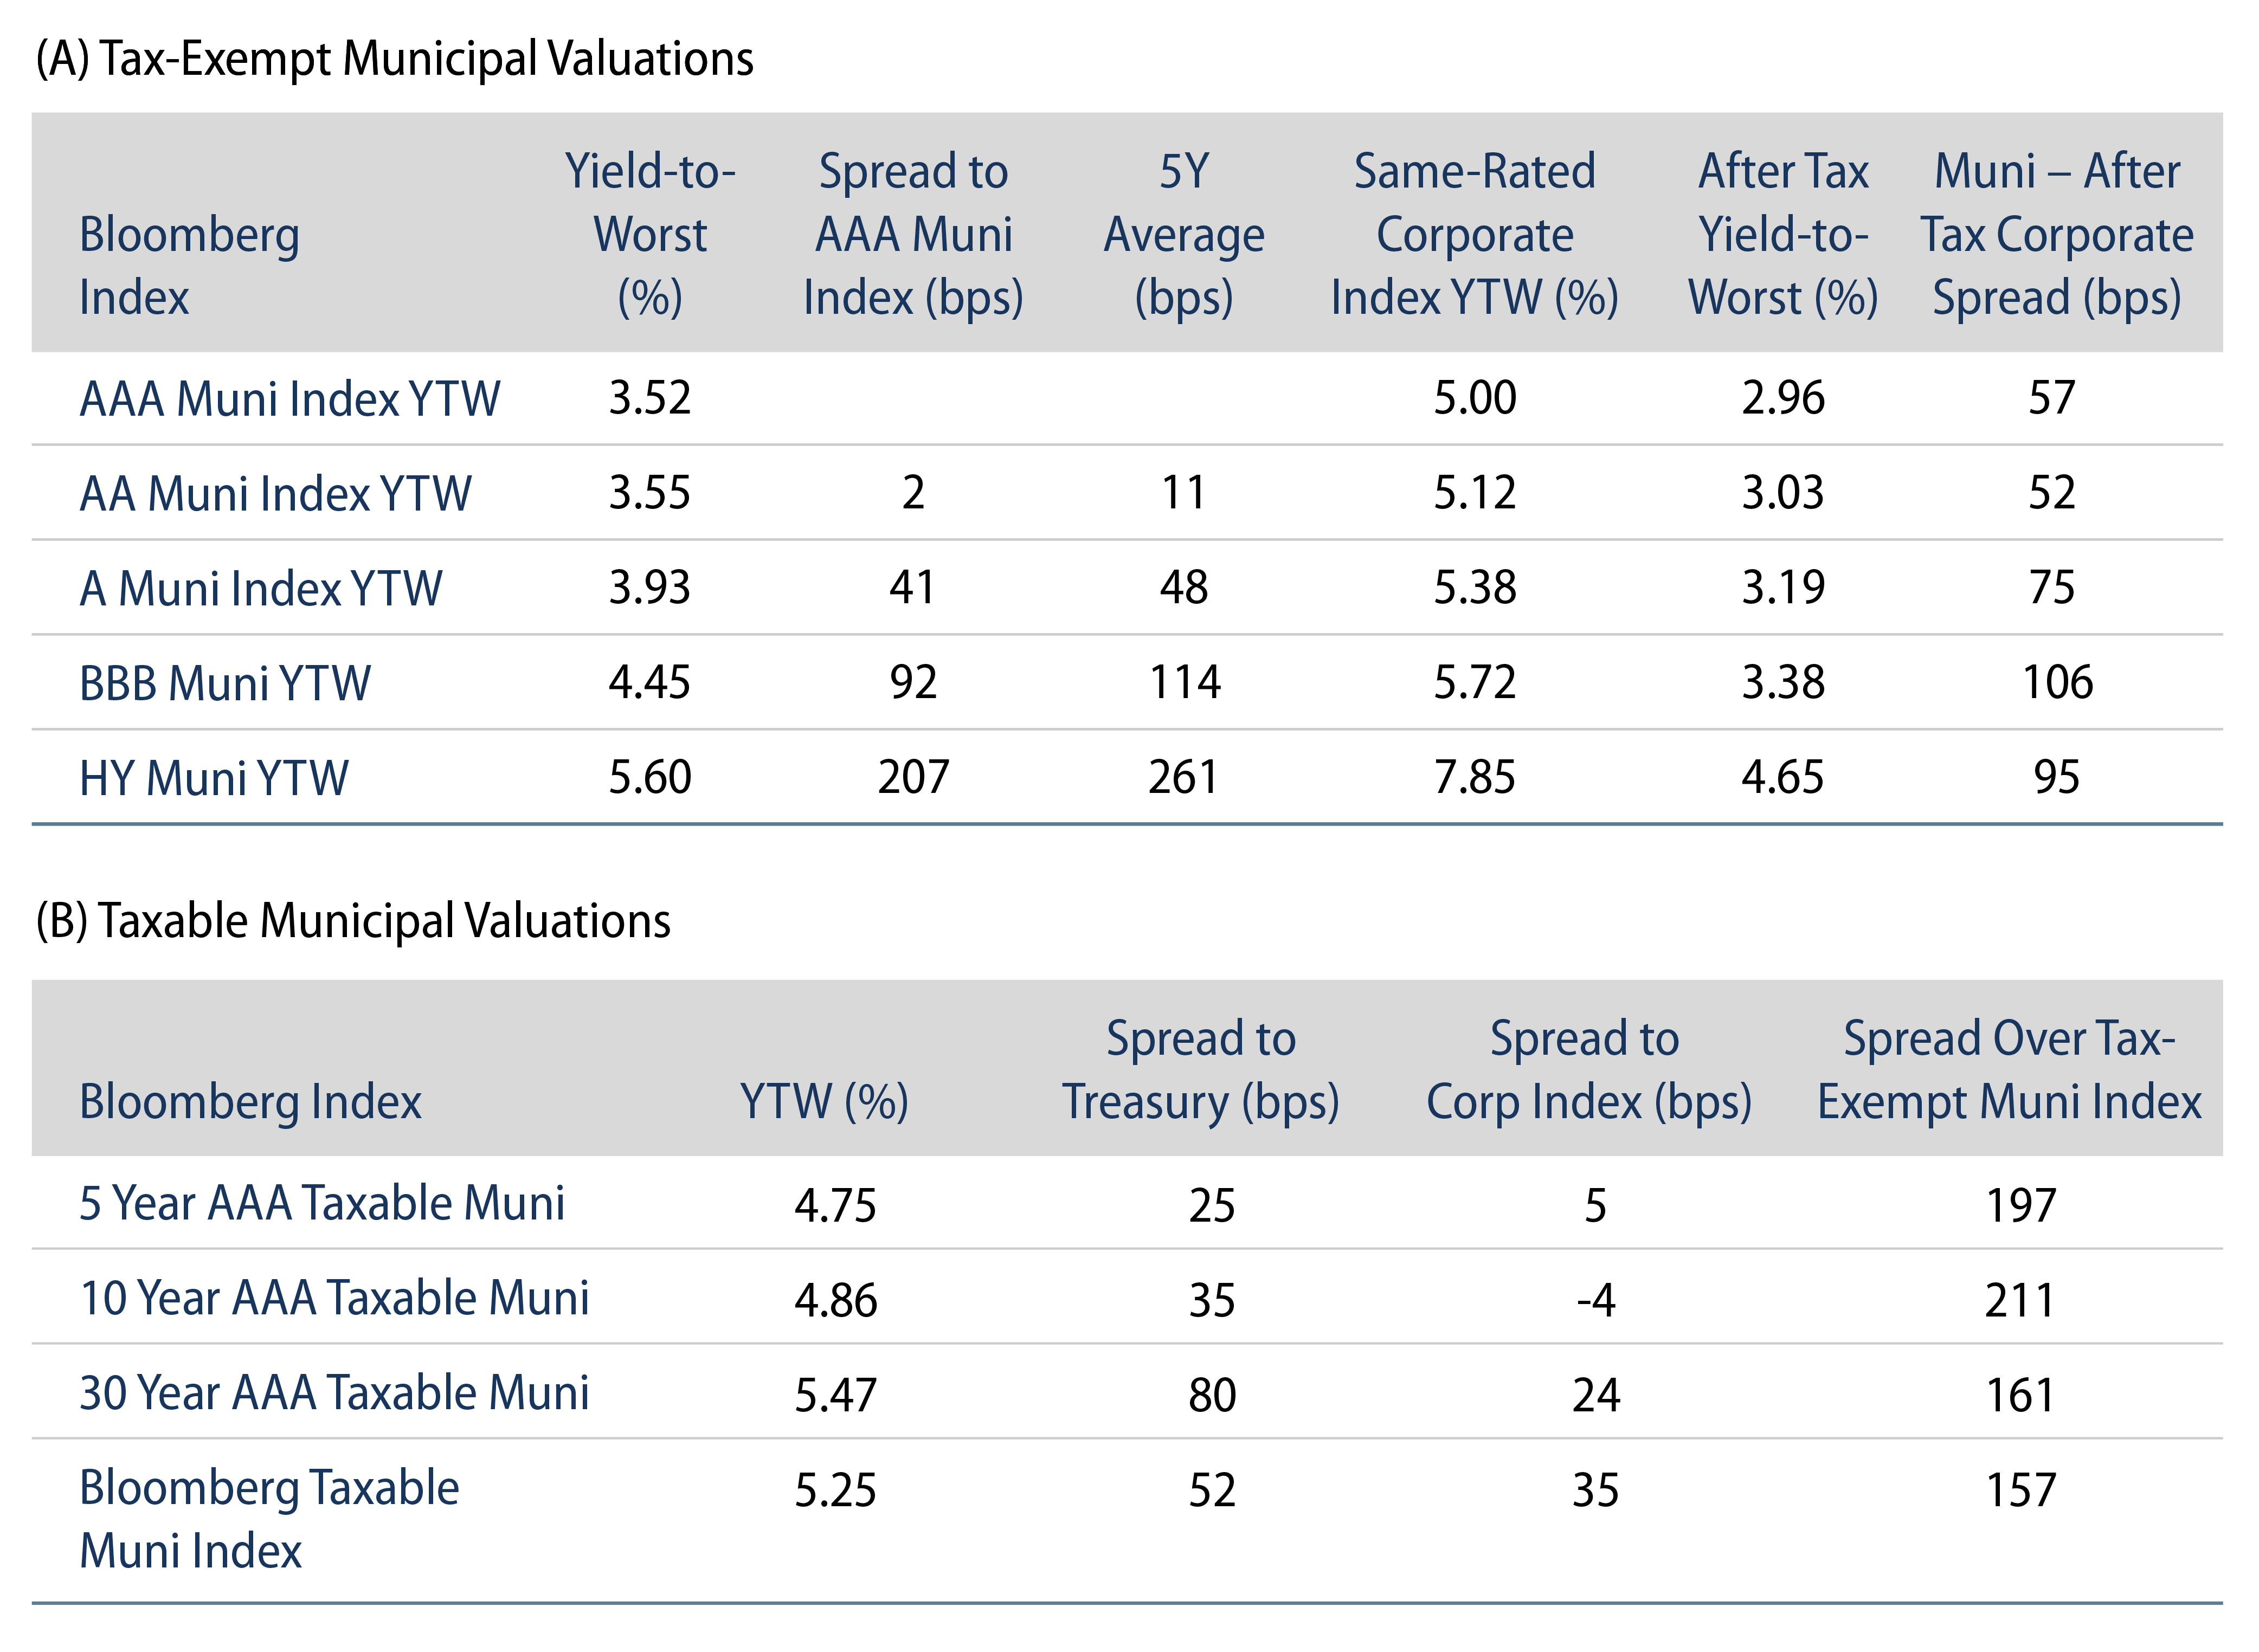
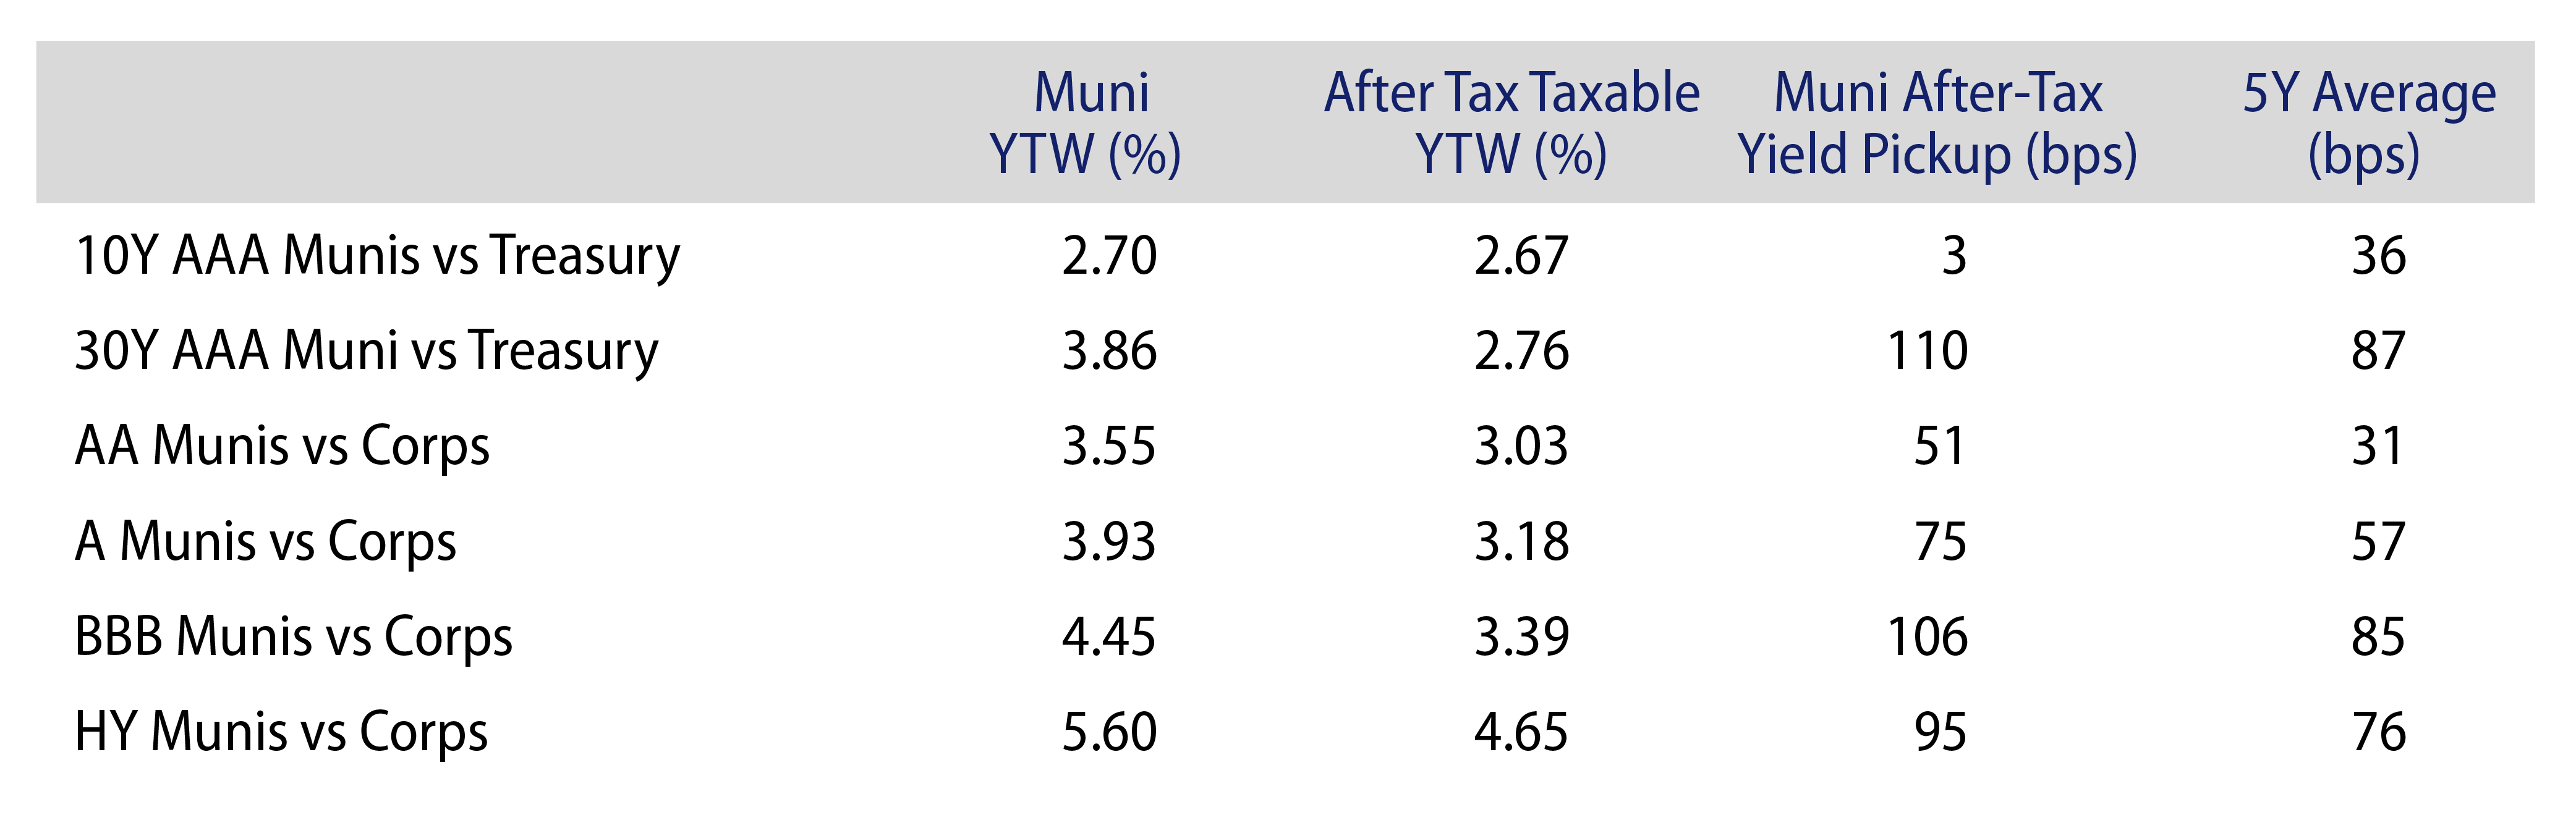
Theme #3: Munis offer attractive after-tax yield pickup versus long Treasuries and corporate credit.
ENDNOTES
1. Thomson Reuters Municipal Market Data (MMD)