Municipals Posted Positive Returns Last Week
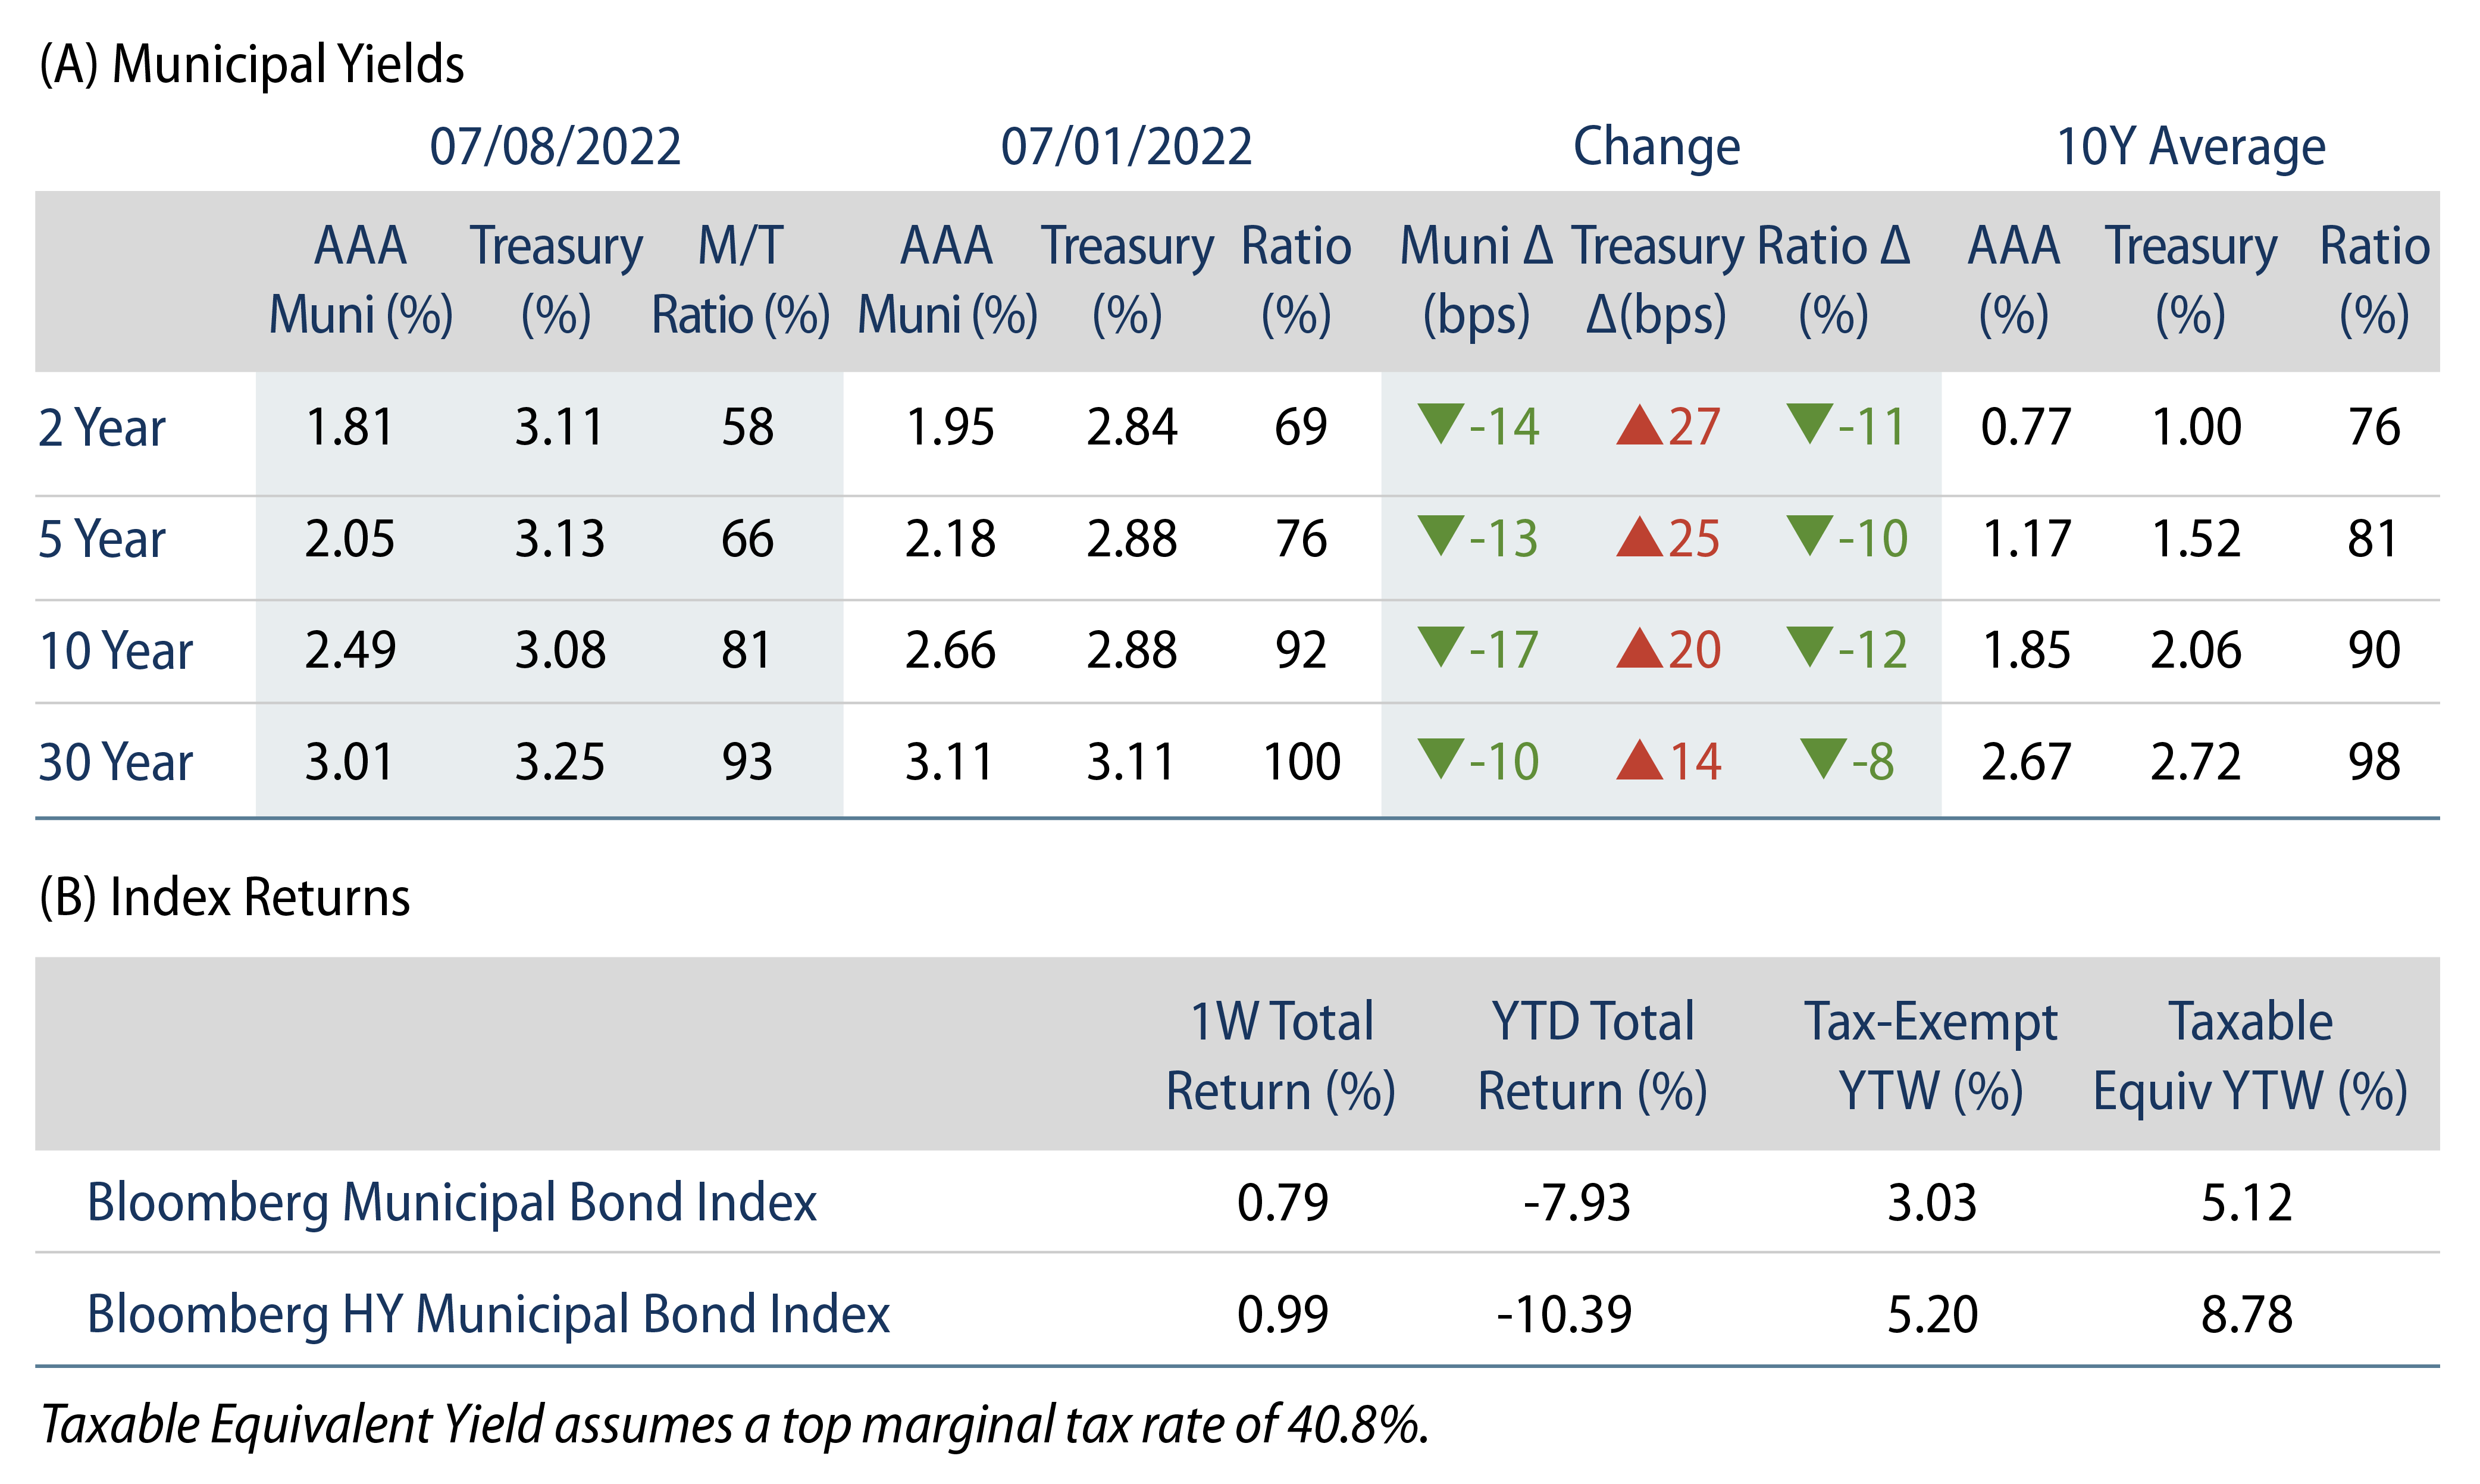
Munis posted positive returns last week and outperformed Treasuries across the curve. High-grade municipal yields moved 10-17 bps lower across the curve while municipal mutual fund outflows continued at a record pace. The Bloomberg Municipal Index returned 0.79% while the HY Muni Index returned 0.99%. This week we evaluate seasonal summer net supply trends which could strengthen market technicals.
Fund Flows Continued While Supply Was Limited During the Holiday-Shortened Week
Fund Flows: During the week ending July 6, weekly reporting municipal mutual funds recorded $313 million of net outflows, according to Lipper. Long-term funds recorded $85 million of outflows, high-yield funds recorded $159 million of inflows and intermediate funds recorded $313 million of outflows. The week’s fund outflows extend the record outflow cycle to $77.7 billion.
Supply: The muni market recorded $4.7 billion of new-issue volume, down 54% from the prior week due to the holiday-shortened week. Total year-to-date (YTD) issuance of $211 billion is 7% lower than last year’s levels, with tax-exempt issuance trending 3% higher year-over-year (YoY) and taxable issuance trending 38% lower YoY. This week’s new-issue calendar is expected to increase to $10 billion. Large deals include $1 billion Colorado Health Facilities Authority and $542 million Dallas Fort Worth Airport transactions.
This Week in Munis: Stalling Summer Supply
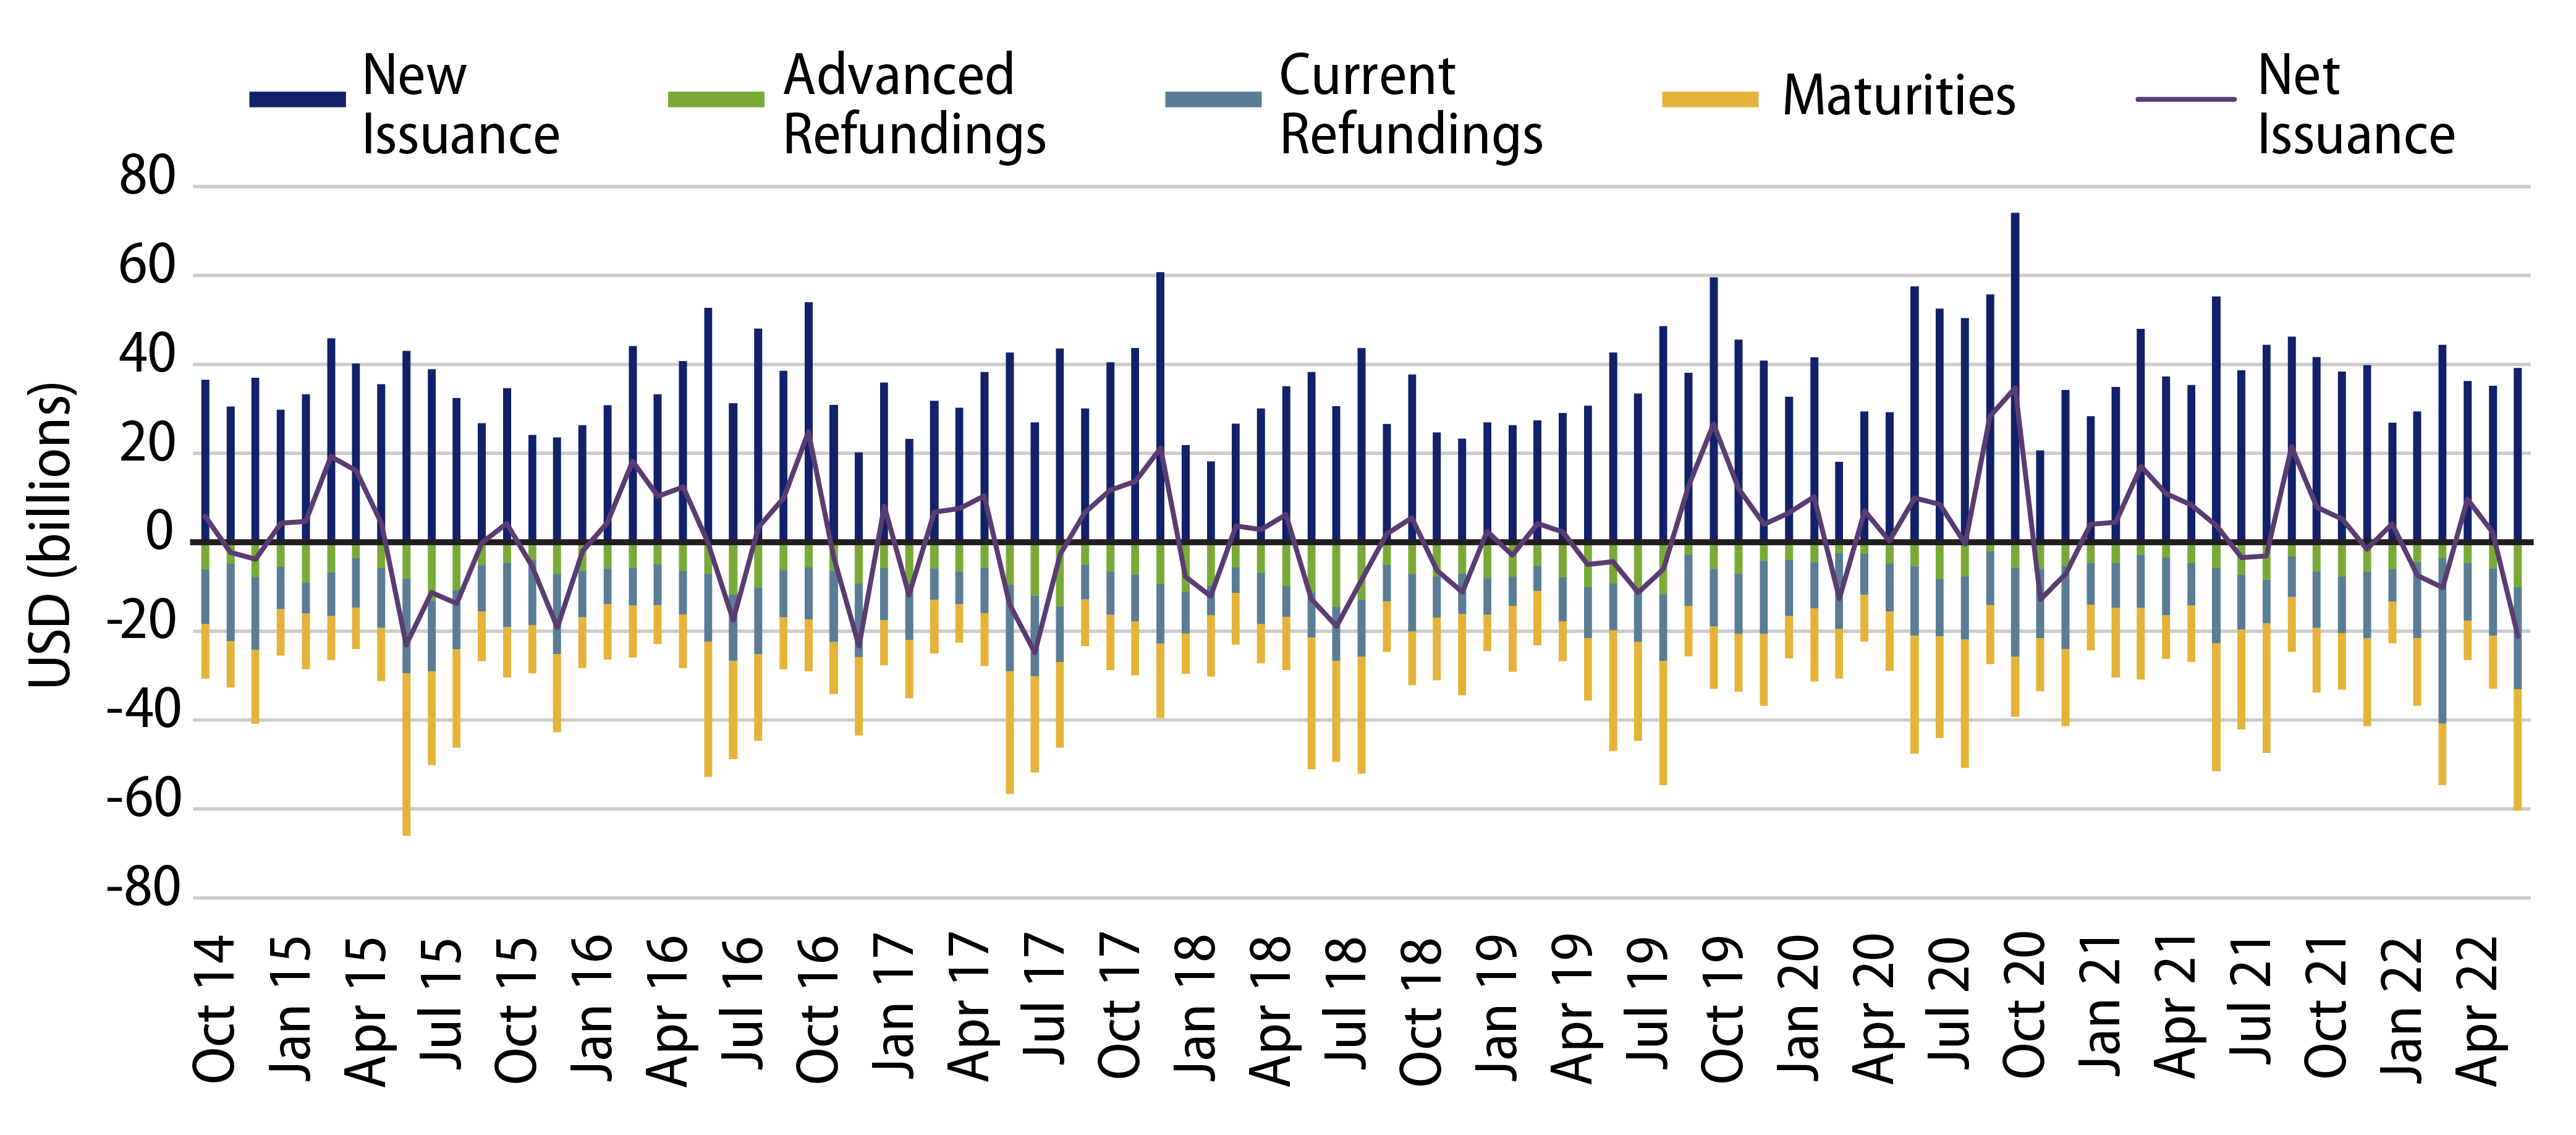
Net municipal supply levels indicate whether the municipal market is growing or shrinking, and can inform market entry points. Net municipal supply considers new issuance less redemptions associated with bond maturities and embedded call options that allow issuers to refinance outstanding debt.
In June 2022, the muni market recorded the highest level of bond redemptions since June 2016, as matured and called debt surpassed $60 billion. Paired with $39 billion of monthly new-money issuance, on a net basis, the stock of municipal market debt outstanding shrank by $21 billion in June, marking the lowest level of net supply since July 2017.
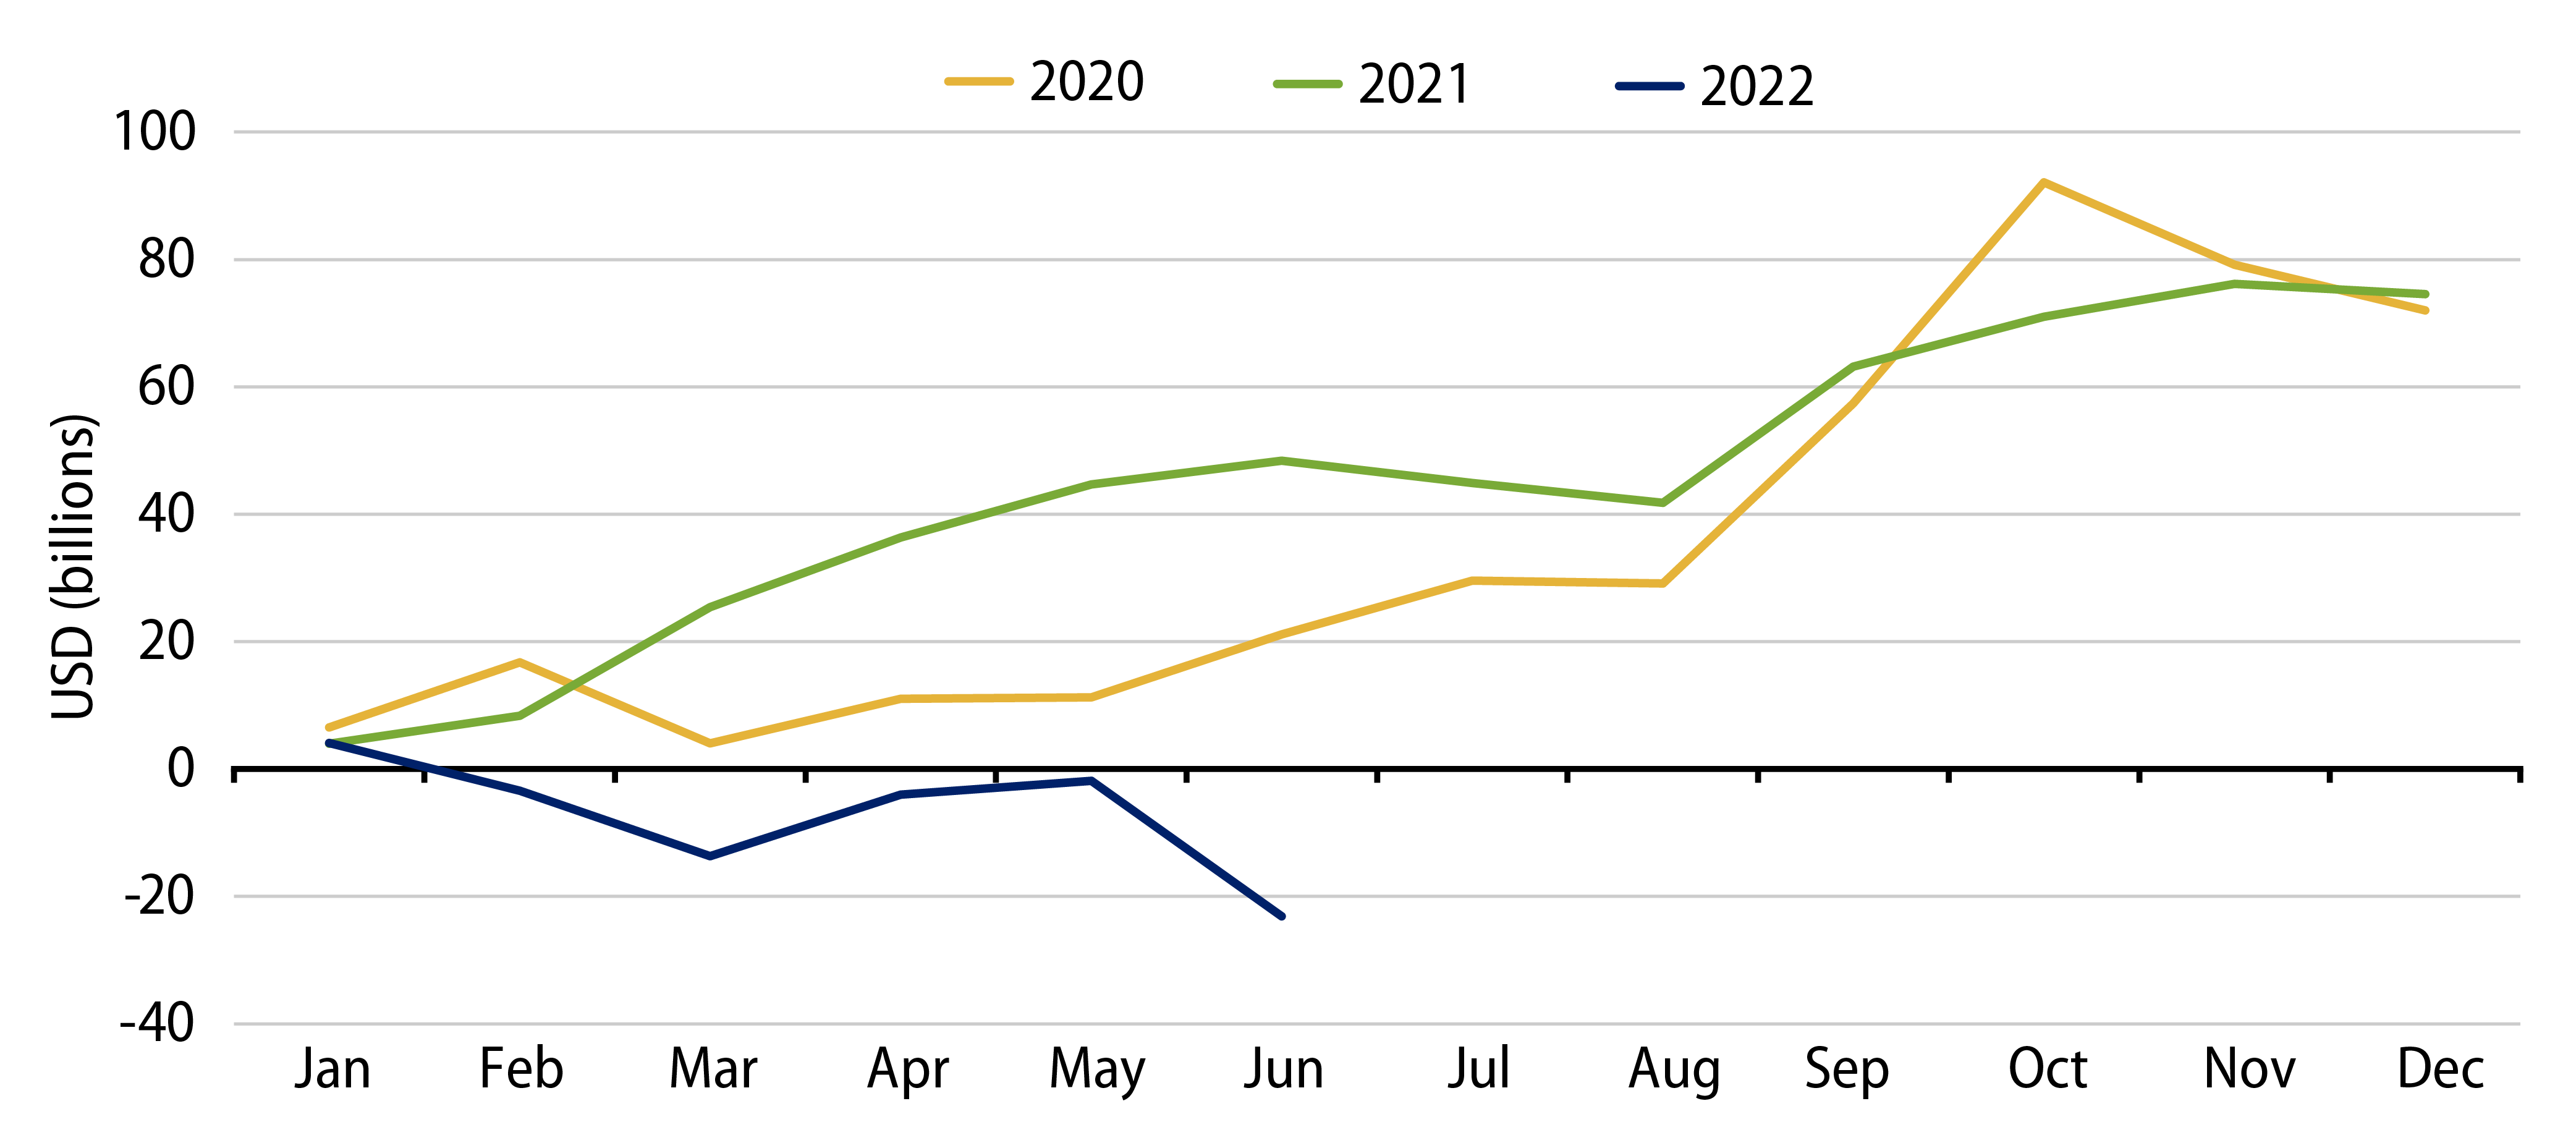
As highlighted in Exhibit 2, 1H22 net supply of -$23 billion contrasts 1H20 and 1H21 positive net supply levels of +$21 billion and +$48 billion, respectively. While first-half of the year new-money issuance was in-line with the prior two-year average at $211 billion, this year’s level of current refunding was nearly two times the prior two-year average. Considering the 2017 Tax Cuts and Jobs Act restricting of tax-exempt advanced refunding, it is not surprising to see a ramp-up of redemptions from bonds that reach their call date which could have otherwise been pre-refunded in prior years.
Municipal valuations are increasingly driven by supply and demand technicals, and this year’s negative market performance has been more indicative of the outflows from municipal mutual funds than the tighter supply conditions. However, these negative supply conditions likely offset some of the potential negative performance that could have been otherwise realized with this year’s record municipal fund outflow cycle. Moreover, we anticipate negative net supply conditions to continue as $65 billion of municipal debt is scheduled to mature in July and August. Reinvestment of these maturities paired with attractive after-tax relative valuations that can attract demand to the municipal asset class, can buoy market performance amid any additional market volatility and set the stage for a stronger technical dynamic heading into the back half of 2022.