Macros, Markets and Munis
Munis posted negative returns last week due to higher fixed-income yields following the release of the November Consumer Price Index (CPI), which was in line with expectations. However, the data highlighted that the pace of disinflation has slowed, with CPI increasing to 2.7% year-over-year (YoY) from 2.6% the prior month. Muni yields trailed Treasuries higher, but generally outperformed Treasuries and other taxable fixed-income markets during the week. Meanwhile, technicals weakened amid fund outflows and an elevated supply. This week we highlight the release of new Census data on state and local revenues.
Technicals Weaken as Mutual Funds Record Outflows
Fund Flows (down $316 million): During the week ending December 18, weekly reporting municipal mutual funds recorded $384 million of net inflows, according to Lipper. Long-term funds recorded $140 million of inflows, intermediate funds recorded $333 million of outflows and high-yield funds recorded $192 million of inflows. This week’s outflows end a 23-week streak of consecutive inflows and lead estimated year-to-date (YTD) net inflows lower to $42 billion.
Supply (YTD supply of $494 billion, up 39% YoY): The muni market recorded $12 billion of new-issue supply, down 23% from the prior week but still tracking above average levels. YTD issuance of $494 billion is 39% higher than last year’s level, with tax-exempt issuance 42% higher and taxable issuance 8% higher YoY. This week’s calendar is expected to slow to $3 billion. The largest deals include $1.5 billion from the New York City Transitional Finance Authority and $200 million from the Capital Trust Authority transactions.
This Week in Munis: State and Local Revenue Estimates
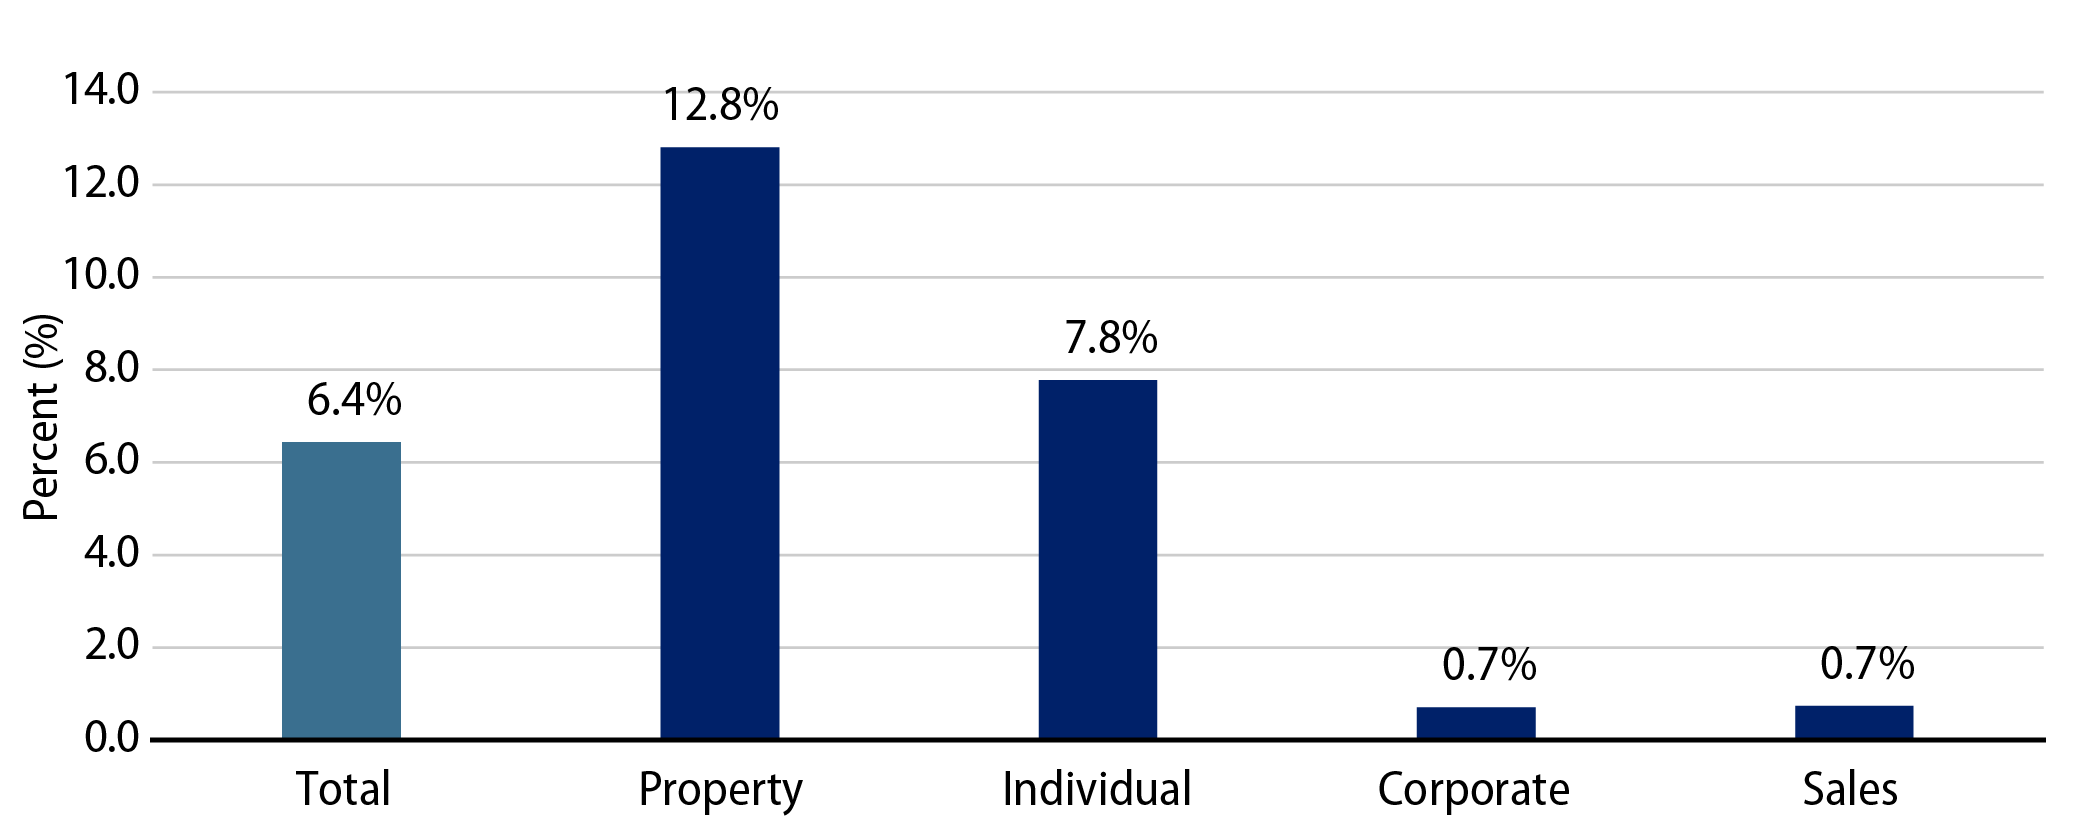
Last week the Census released 3Q24 state and local tax collection estimates, which indicated continued revenue growth for state and local governments. Third quarter major state and local government tax collections grew 6.4% from 3Q23 levels to $442 billion. Among the major state revenue sources, individual income taxes increased 7.8%, corporate income tax collections increased 0.7% and sales tax collections increased 0.7% YoY. Property tax collections, the primary source of revenues for local governments, increased 12.8% YoY to $147 billion.
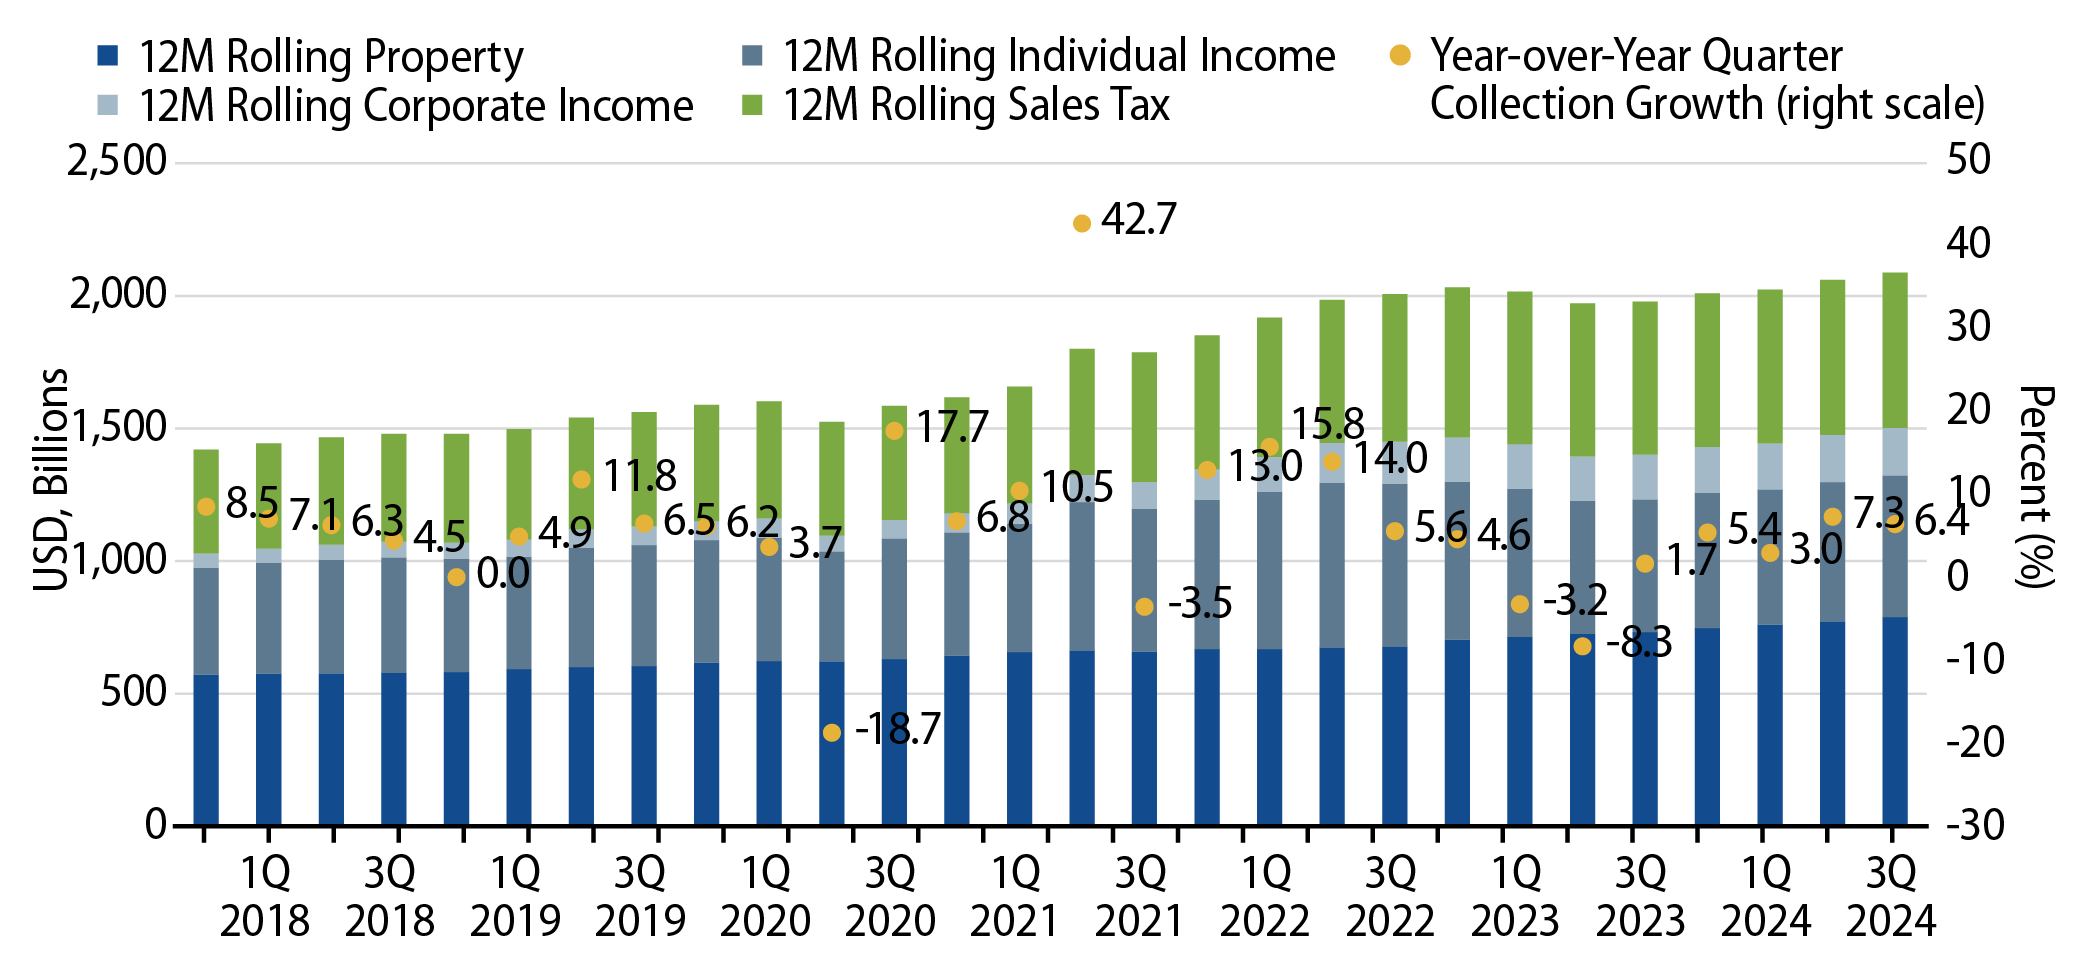
Four-quarter trailing tax collections increased 6.4% YoY to $2.1 trillion, marking a record high level according to the Census data. On a 12-month trailing basis, individual income tax collections increased 6.6% YoY, corporate income tax collections increased 6.7% YoY and sales tax collections increased 1.5% YoY. 12-month rolling property tax collections also recorded a strong trend higher, growing 7.7% YoY.
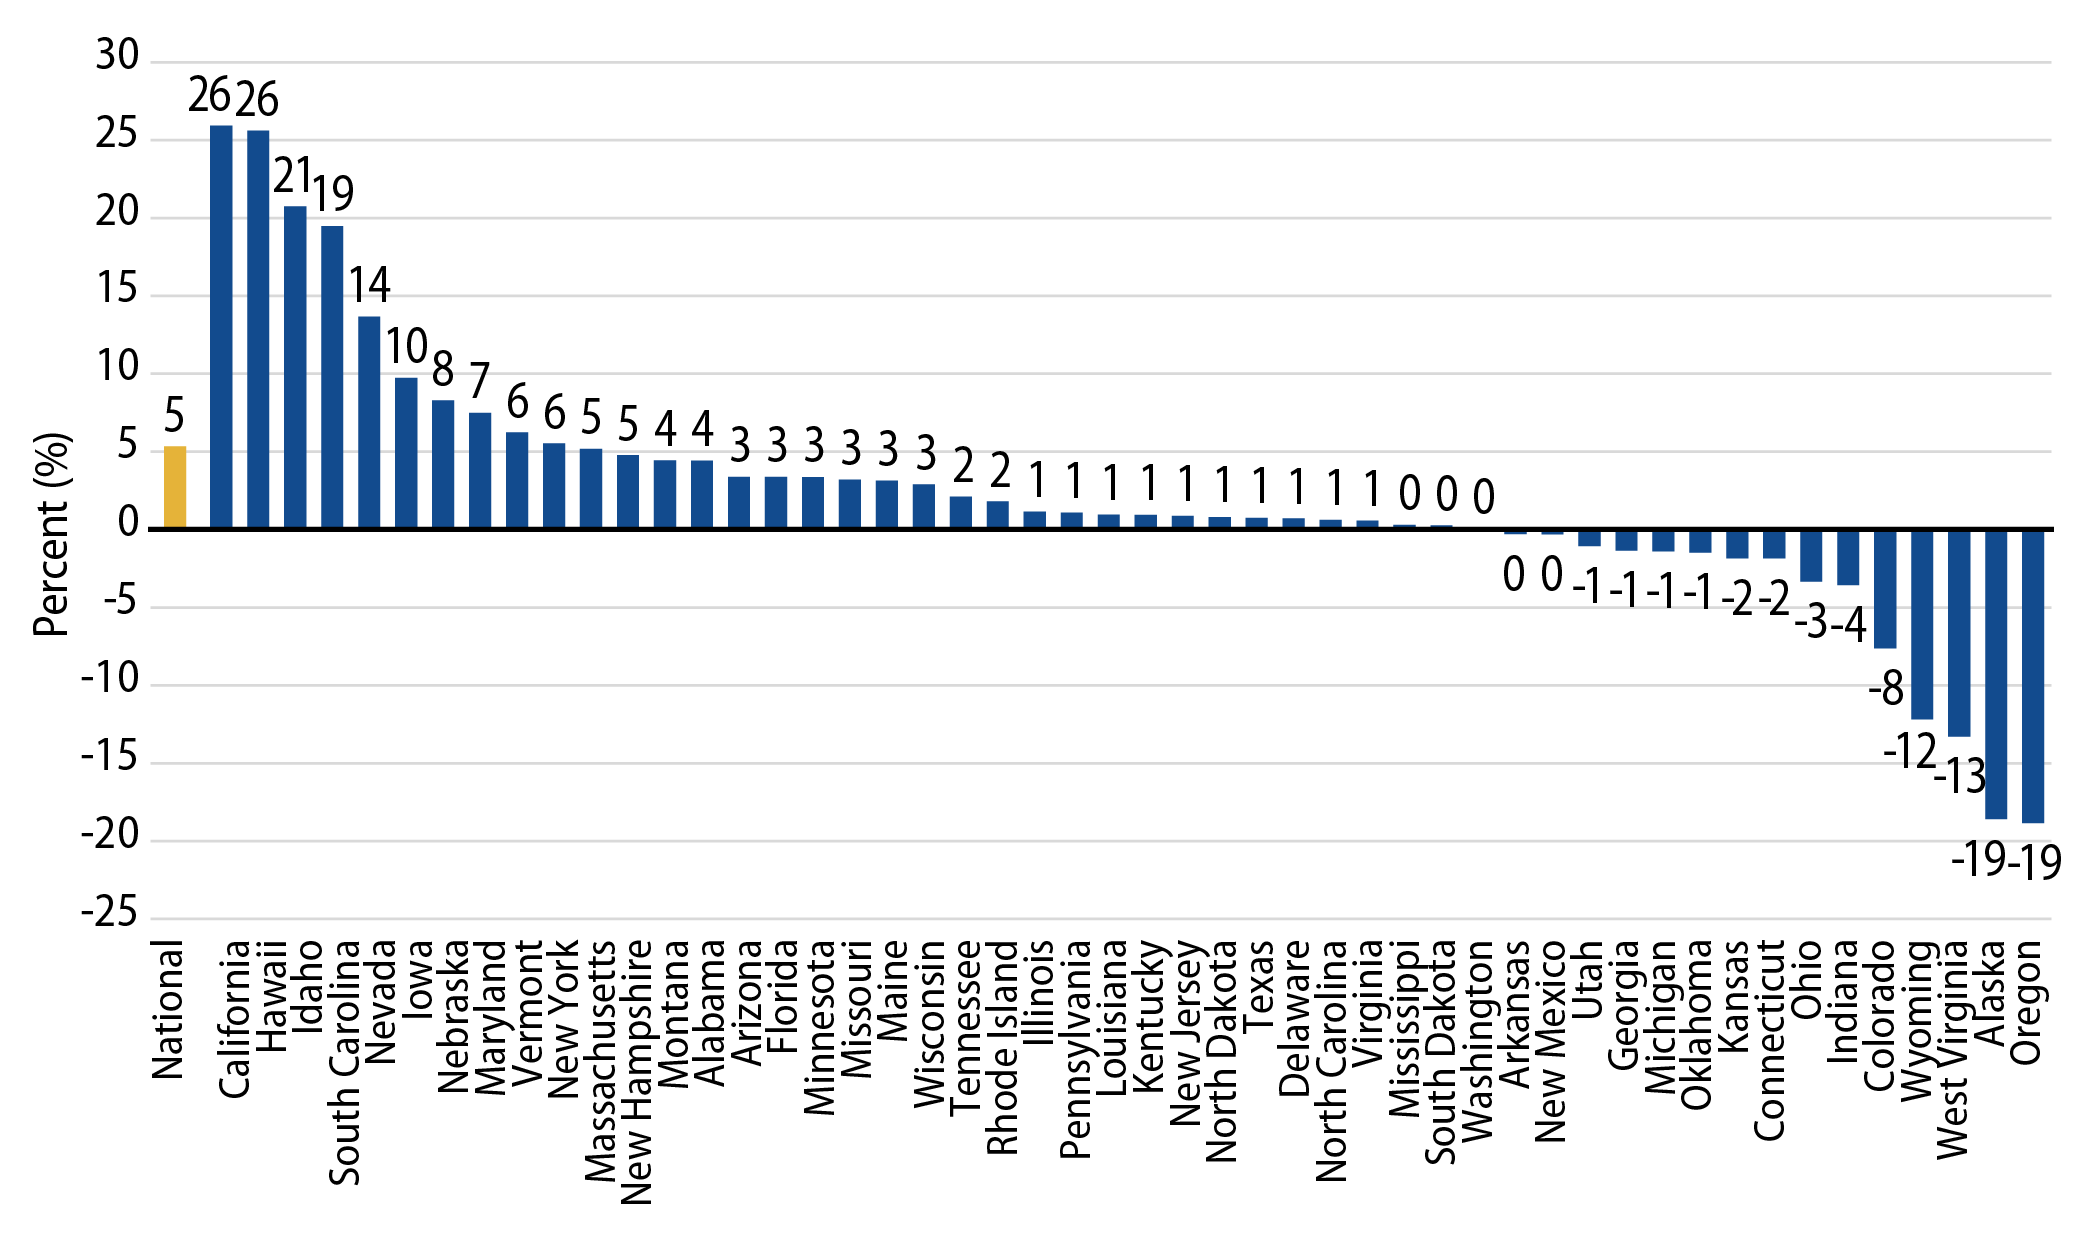
From a state perspective, the Census estimates that the majority of states recorded revenue increases in the four quarters ending September 30, and total YoY state tax collections increased 5.0 % during the year. California (+26%), Hawaii (+26%) and Idaho (+21%) recorded the highest growth in estimated tax revenue, while Oregon (-19%), Alaska (-19%) and West Virginia (-13%) recorded the greatest YoY tax collection declines.
The continued growth of tax collections highlights the strength of municipal credit, despite signs of slowing economic growth. We expect a strong labor market and consumer spending to support tax collections and municipal credit conditions over the medium term. These conditions are likely to support lower investment-grade debt amid potentially improved demand conditions as the Federal Reserve continues its rate-cutting cycle.
Municipal Credit Curves and Relative Value
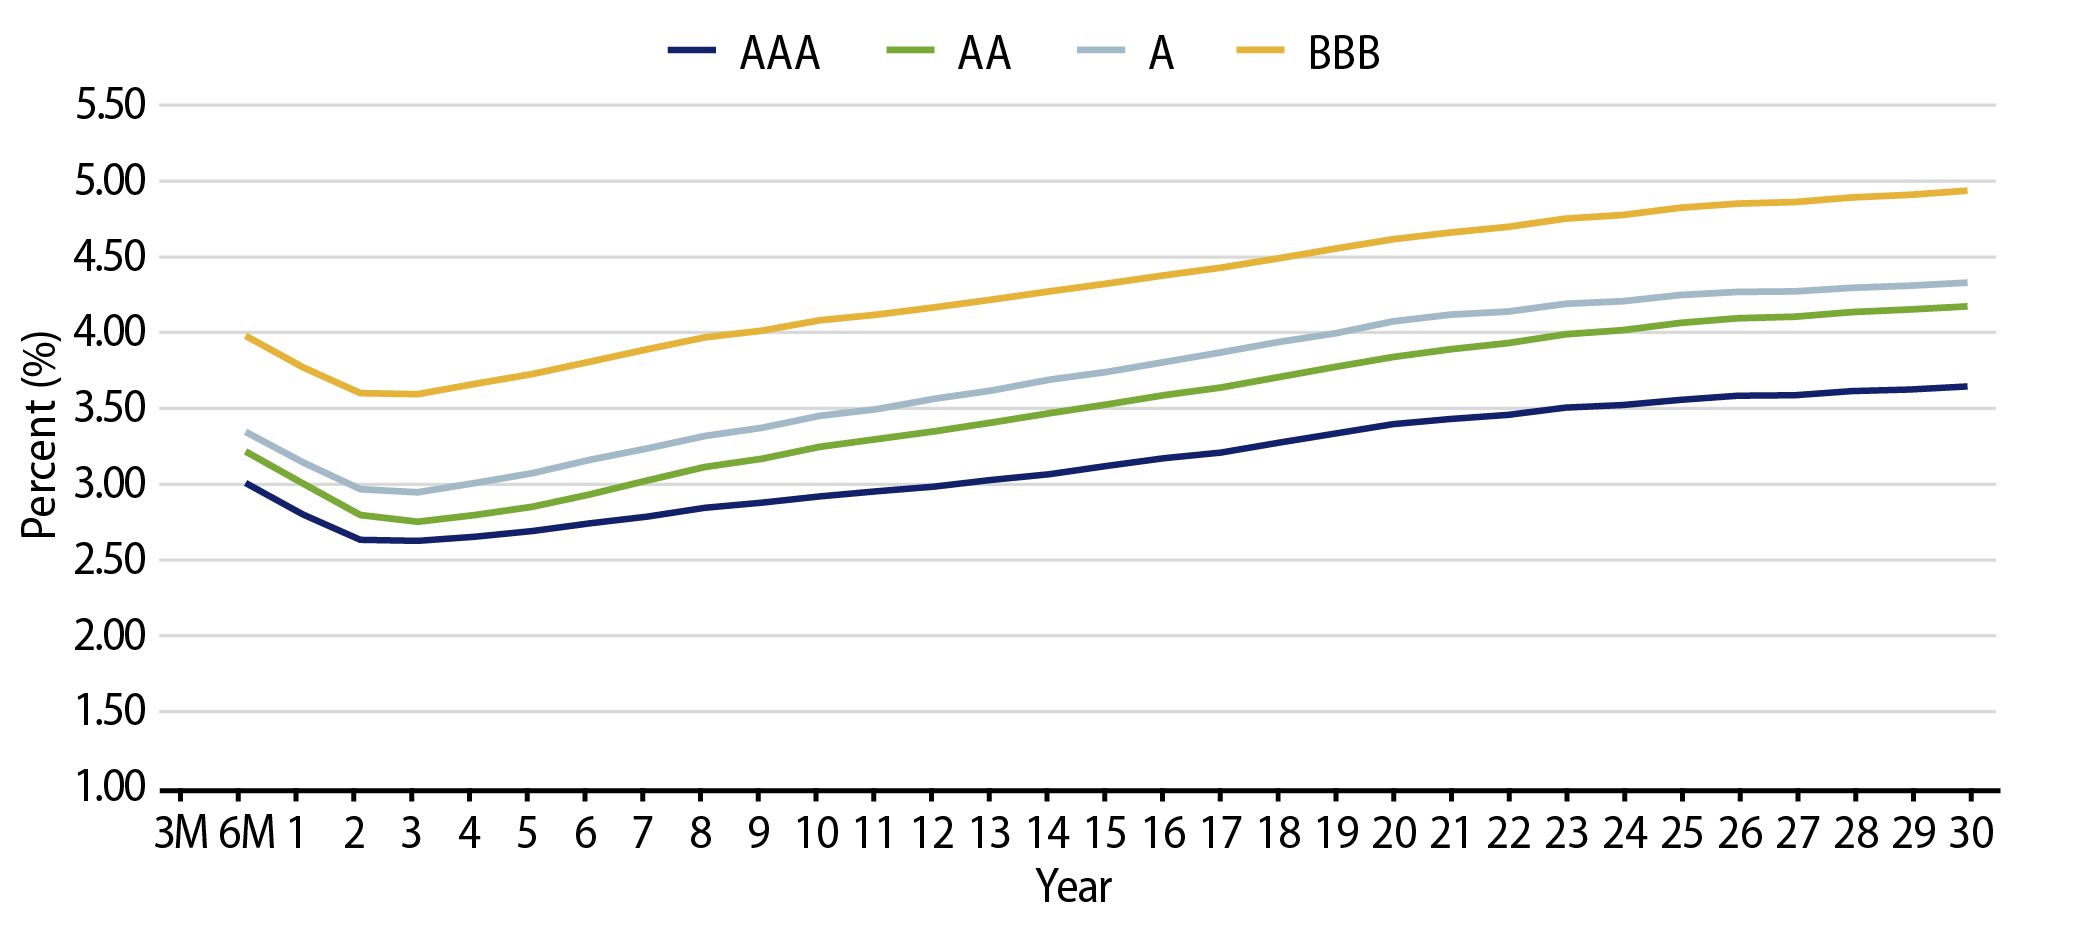
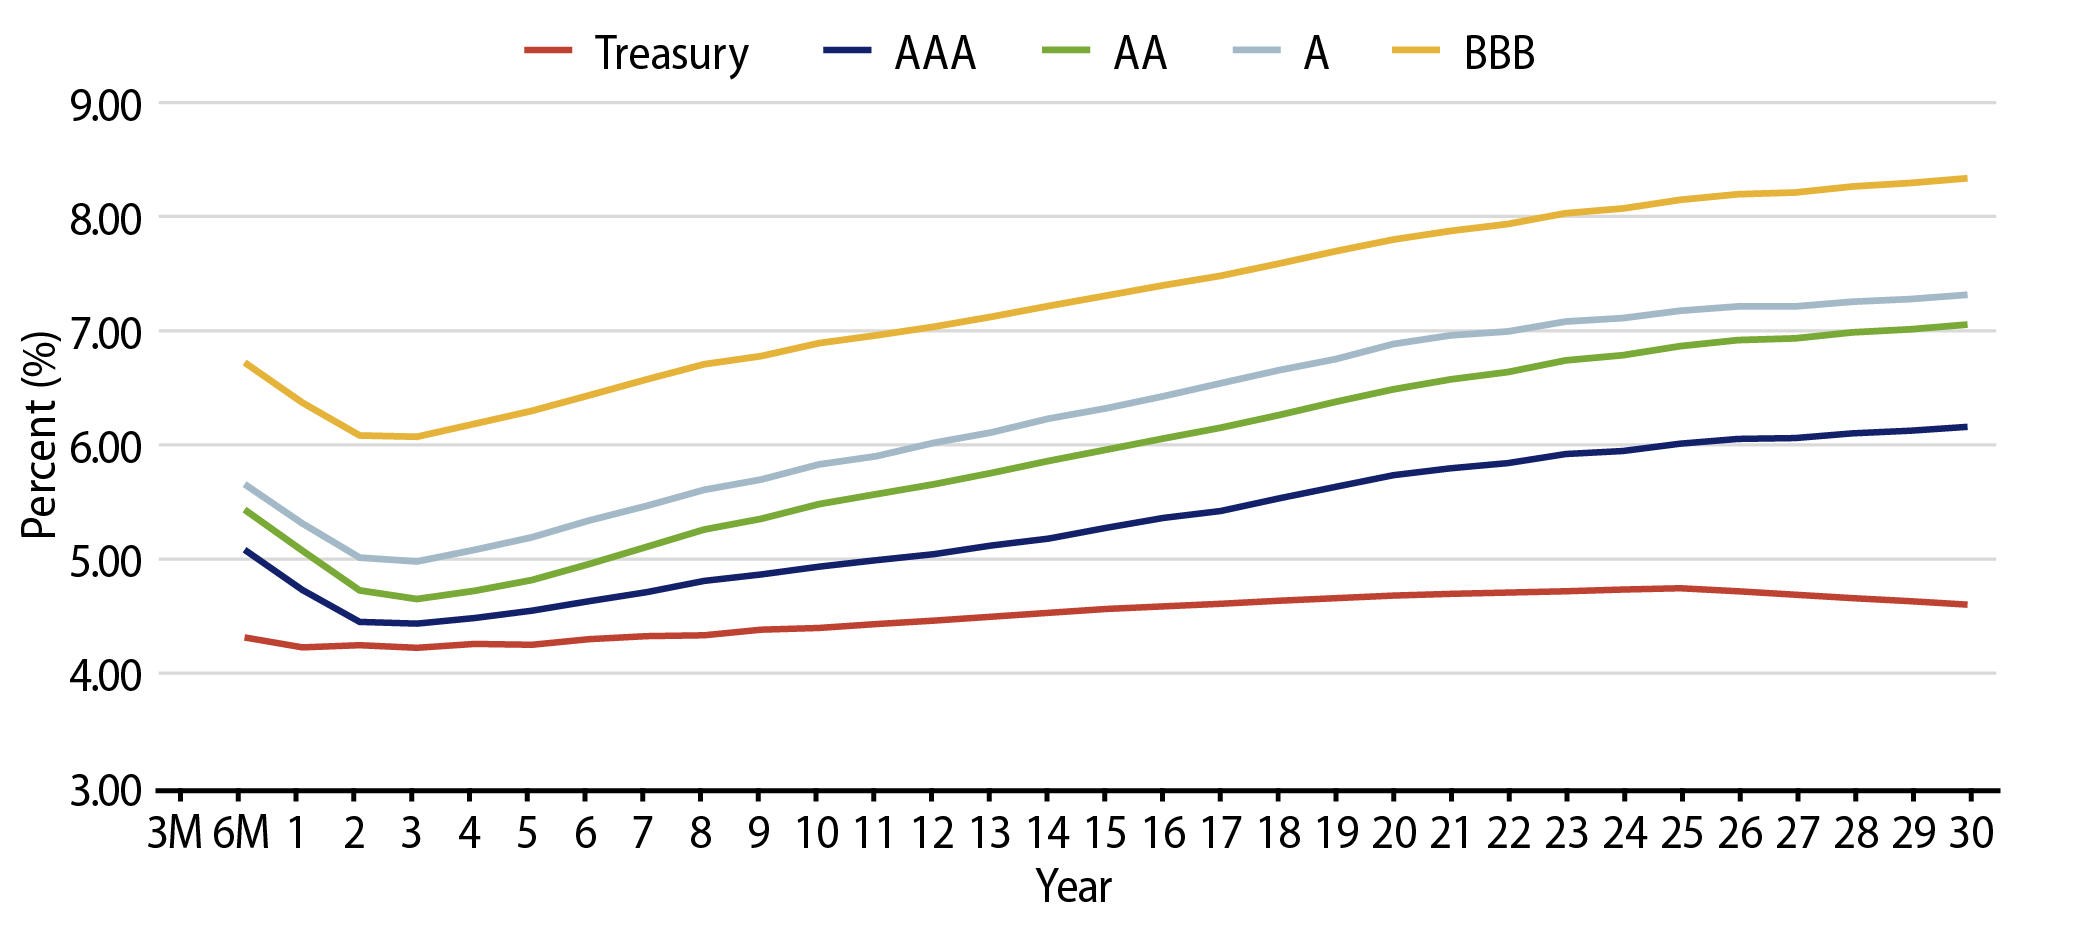
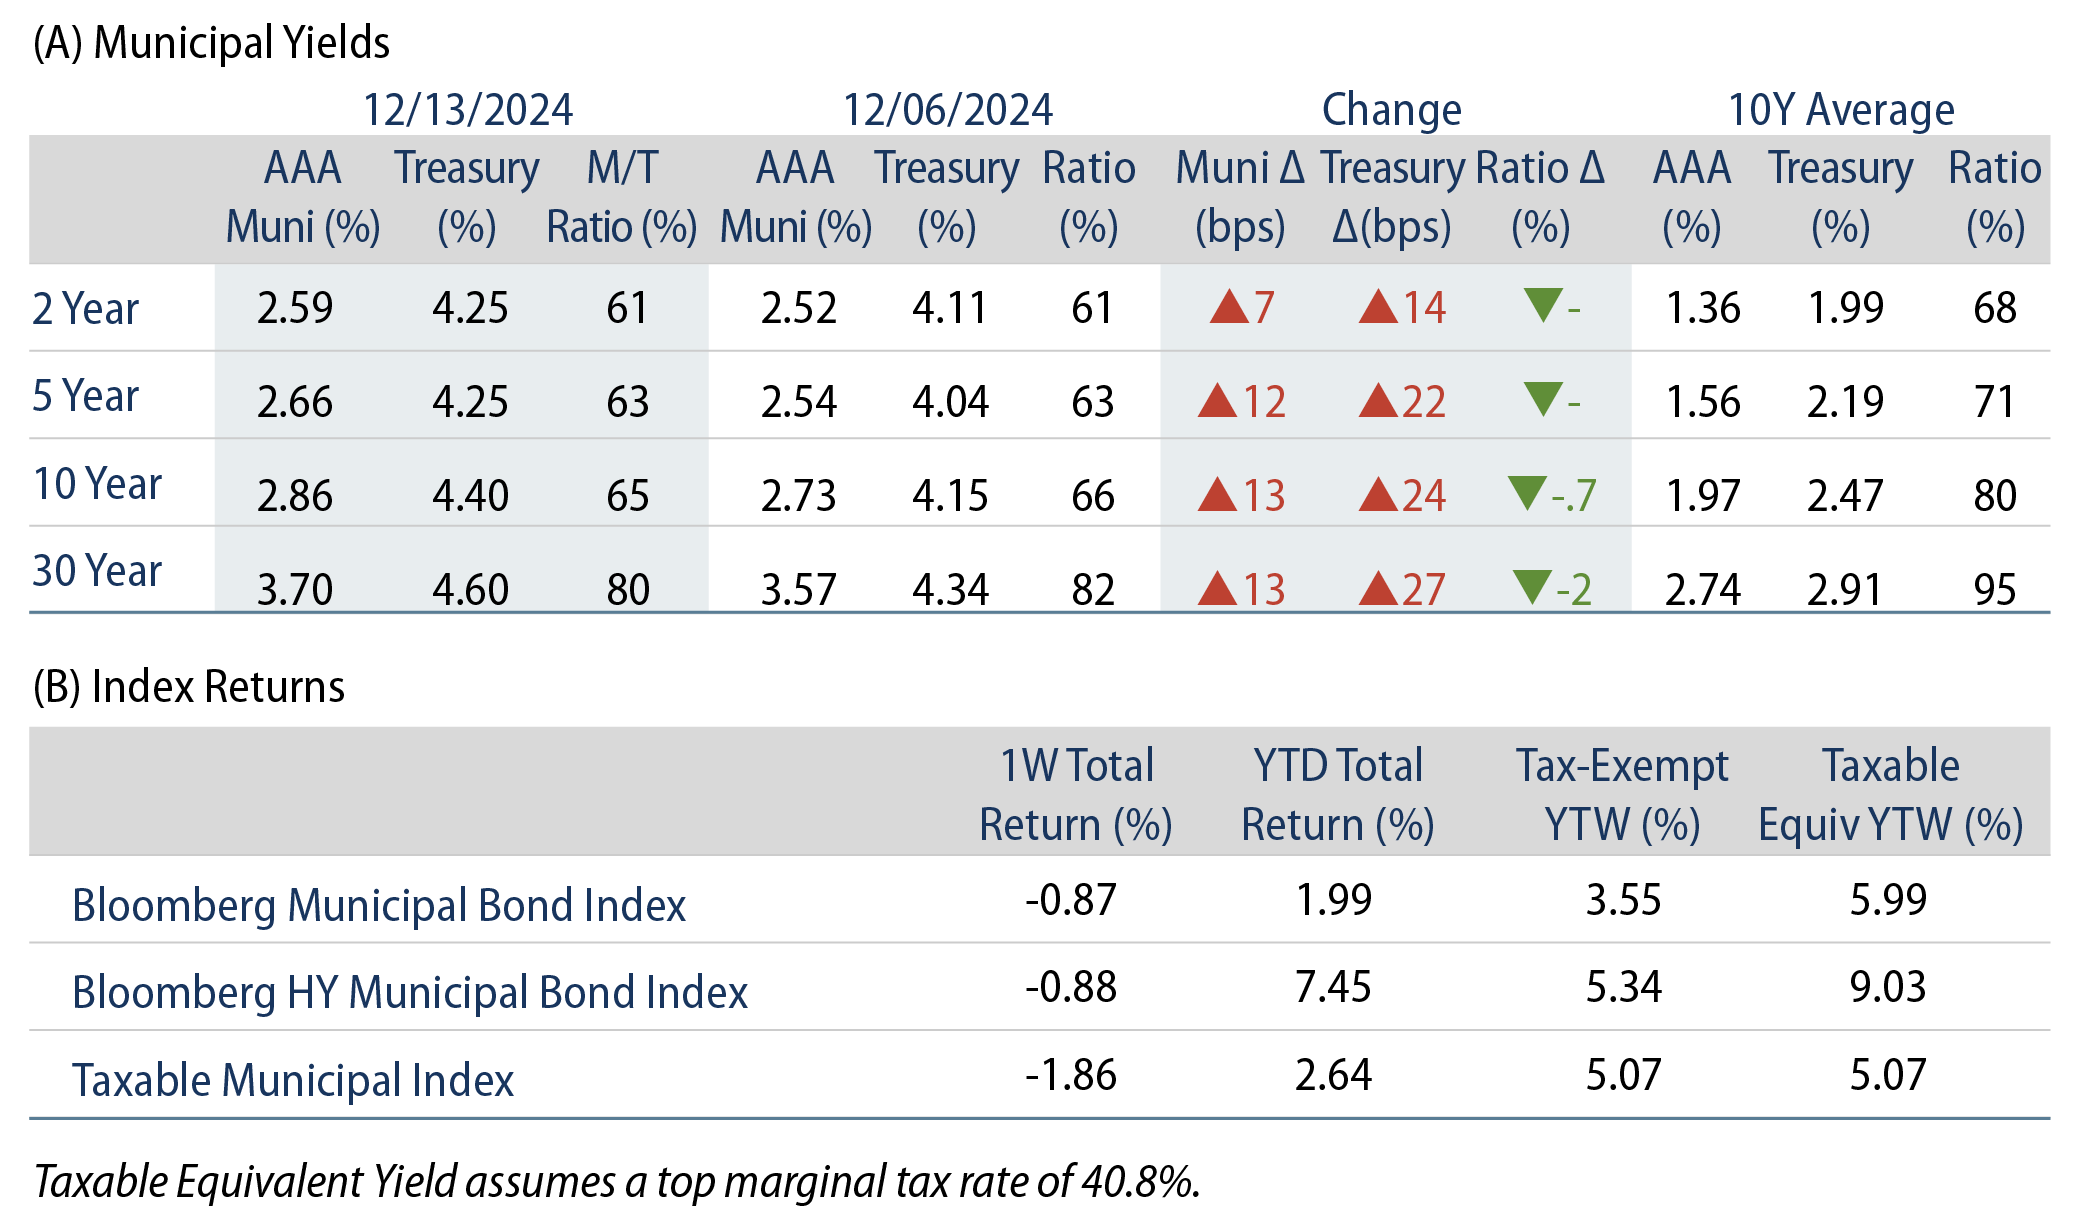
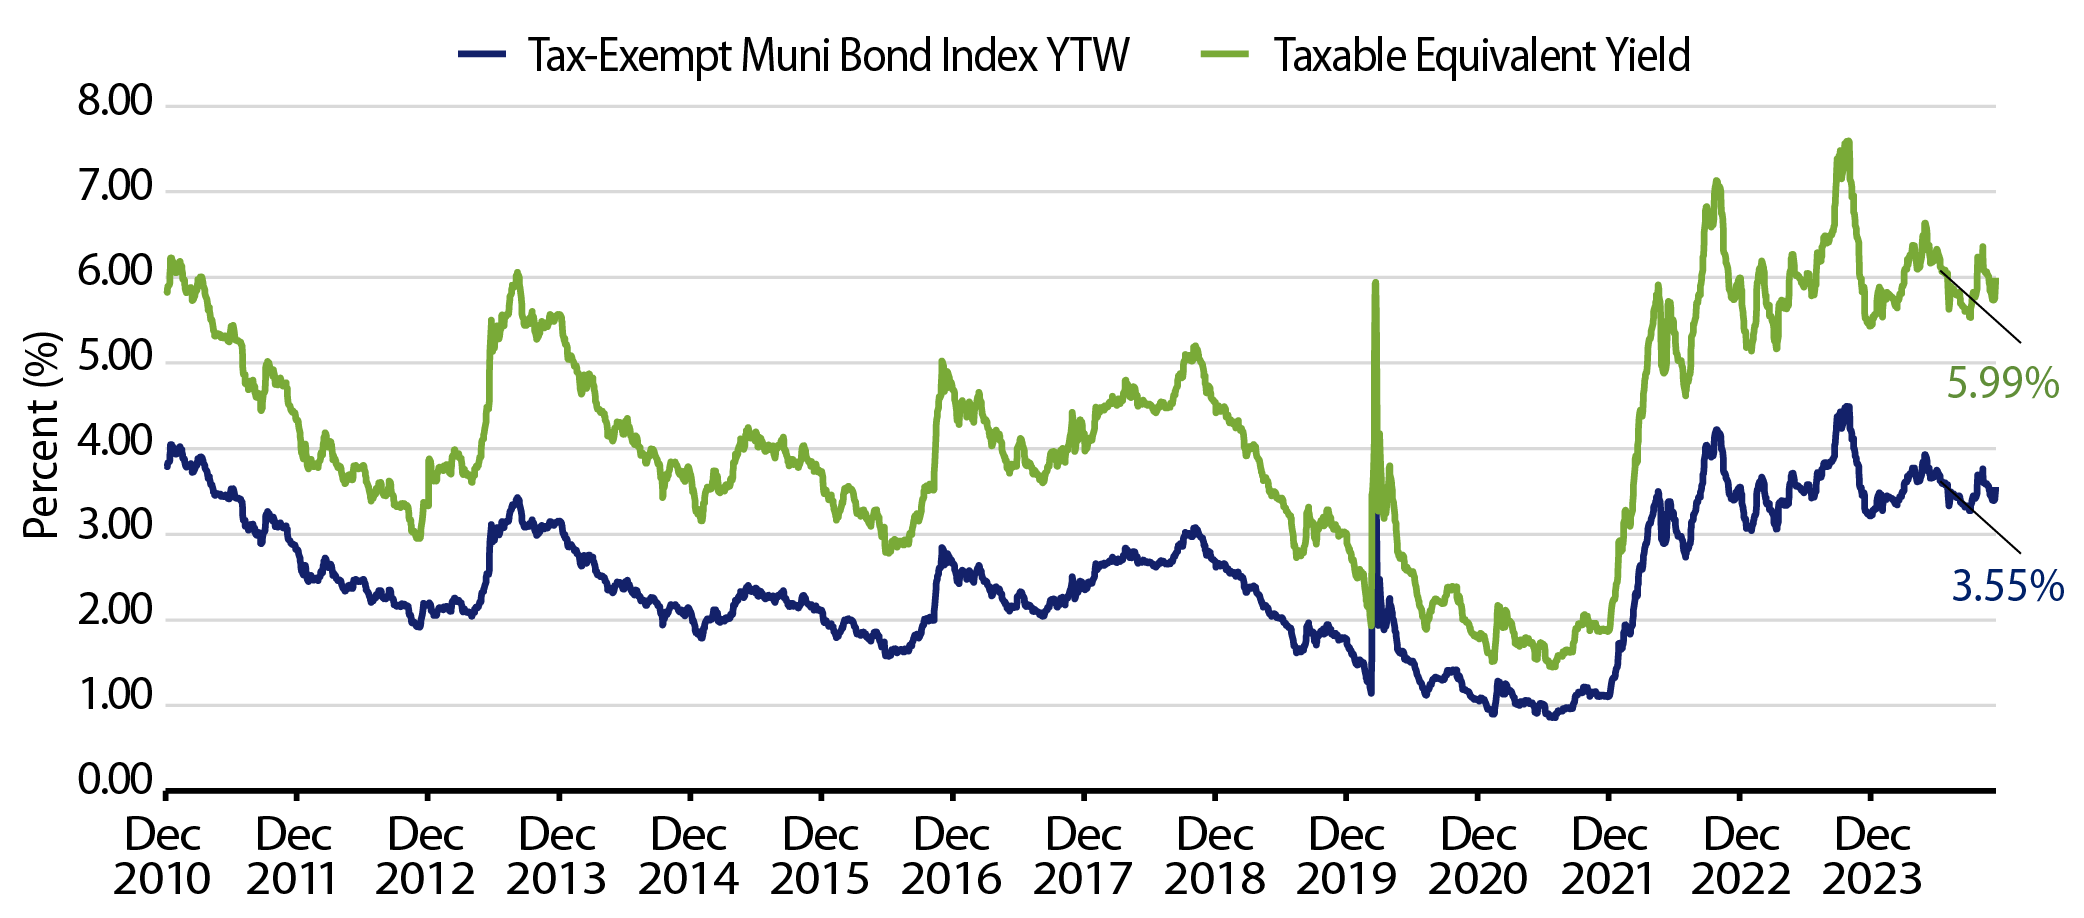
Theme #1: Municipal taxable-equivalent yields remain above decade averages.
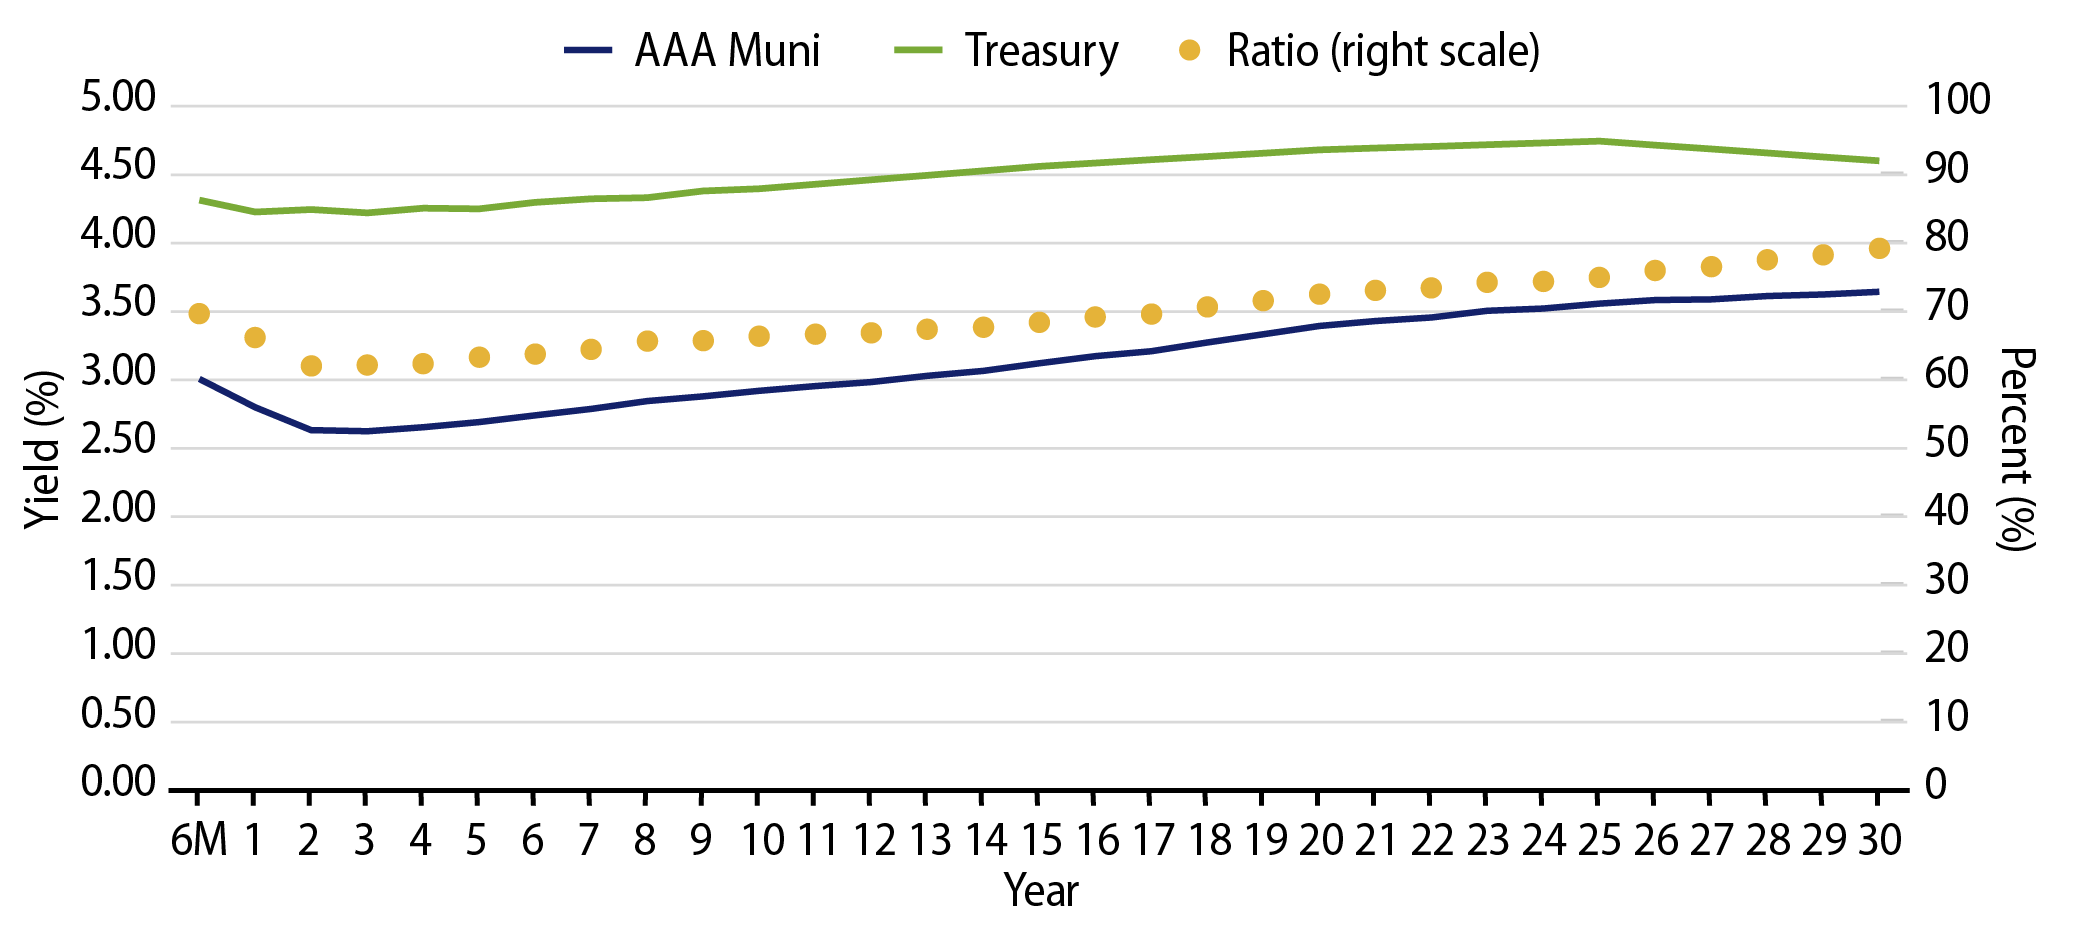
Theme #2: A slight inversion in short maturities underscores the potential value in longer maturities.
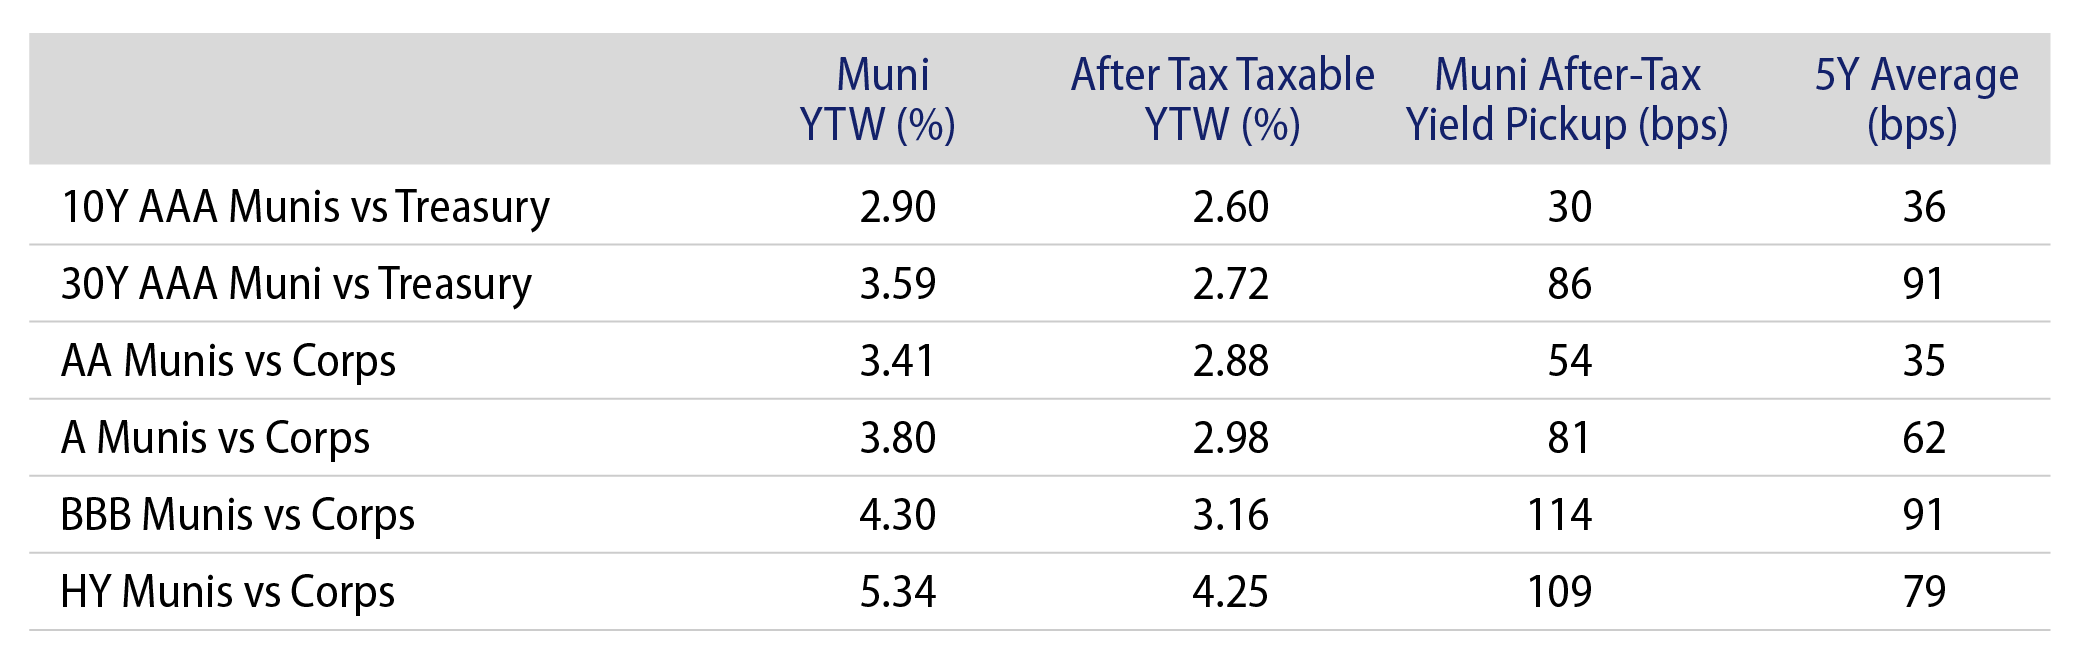
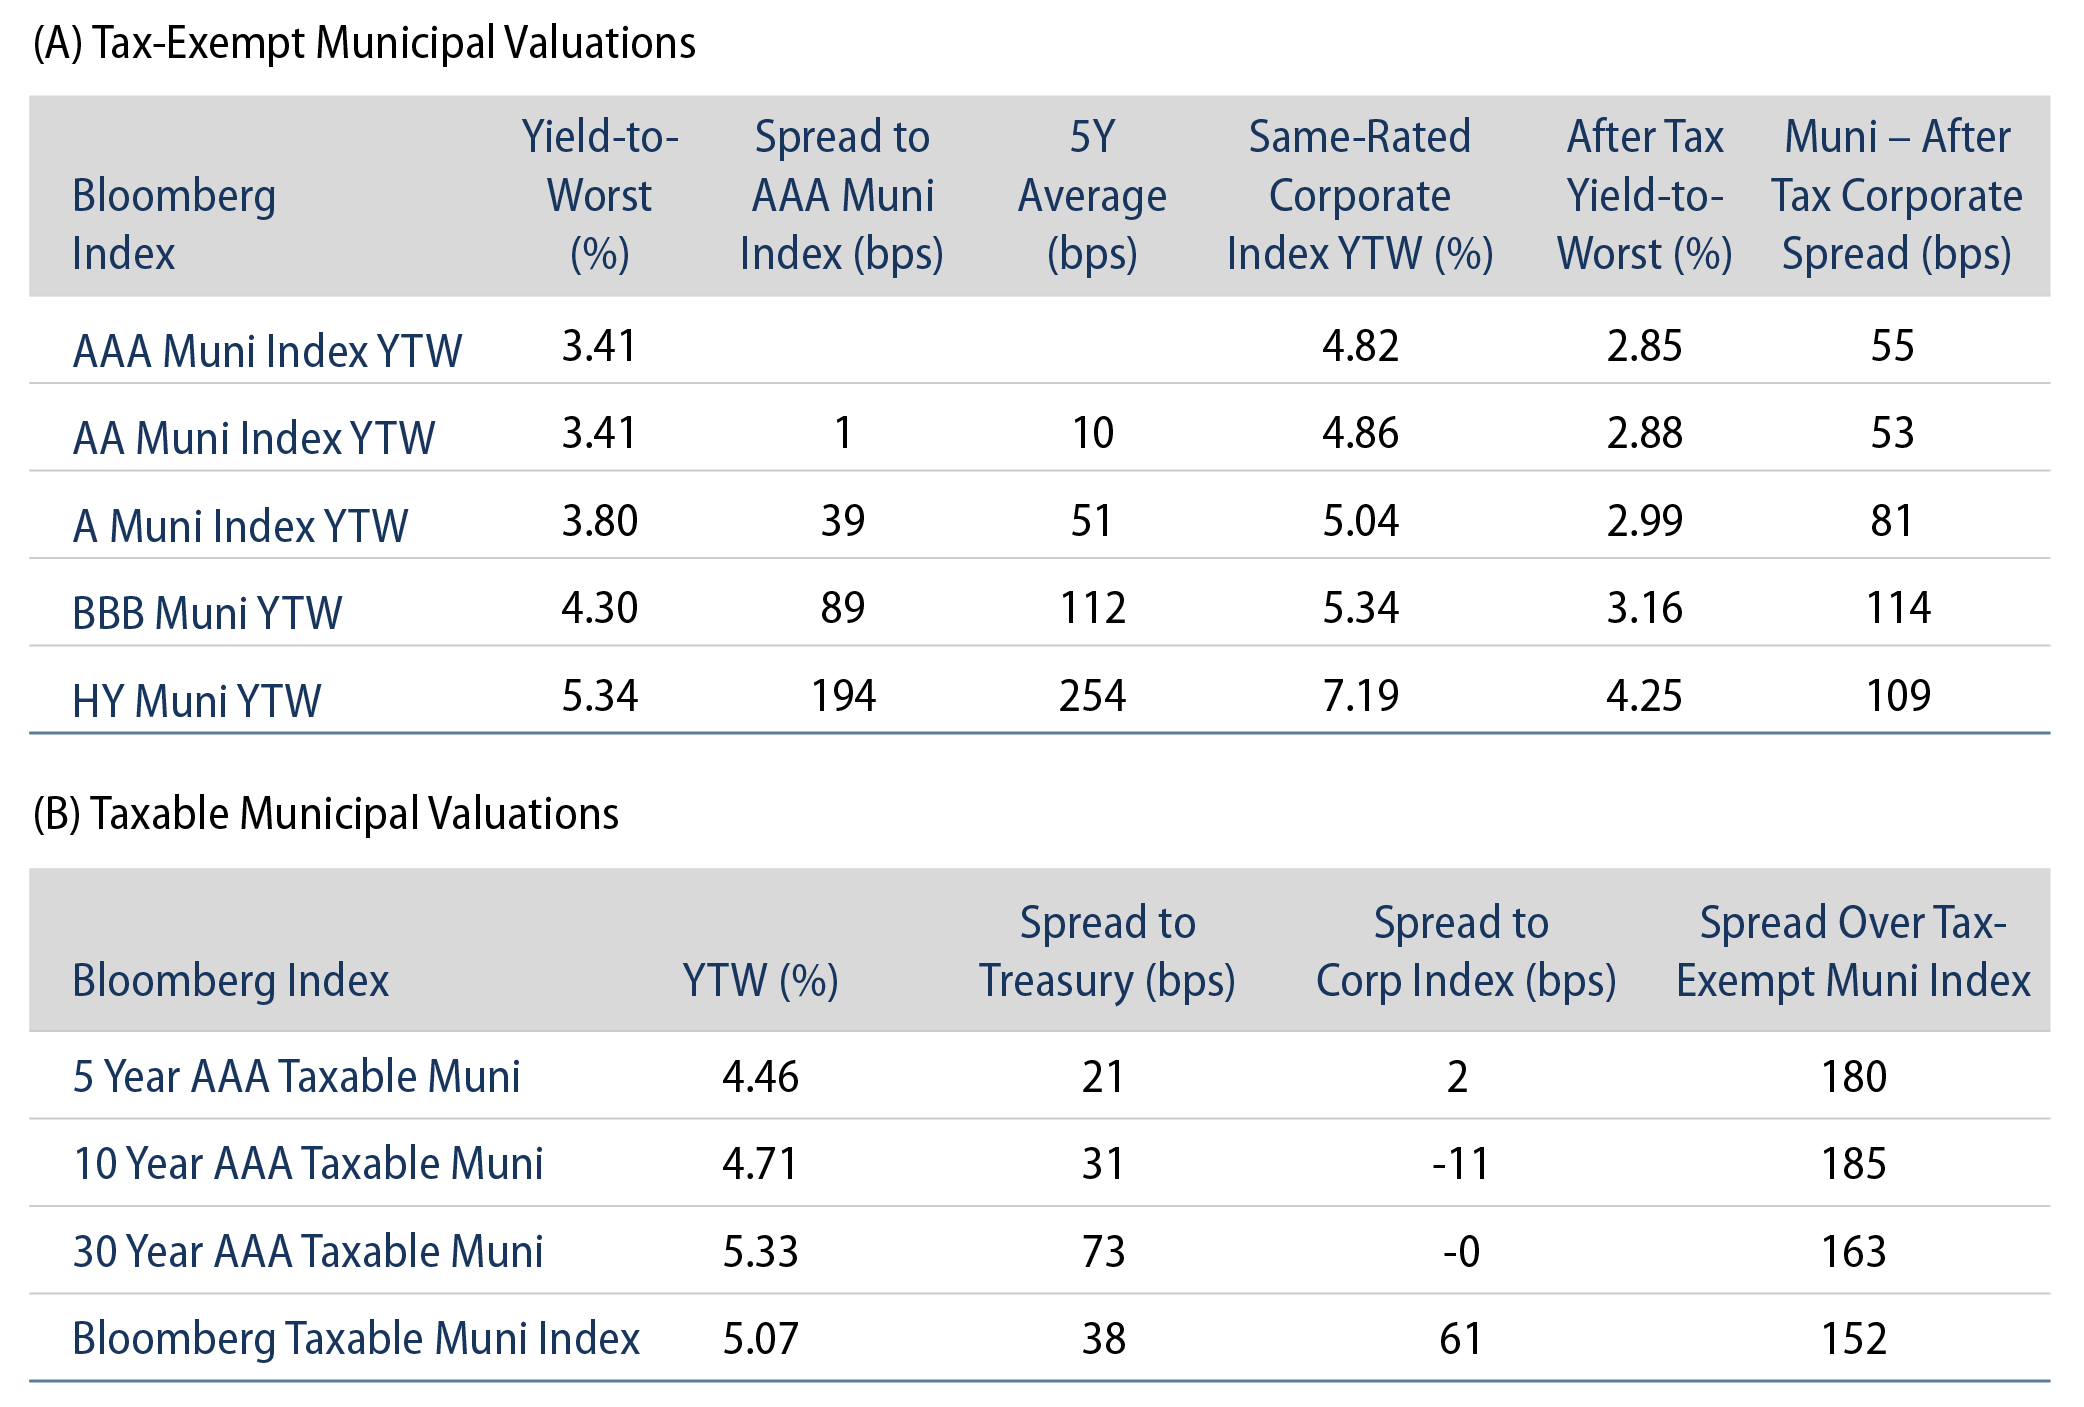
Theme #3: Munis offer attractive after-tax yield pickup versus longer-dated Treasuries and investment-grade corporate credit.