
Munis Posted Positive Returns Last Week
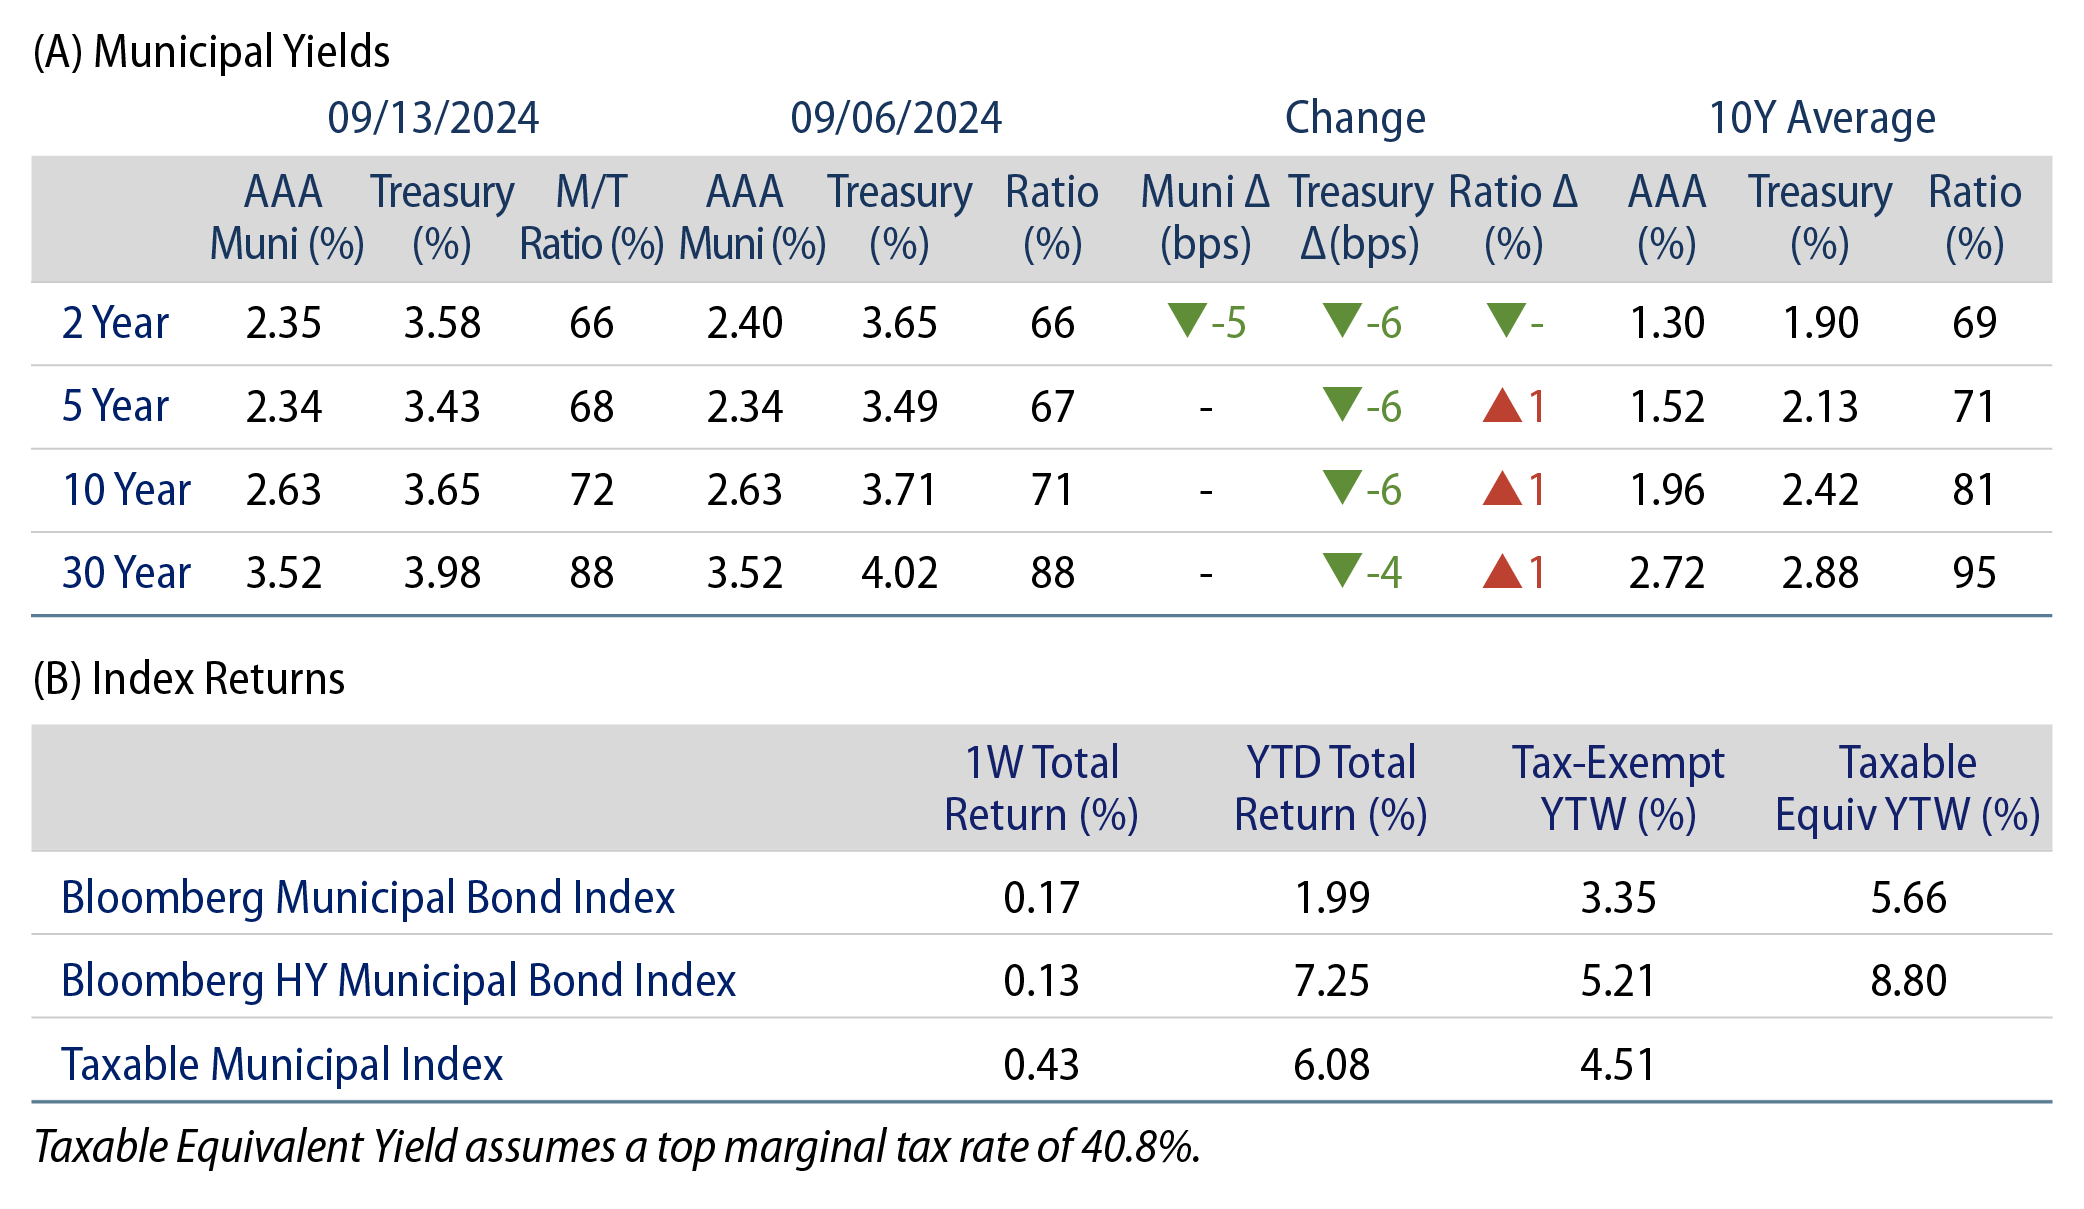
Municipals posted positive returns last week, underperforming Treasuries, which moved lower despite relatively hotter than anticipated Consumer Price Index (CPI) and Producer Price Index (PPI) data. Meanwhile, high-grade muni yields moved just 5 basis points (bps) lower in short maturities, and supply and demand trends remained elevated. The Bloomberg Municipal Index returned 0.17% during the week, the High Yield Muni Index returned 0.13% and the Taxable Muni Index returned 0.43%. This week we provide an update on state and local tax collection estimates released last week.
Supply and Inflows Remained Elevated
Fund Flows (up $1.3 billion): During the week ending September 11, weekly reporting municipal mutual funds recorded $1.3 billion of net inflows, according to Lipper. Long-term funds recorded $967 million of inflows, short-term funds recorded $242 million of inflows and intermediate funds recorded $83 of inflows, and high-yield funds recorded $360 million of inflows. This week’s inflows mark an 11th consecutive week of inflows and lead estimated year-to-date (YTD) net inflows higher to $24 billion.
Supply (YTD supply of $351 billion, up 42% YoY): The muni market recorded $15 billion of new-issue volume last week, up 82% from the prior week. YTD issuance of $351 billion is 42% higher than last year’s level, with tax-exempt issuance 46% higher and taxable issuance 8% higher year-over-year (YoY). This week’s calendar is expected to remain elevated at $9 billion. The largest deals include $903 million Black Belt Energy and $635 million Main Street Natural Gas transactions.
This Week in Munis: State and Local Revenue Estimates Spike
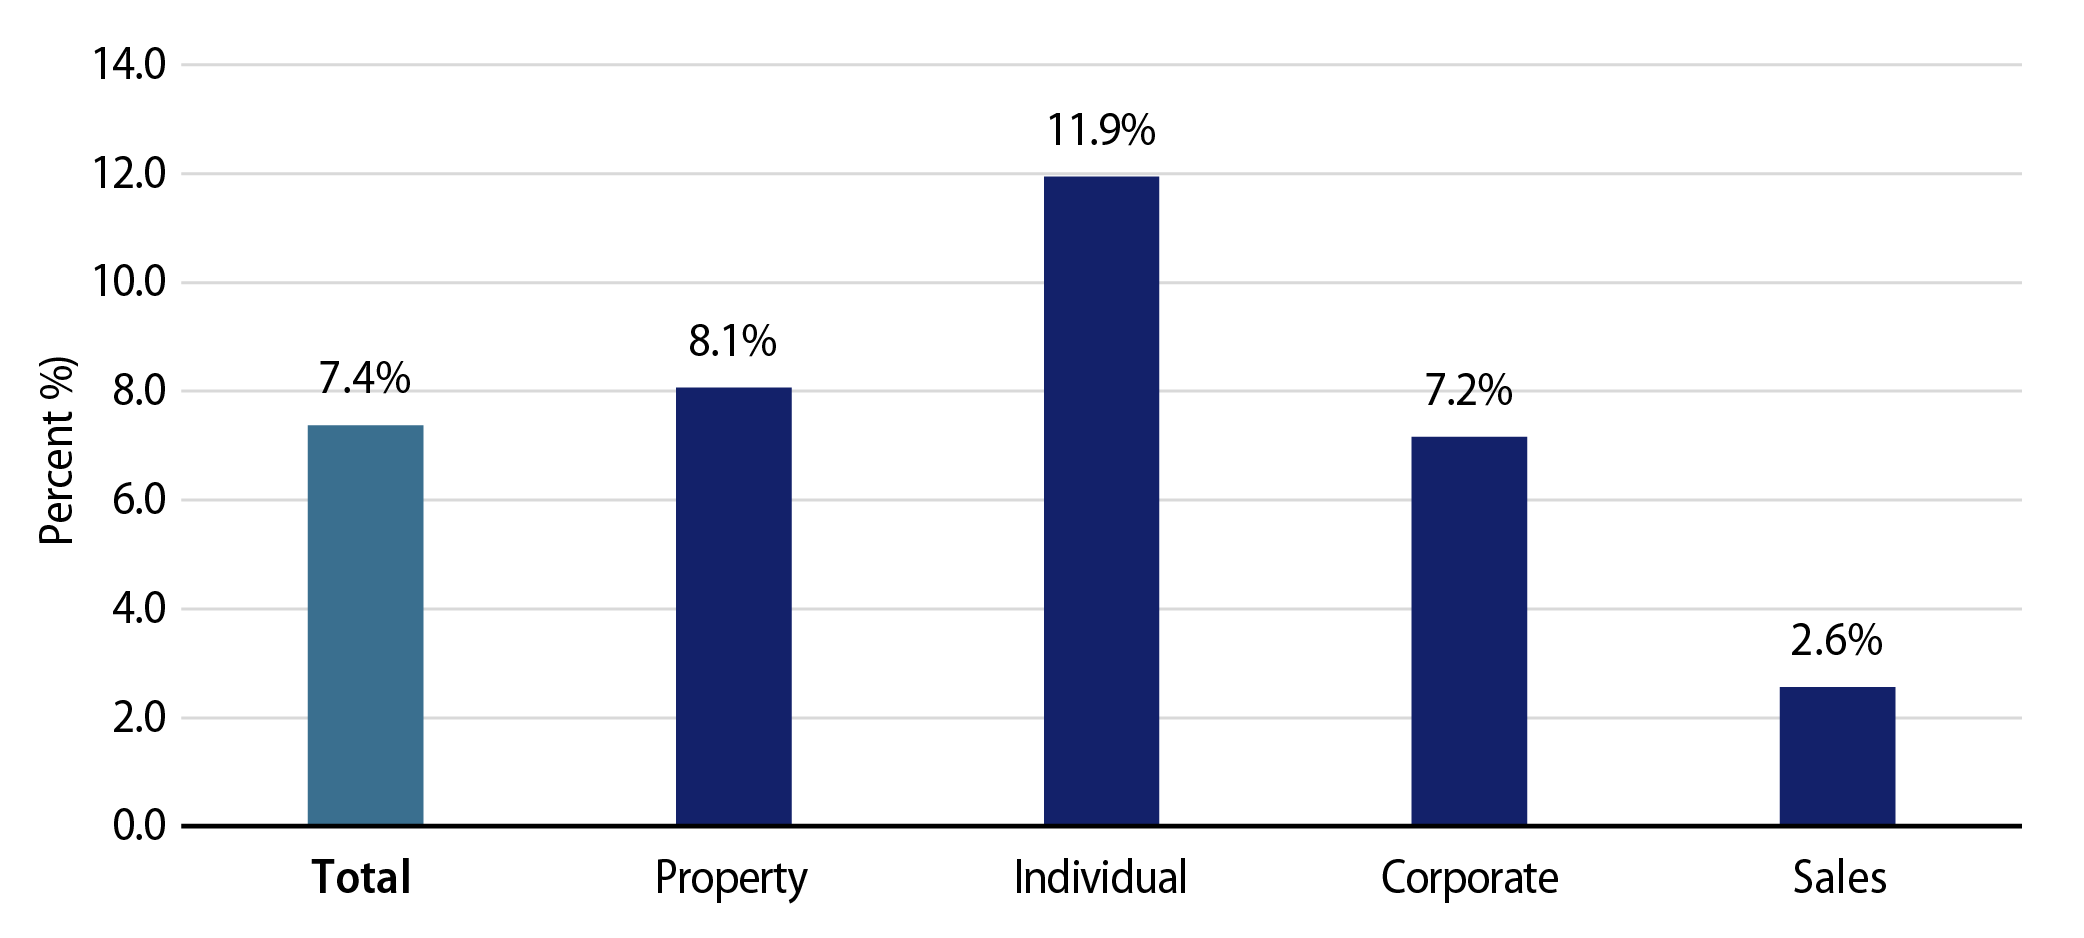
Last week the Census released 2Q24 state and local tax collection estimates, which coincide with the fiscal year-end for many municipalities and continue to reflect strength for municipal credit conditions. Second quarter major state and local government tax collections grew 7.4% from 2Q23 levels and 9.0% from 1Q24 levels to $535 billion. Among the major state revenue sources, individual income taxes increased 11.9%, corporate income tax collections increased 7.2% and sales tax collections increased 2.6% YoY. Property tax collections, the primary source of revenues for local governments, increased 8.1% YoY to $146 billion.
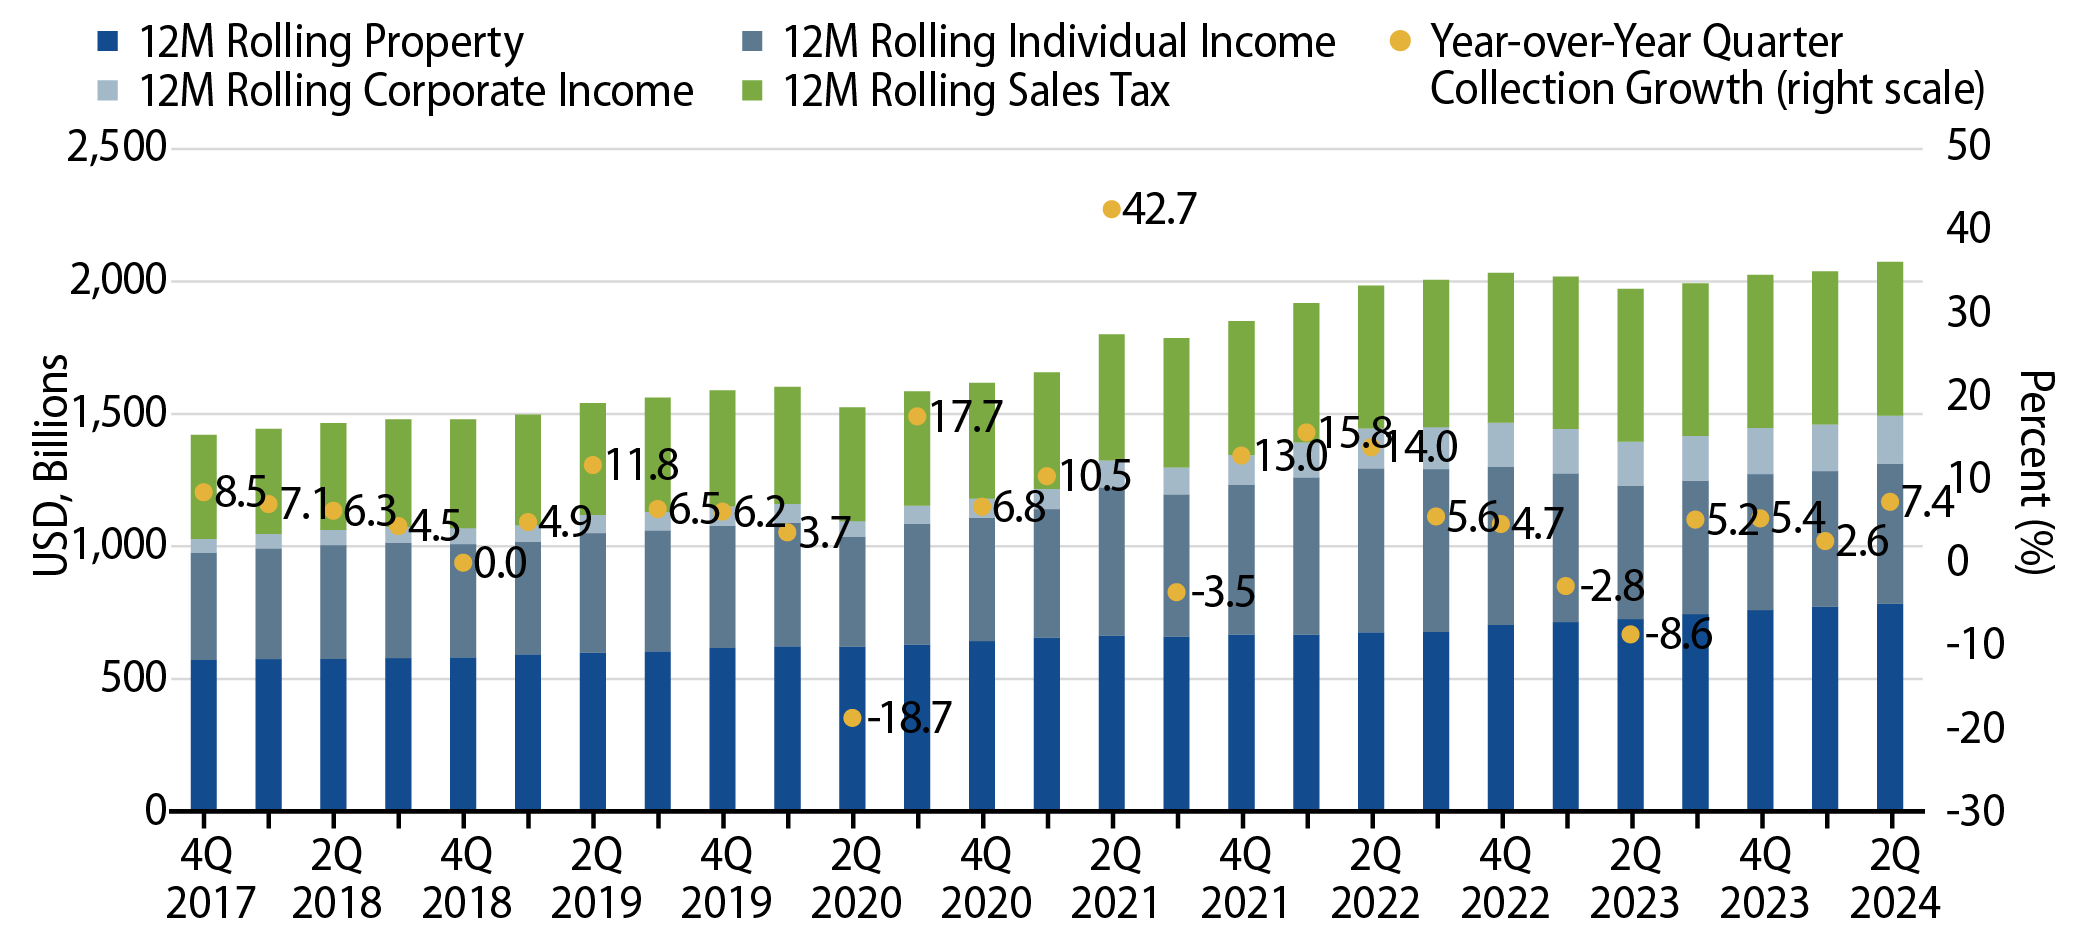
Four-quarter trailing tax collections reflect fiscal 2024 year-end for many municipalities, and increased 5.2% YoY to $2.07 trillion, marking a record high level according to the Census data. On a 12-month trailing basis, individual income tax collections increased 4.9% YoY, corporate income tax collections increased 8.2% YoY, and sales tax collections increased 0.9% YoY. 12-month rolling property tax collections also recorded a strong trend higher, growing 8.1% YoY.
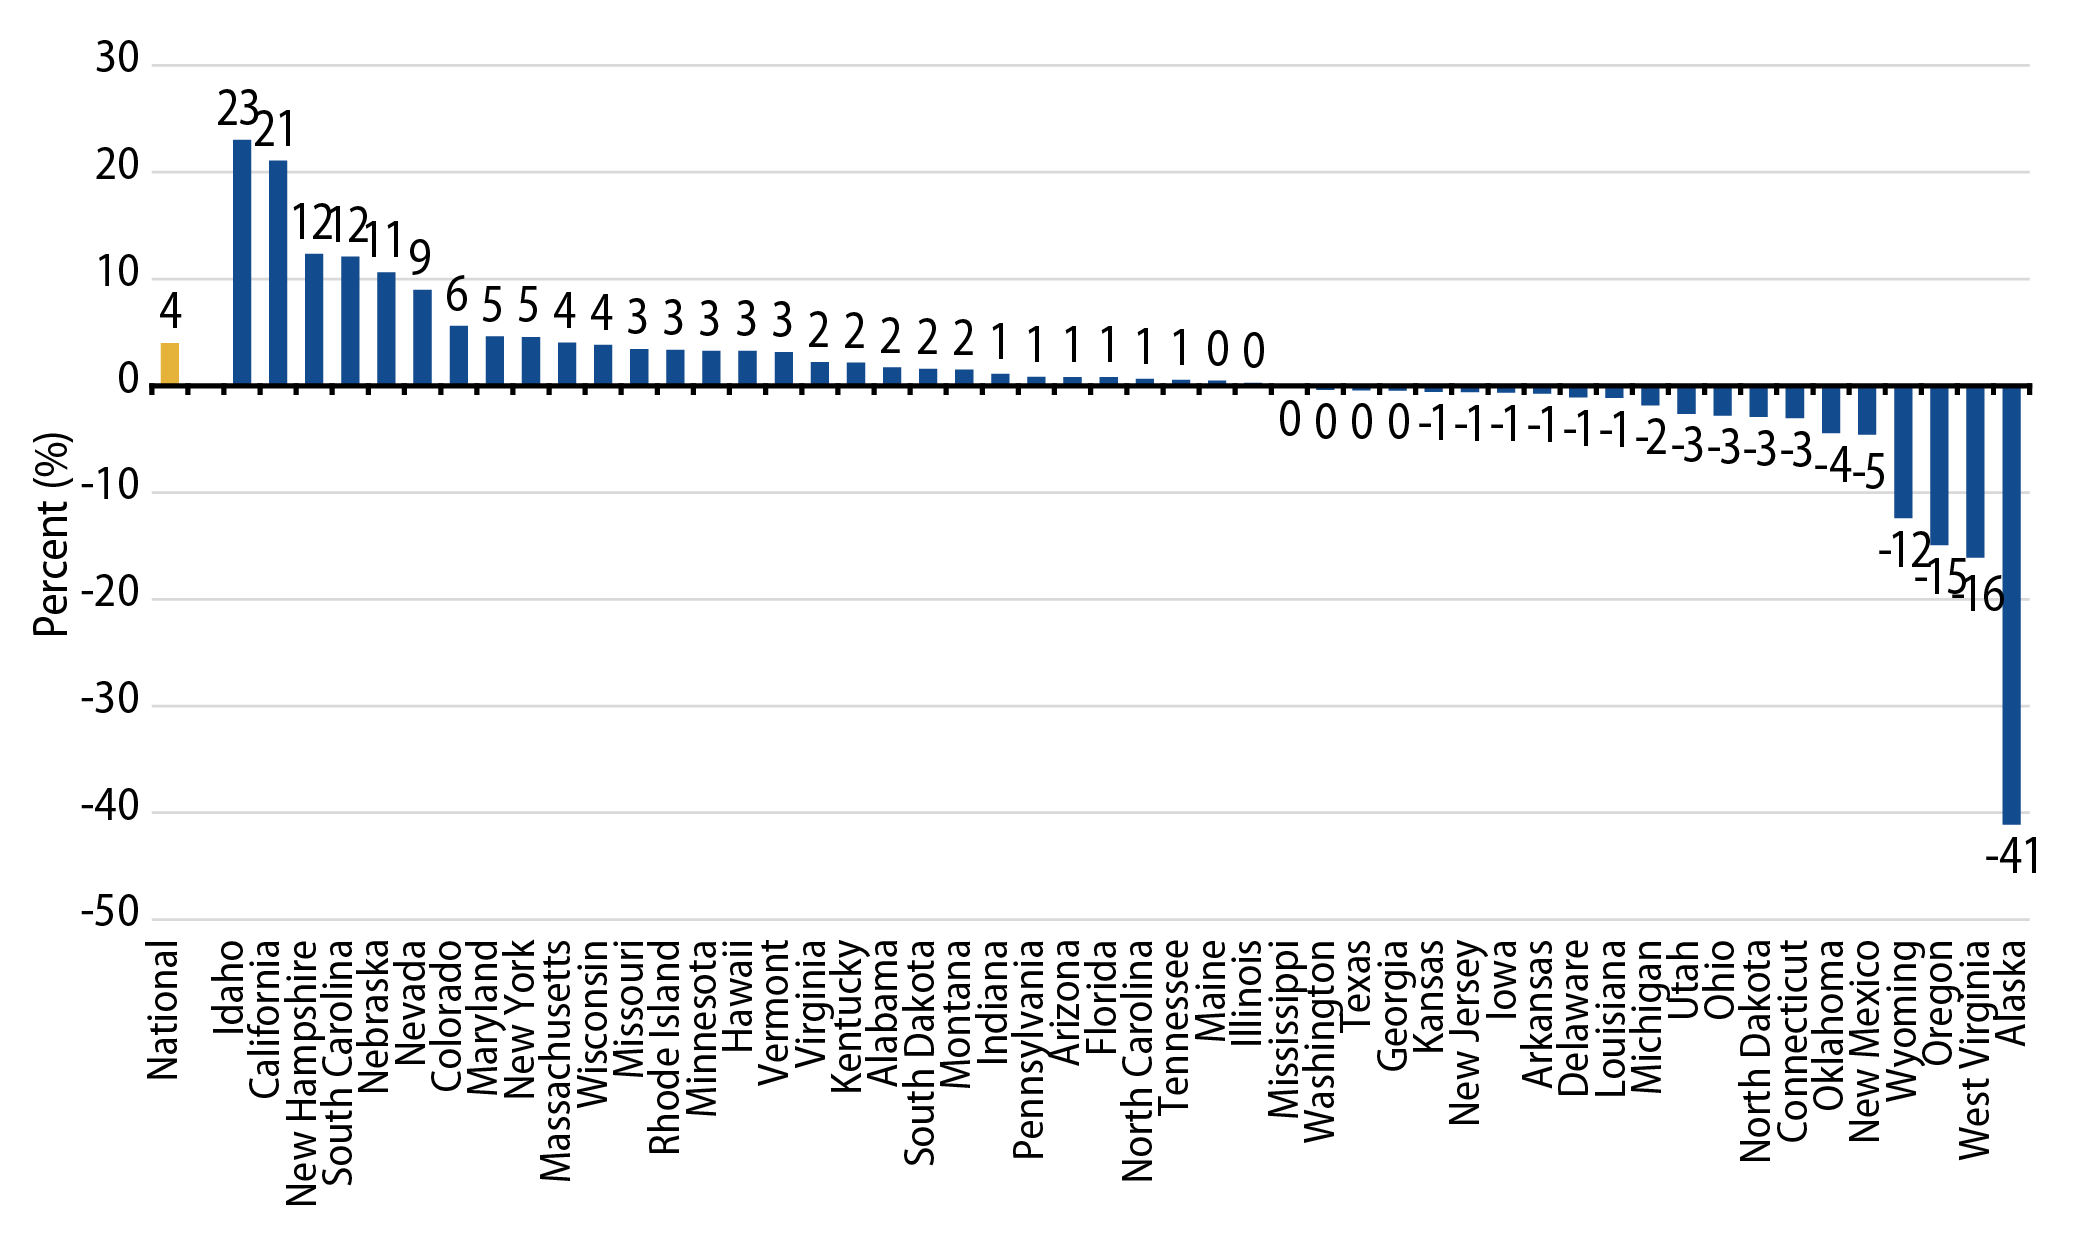
From a state perspective, the Census estimates that the majority of states recorded revenue increases in the four quarters ending June 30, and average state revenues increased 4.0% during the year. On a YoY basis, Idaho (+23%), California (+21%) and New Hampshire (+10%) recorded the highest growth in estimated tax revenue, while Alaska (-41%), West Virginia (-16%) and Oregon (-15%) recorded the greatest tax collection declines.
The continued growth of tax collections highlights the strength of municipal credit, despite signs of slower economic growth. We expect a strong labor market and consumer to support tax collections as well as municipal credit conditions over the medium term and believe these conditions will support lower investment-grade debt into potentially favorable supply and demand technical conditions into the end of the year.
Municipal Credit Curves and Relative Value
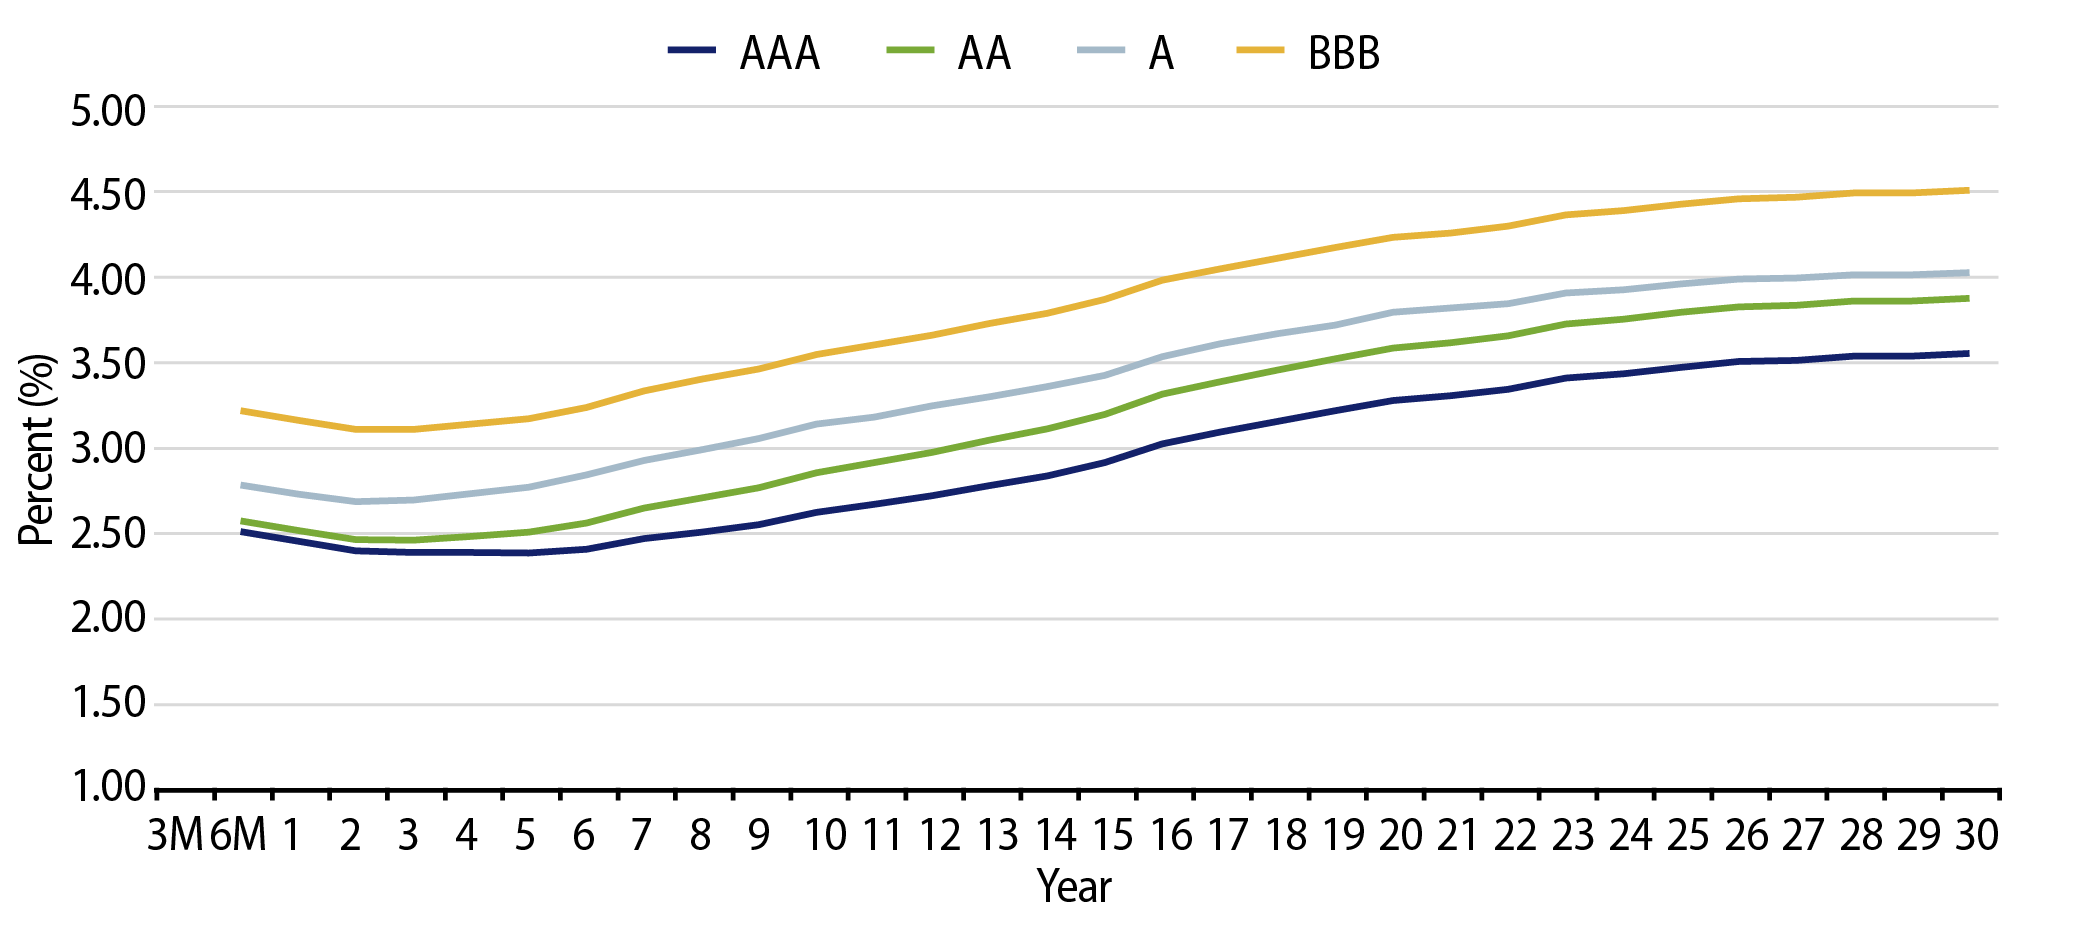
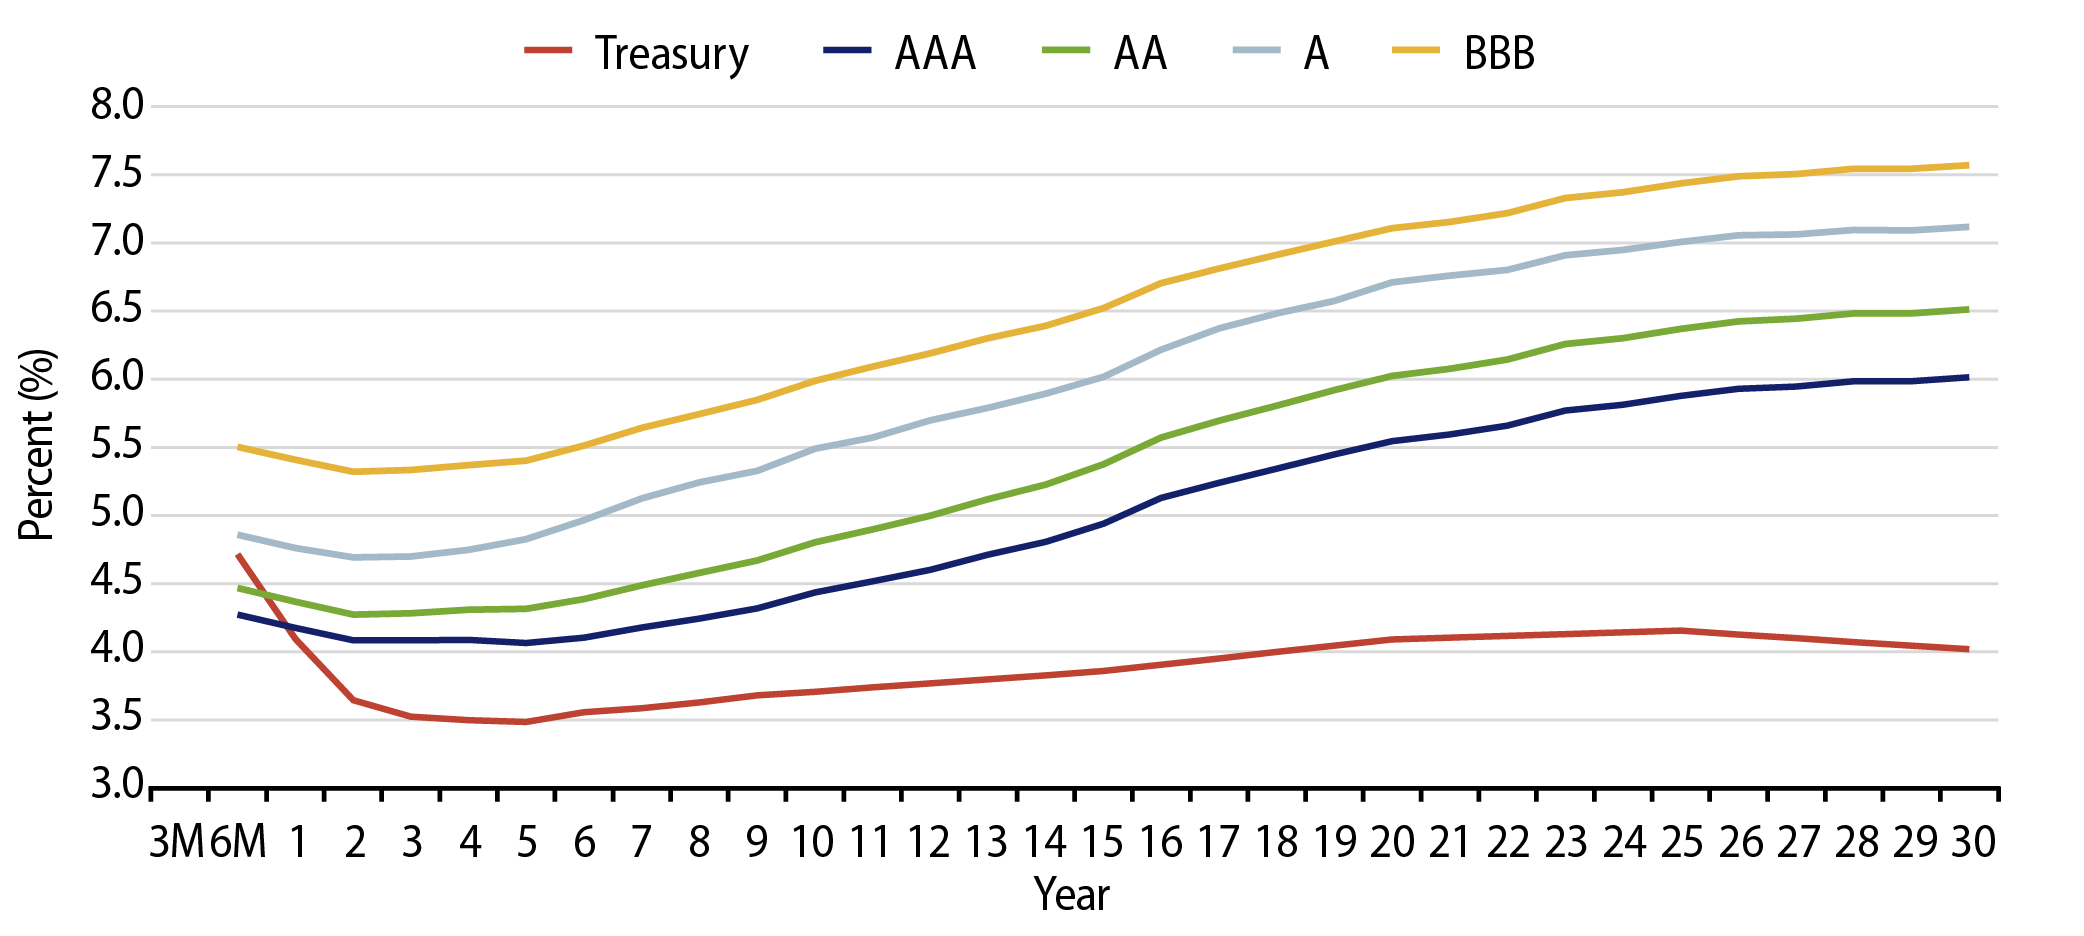
Theme #1: Municipal taxable-equivalent yields and income opportunities are above decade averages.

Theme #2: The muni yield curve has disinverted in recent weeks, offering better rolldown opportunity in intermediate maturities.

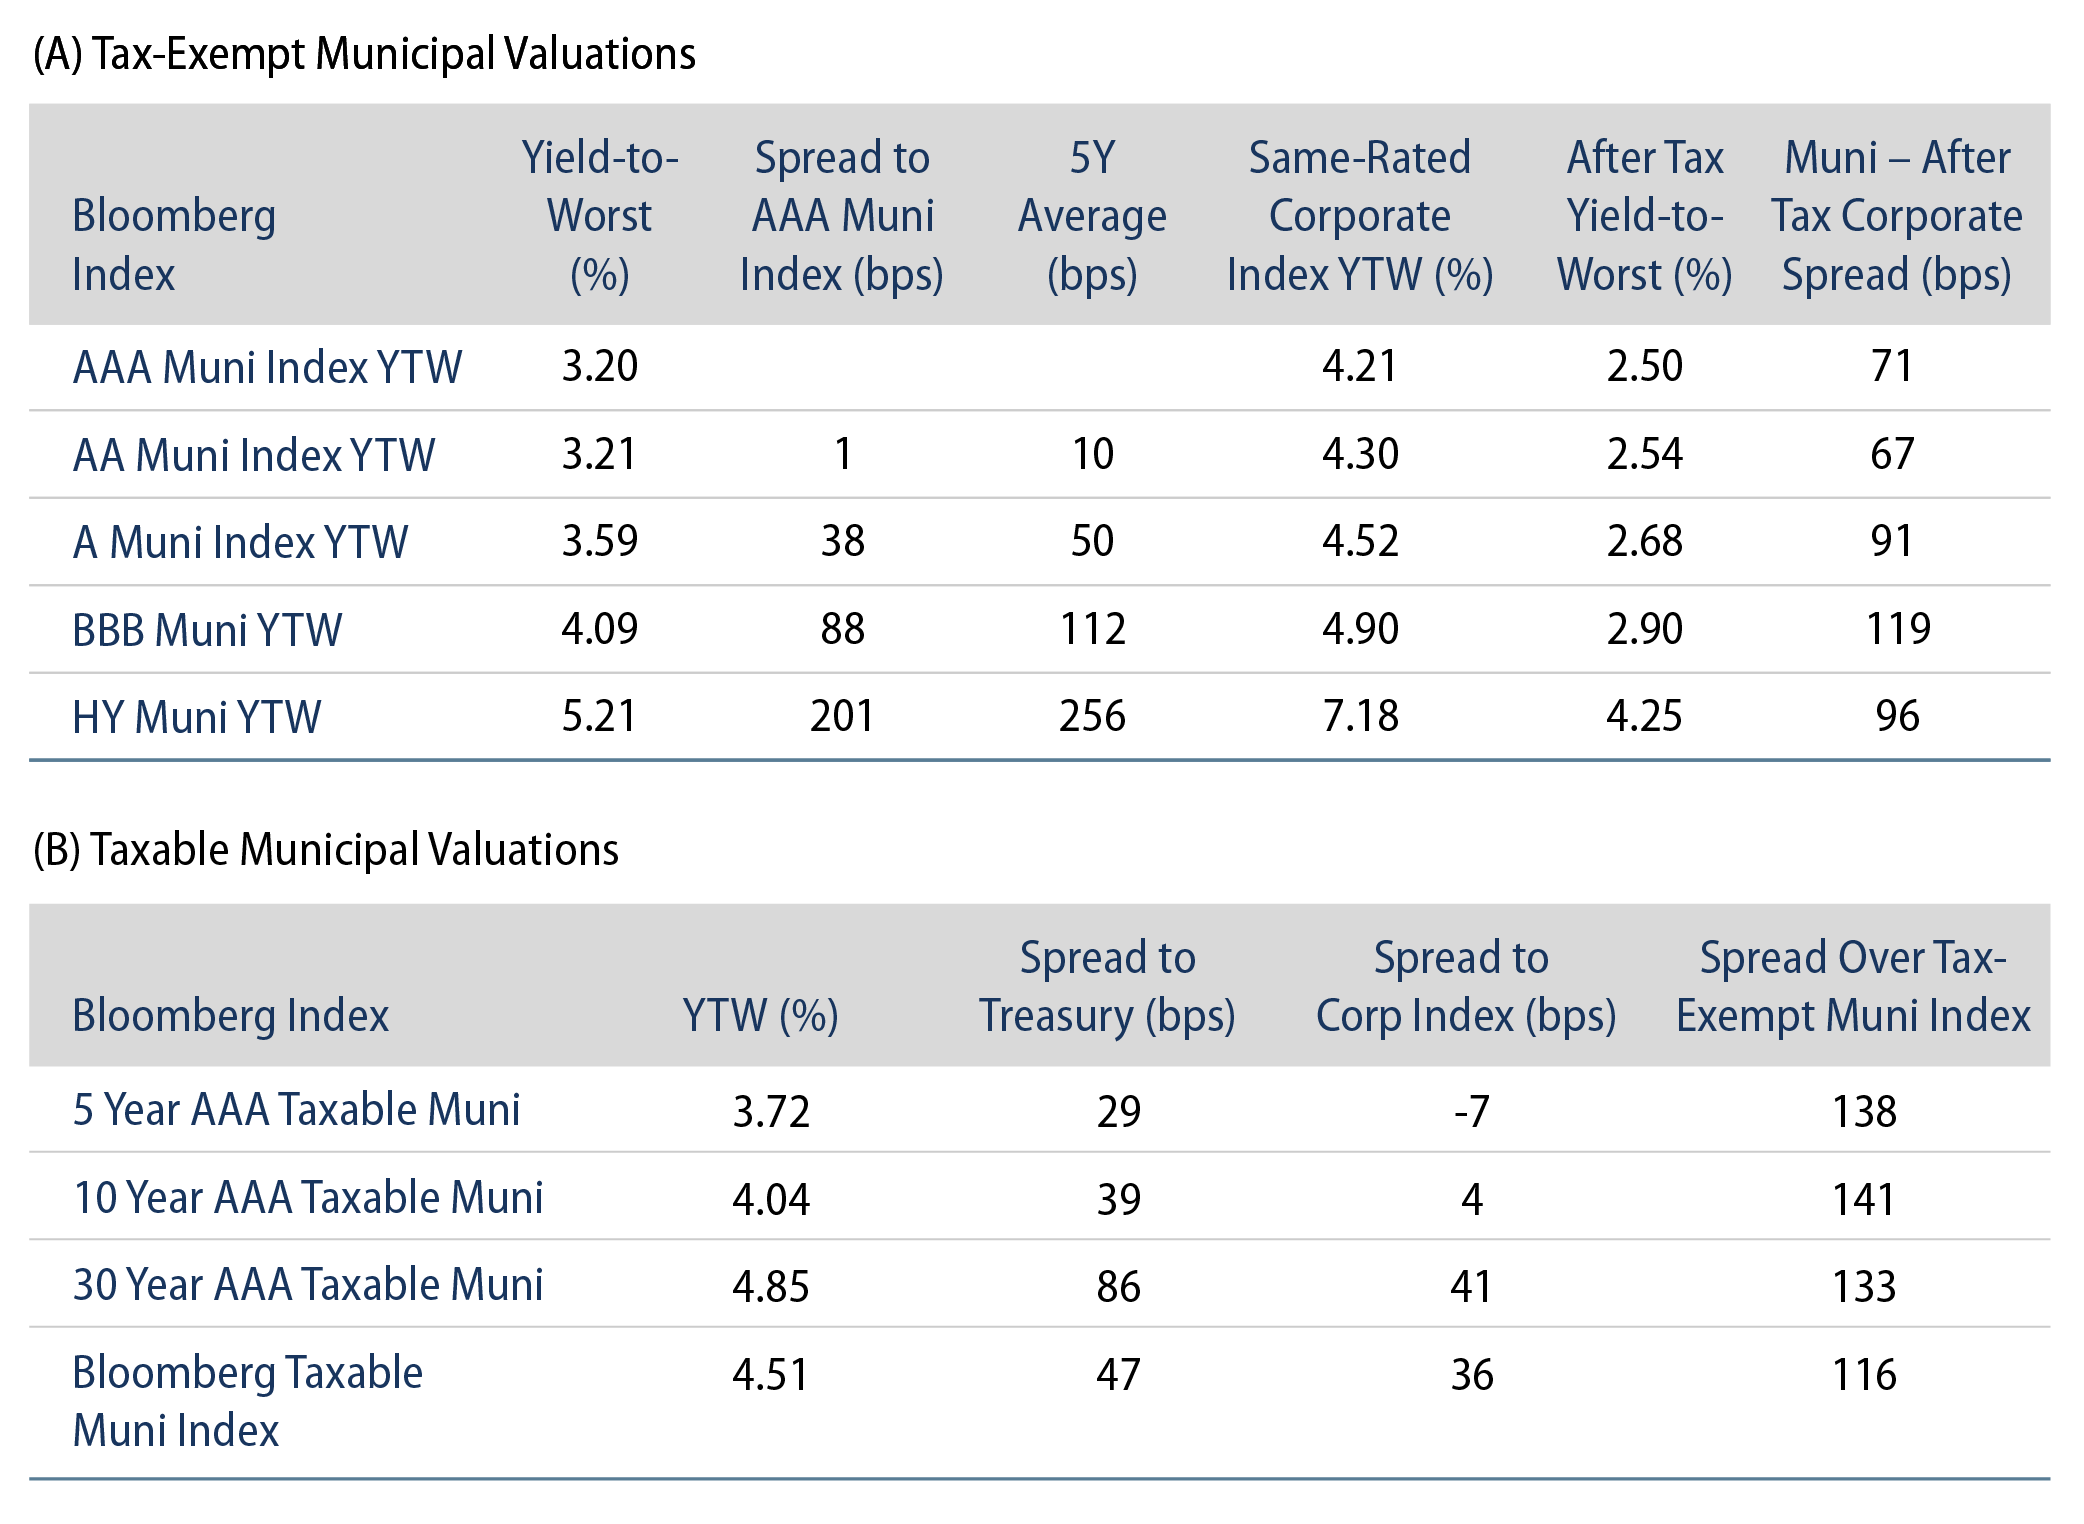
Theme #3: Munis offer attractive after-tax yield pickup versus longer-dated Treasuries and investment-grade corporate credit.
