Macros, Markets and Munis
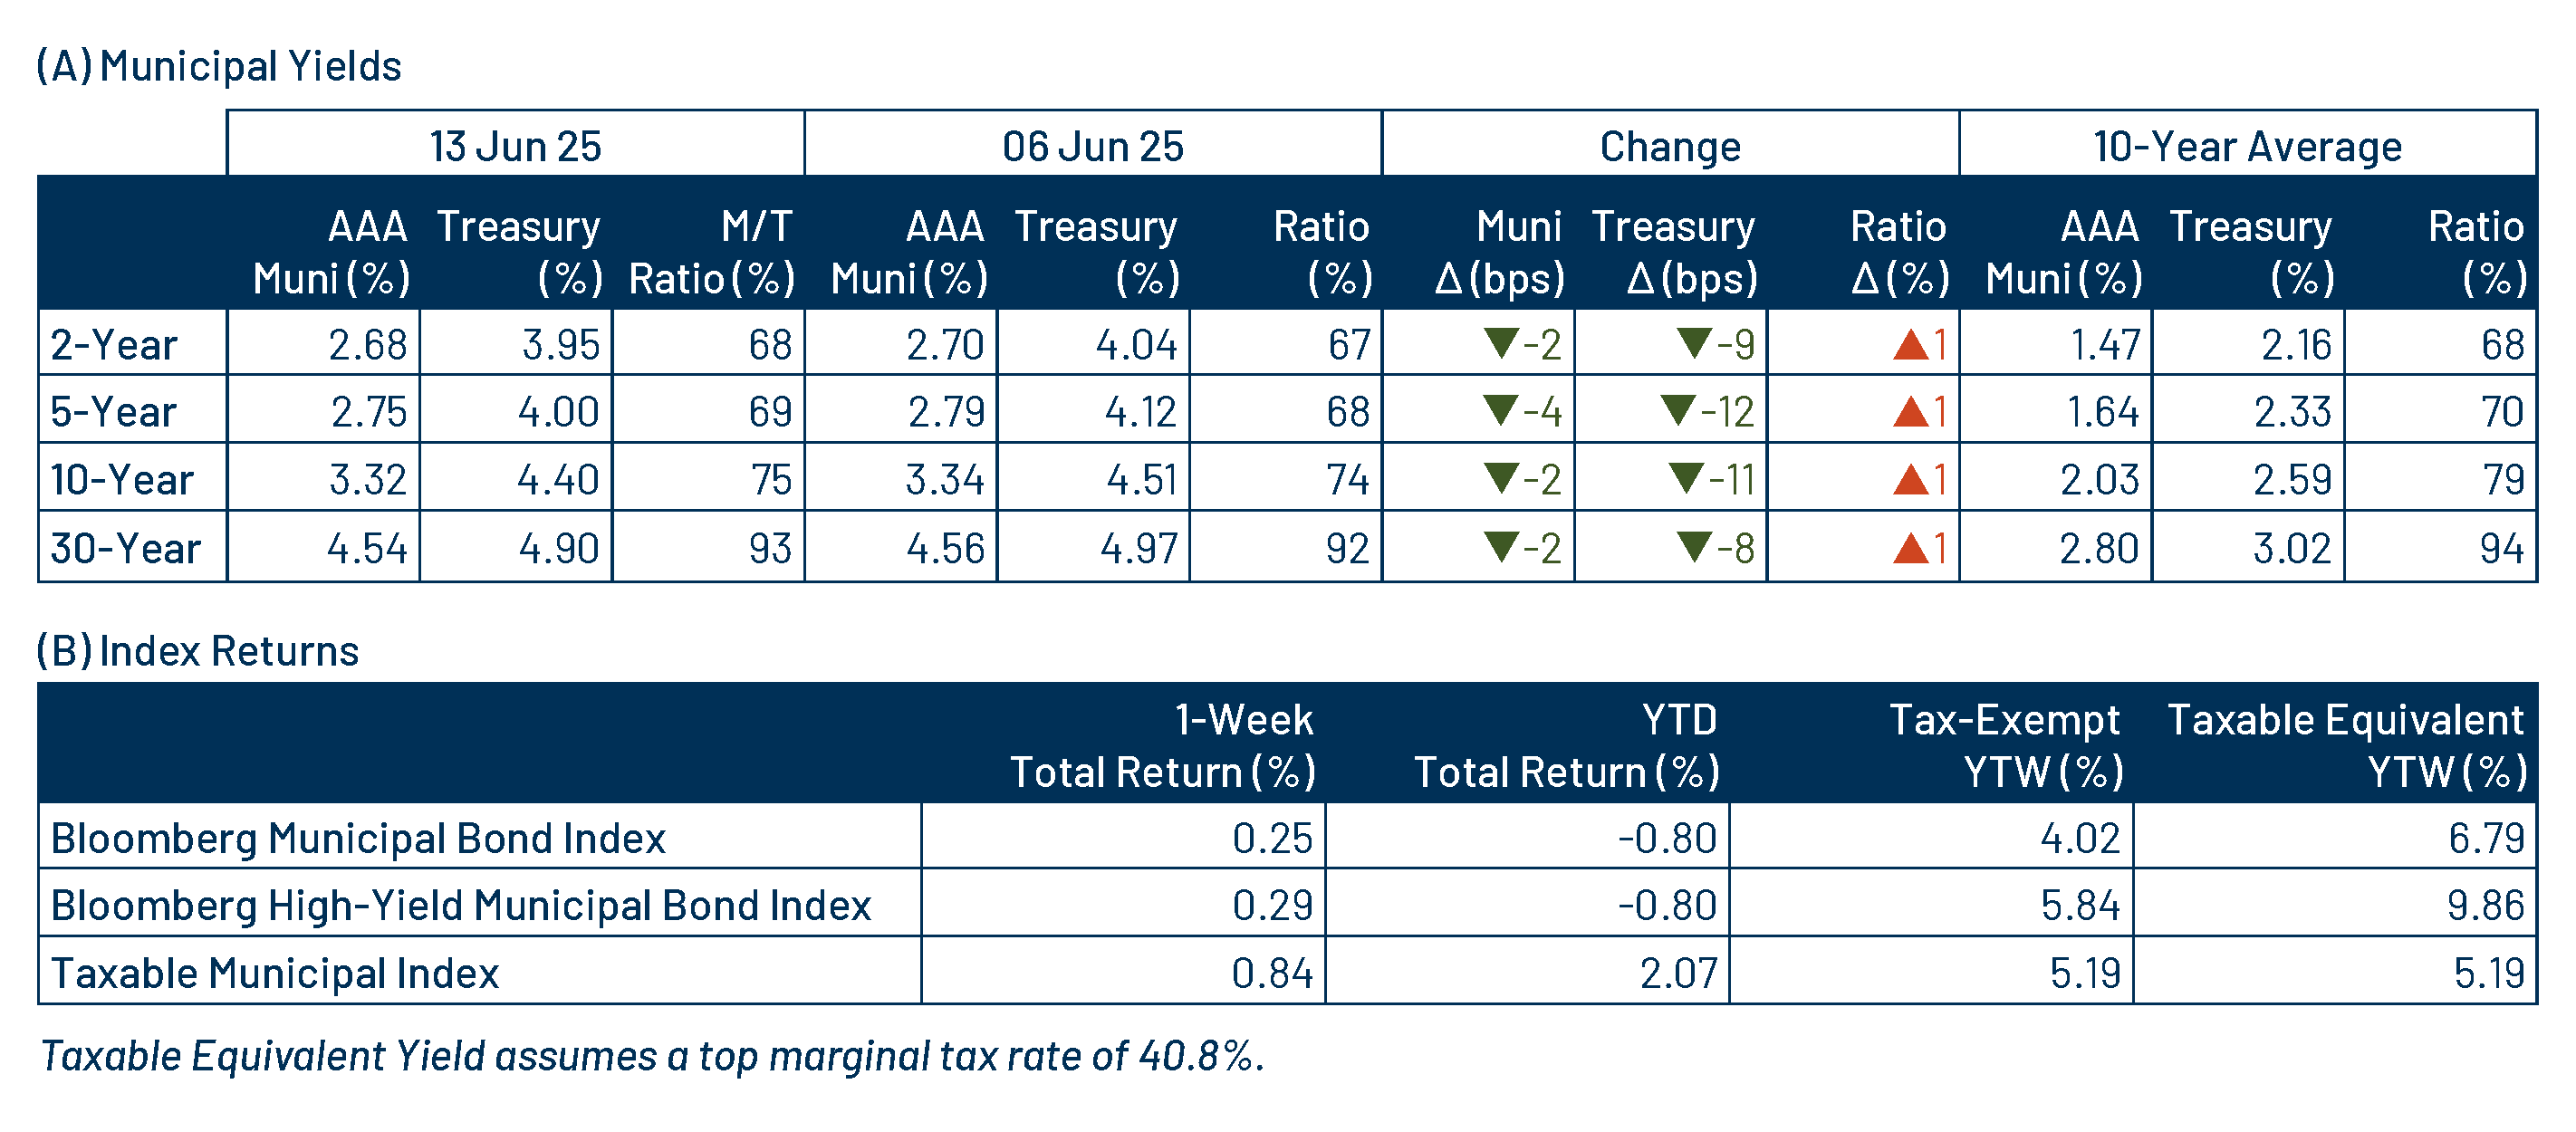
Municipals posted positive returns last week as Treasury yields moved 8-12 basis points (bps) lower across the curve. The highest-grade muni yields continued to underperform, moving 2-4 bps lower amid robust supply conditions. In fact, muni supply remained near record levels as funds recorded inflows again last week. Positive sentiment in fixed-income markets followed soft inflation and jobs data last week, as May’s Consumer Price Index (CPI) came in at 0.1% month-over-month, which was below expectations of 0.2%. Meanwhile, initial jobless claims data crept higher than prior levels and expectations. This week we highlight state and local revenue data released by the Census earlier this month.
Muni Issuance Remained Near Record High Levels Amid Modest Inflows
Fund Flows (up $523 million): During the week ending June 11, weekly reporting municipal mutual funds recorded $523 million of net inflows, according to Lipper. Long-term funds recorded $72 million of outflows, intermediate funds recorded $35 million of inflows and high-yield funds recorded $138 million of inflows. Last week marked a seventh consecutive week of inflows and led year-to-date (YTD) inflows higher to $9 billion.
Supply (YTD supply of $262 billion; up 26% YoY): The muni market recorded over $20 billion of new-issue supply last week, remaining at near record levels according to Bloomberg data. YTD new-issue supply of $262 billion is 26% higher than last year, with tax-exempt issuance up 12% and taxable issuance up 27%, respectively. This week’s calendar is expected to decline to $8 billion. The largest deals include $835 million San Diego Airport Authority and $750 million Southeast Energy Gas Pre-pay (BP Energy) transactions.
This Week in Munis: State and Local Revenues Stay Strong
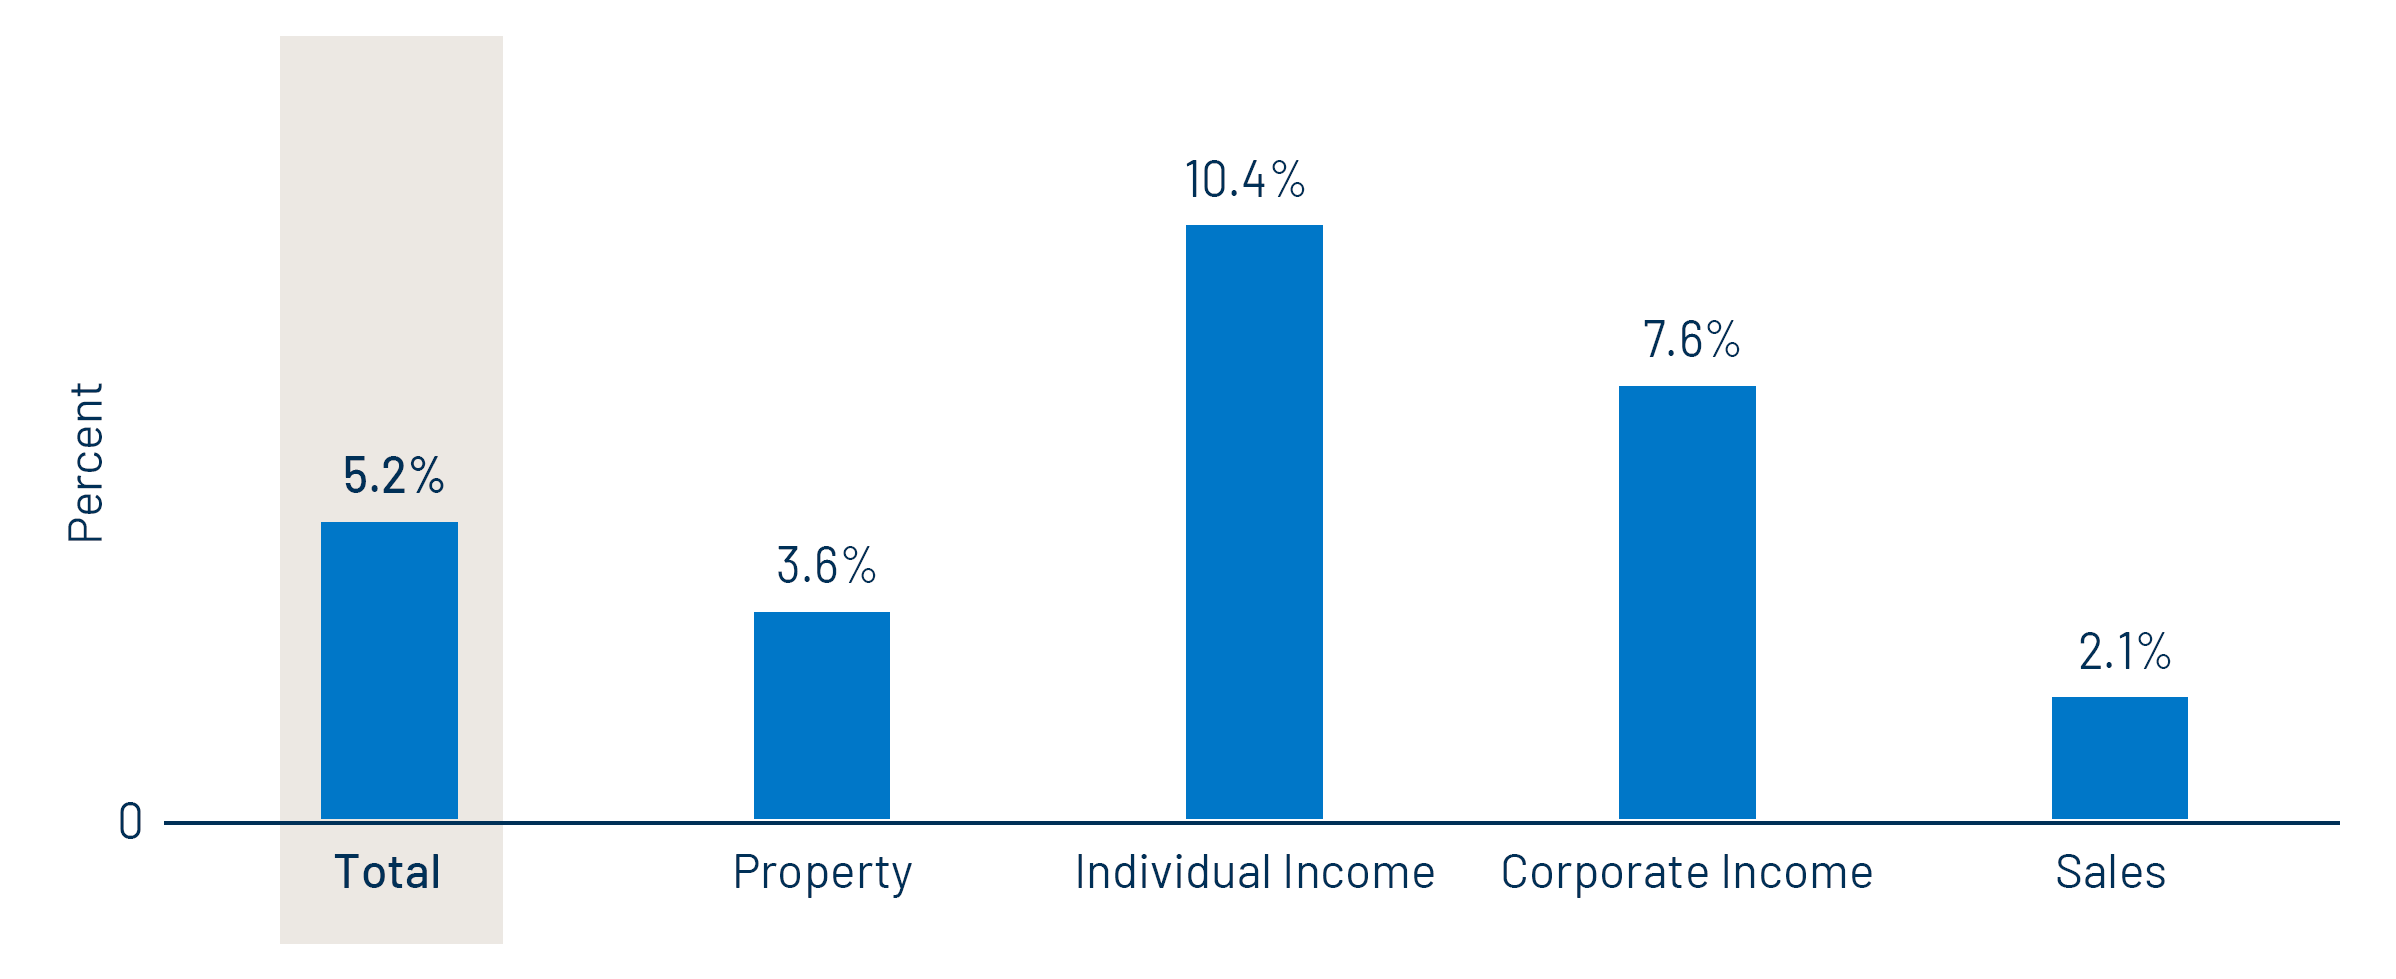
Last week the Census released 1Q25 state and local tax collection estimates, which indicated continued revenue growth for state and local governments. First-quarter major state and local government tax collections increased 2% from 1Q24 levels to $512 billion. Among the major state revenue sources, individual income taxes increased 10%, corporate income tax collections increased 8% and sales tax collections increased 2% YoY. Property tax collections, the primary source of revenues for local governments, increased 4% YoY to $194 billion.
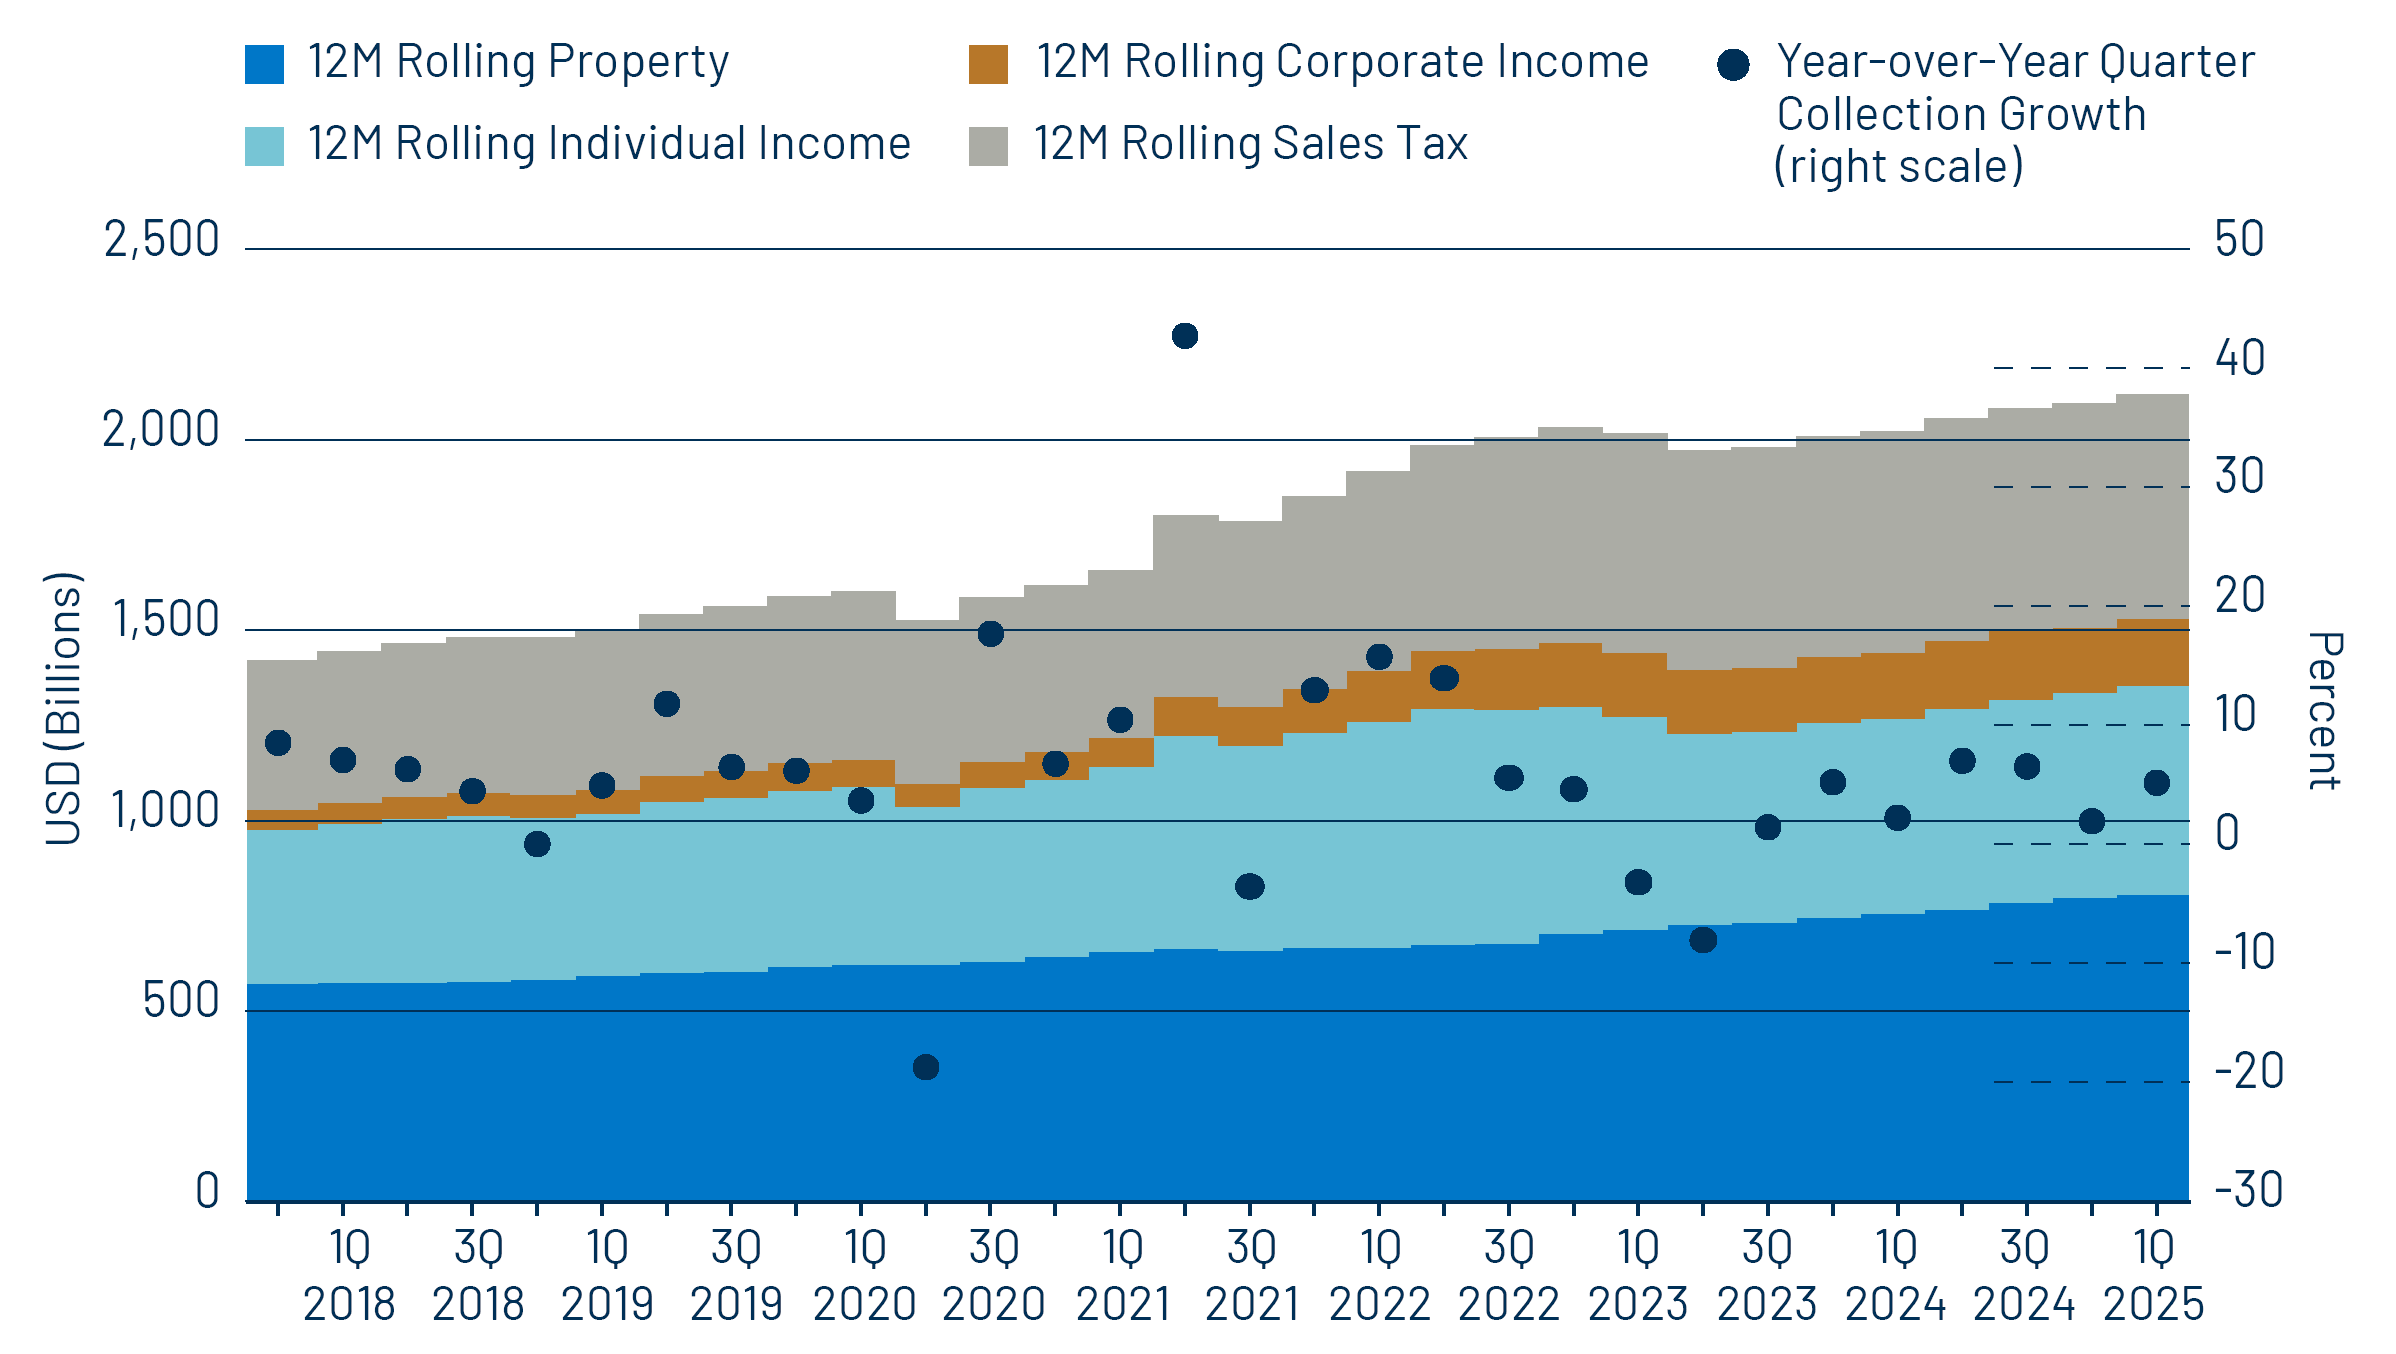
Twelve-month trailing collections increased 5% YoY to $2.1 trillion, marking a record high level according to the Census data. On a 12-month trailing basis, individual income tax collections increased 8% YoY, corporate income tax collections increased 1% YoY and sales tax collections increased 2% YoY. Twelve-month rolling property tax collections also recorded a strong trend higher, growing 7% YoY.
From a state perspective, the Census estimates that most states recorded revenue increases over the trailing 12 months, with total state tax collections increasing 5% during the year. Idaho (+16% YoY), South Carolina (+14%) and California (+13%) recorded the highest growth in estimated tax revenue, while the Census estimated Nebraska (-20%), New Hampshire (-11%) and Wyoming (-10%) recorded the greatest 12-month trailing YoY tax collection declines.

The continued growth of state and local tax collections highlights the strength of municipal credit, despite concerns of slower growth and decreased federal funding. We expect a strong labor market and consumer spending to support tax collections and municipal credit conditions over the medium term. However, we expect the potential for state and local tax collections to be more critical for budgets, particularly if federal spending reductions extend more broadly to state and local budgets.
Municipal Credit Curves and Relative Value
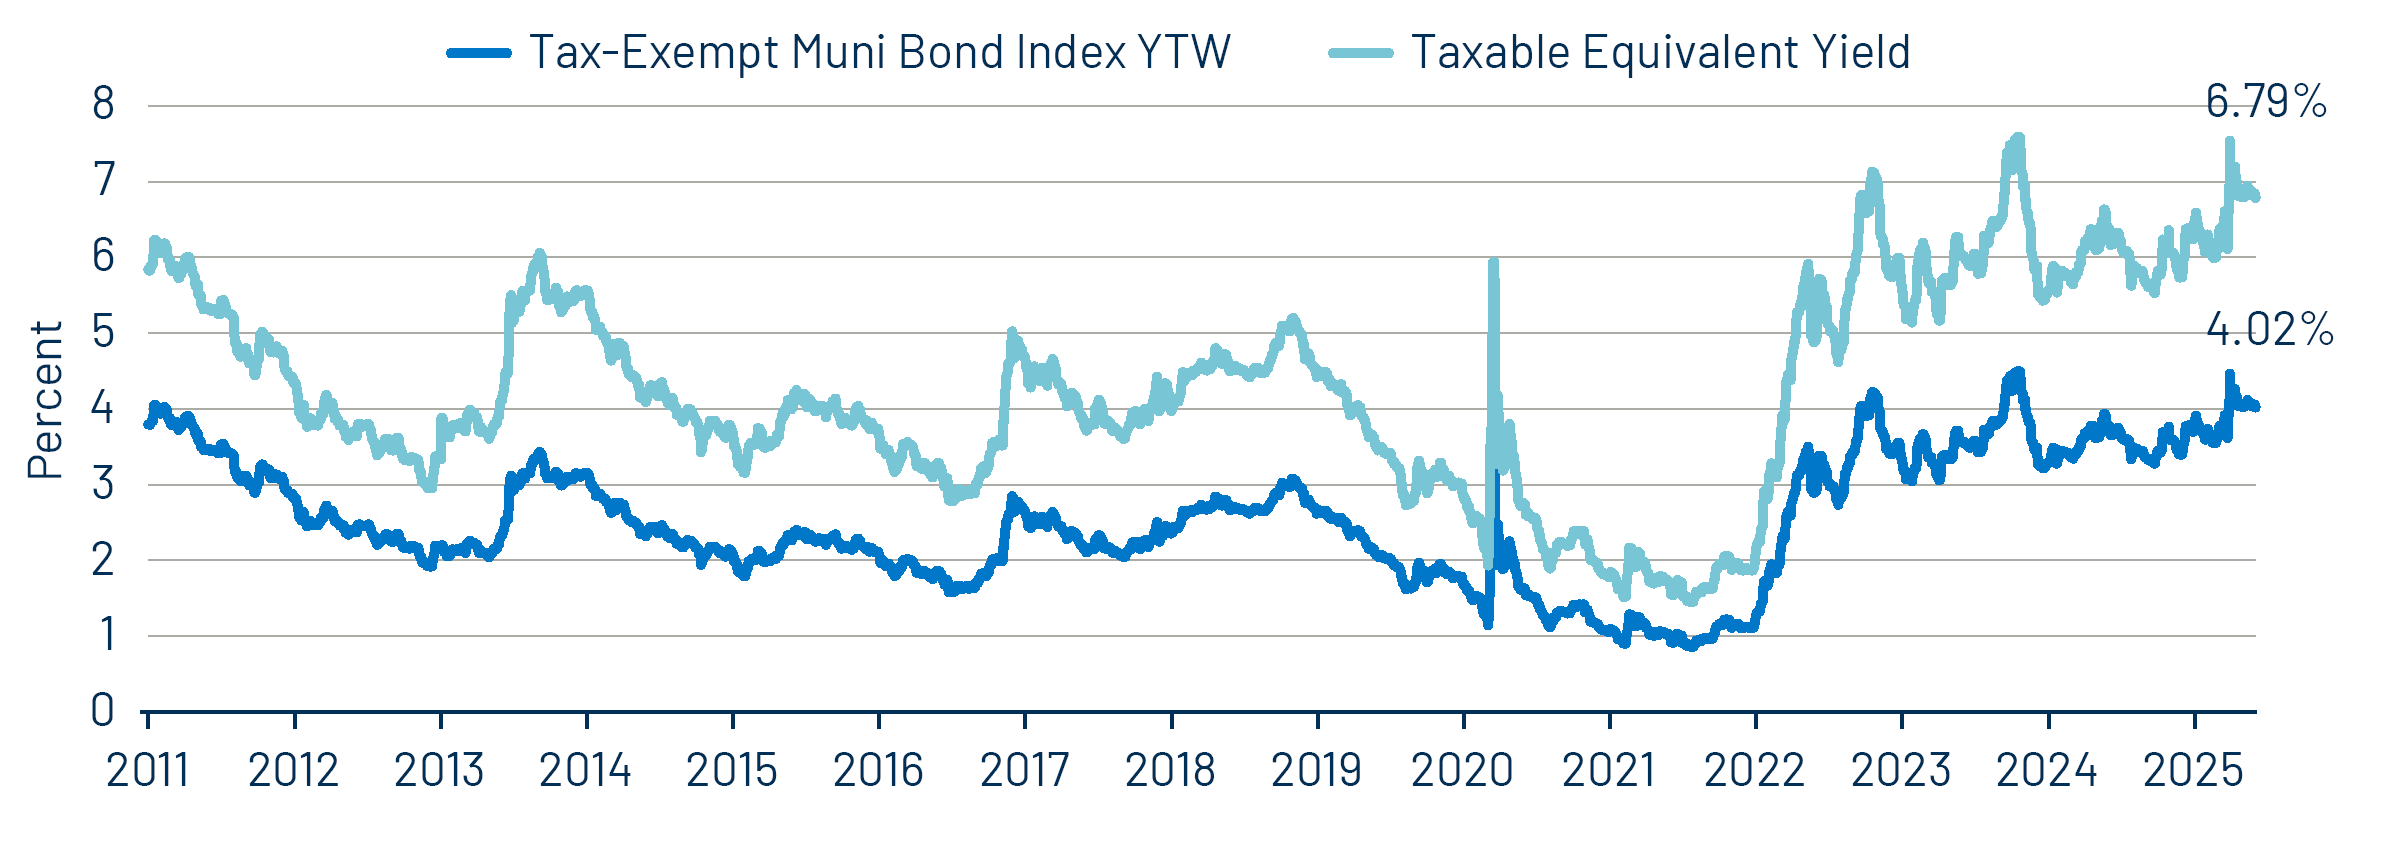
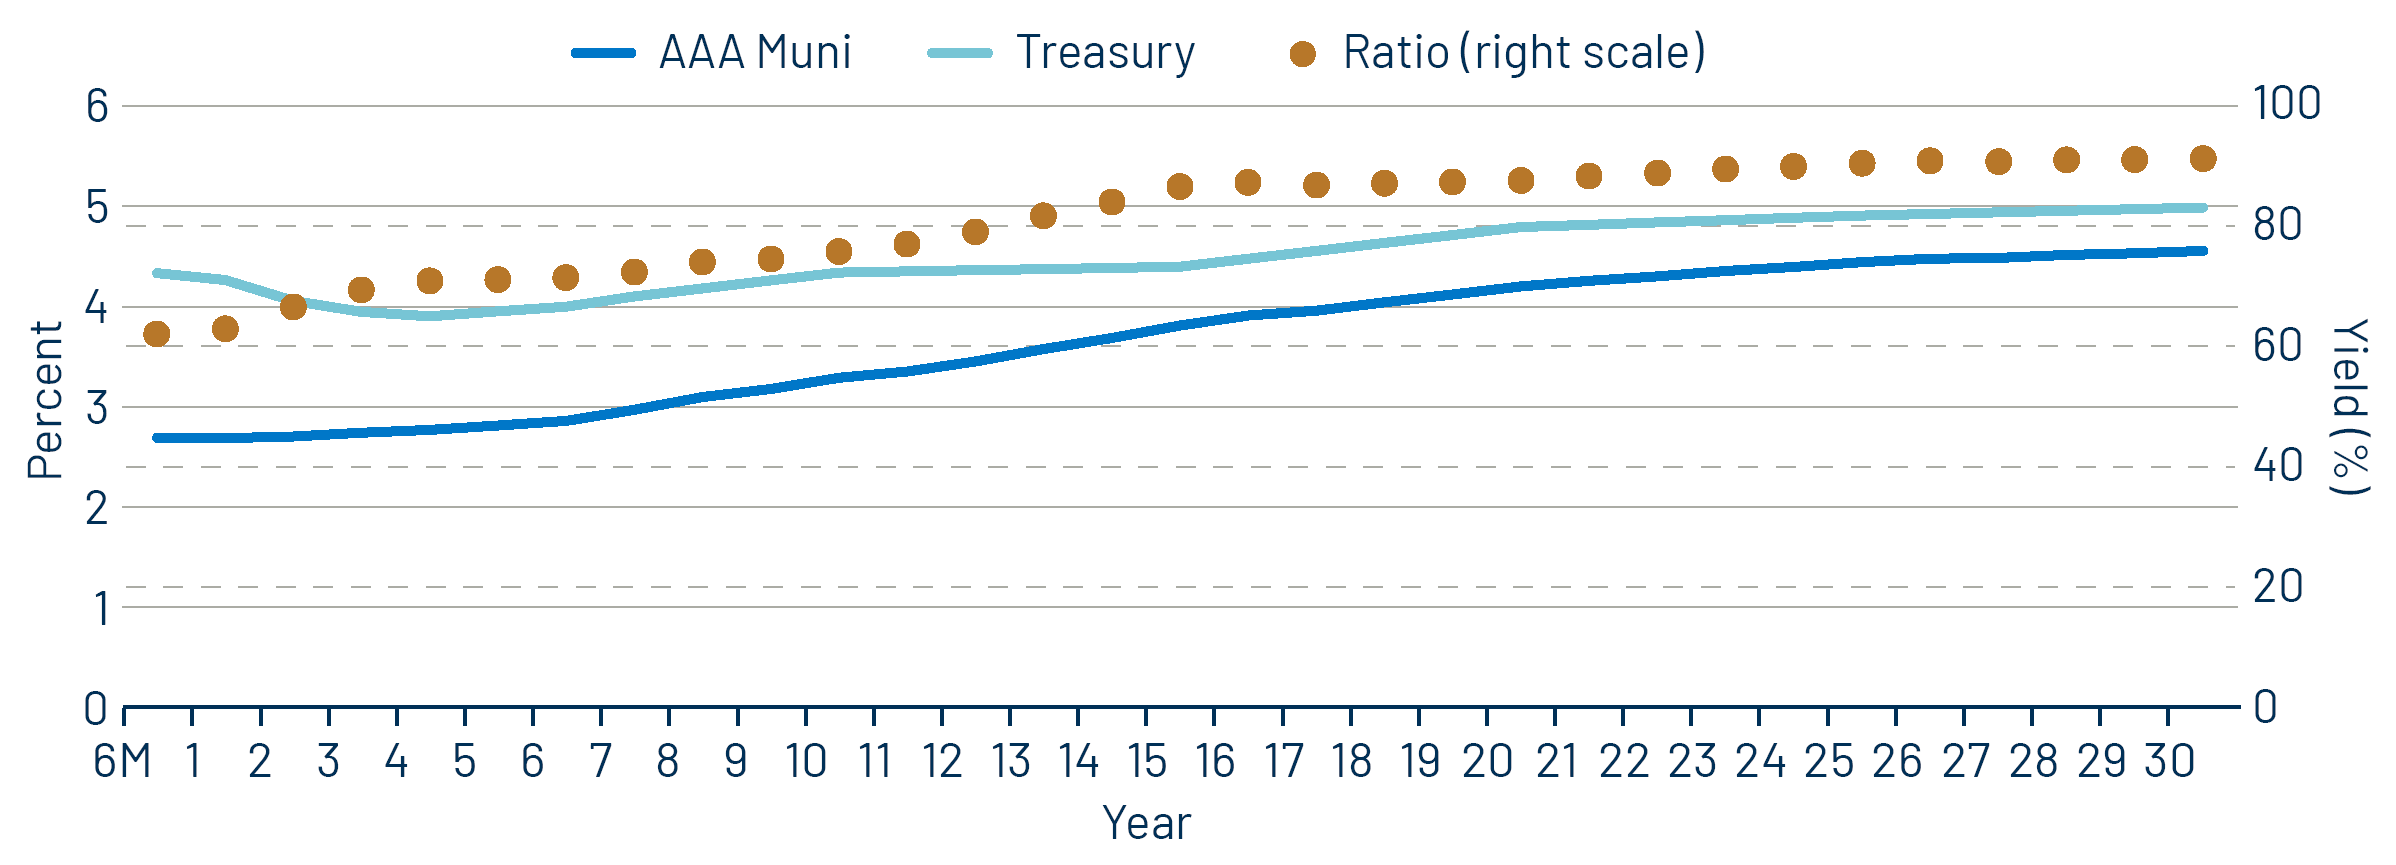
Theme #1: Municipal taxable-equivalent yields and income opportunities remain near decade-high levels.
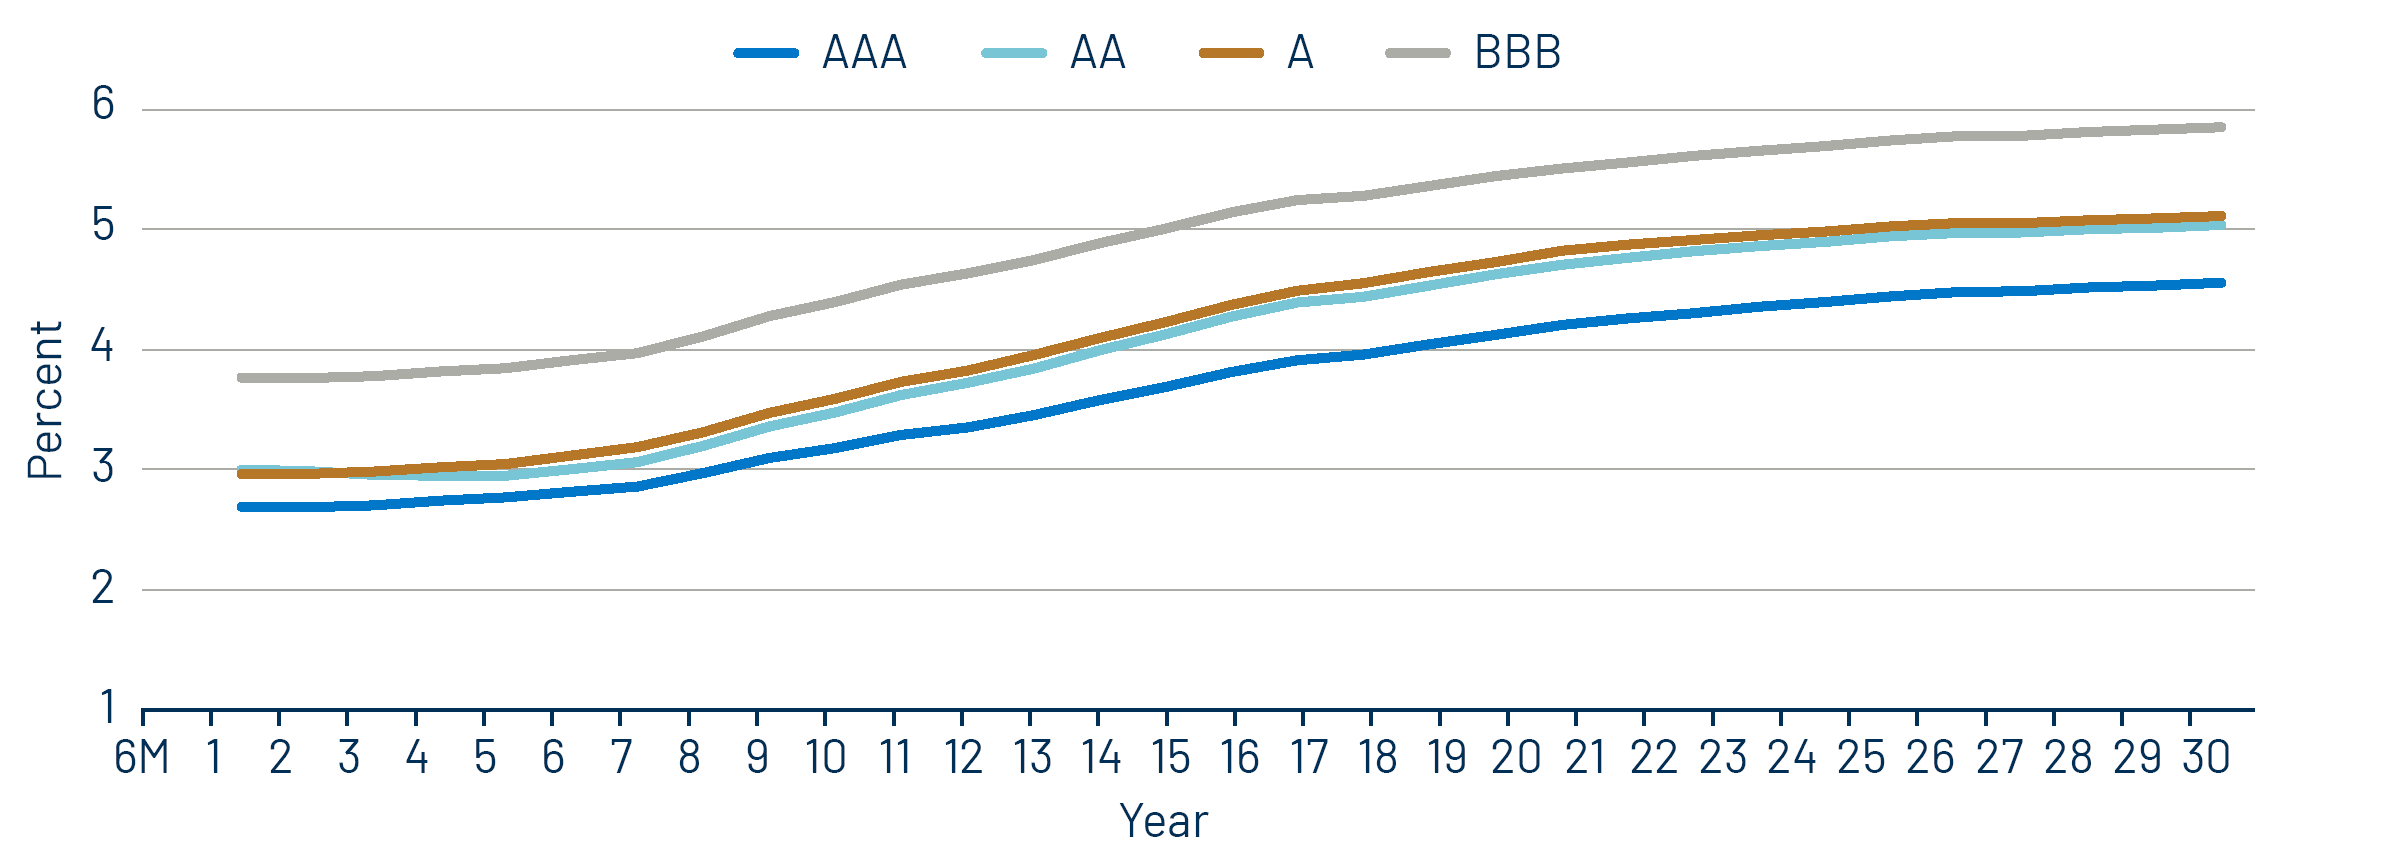
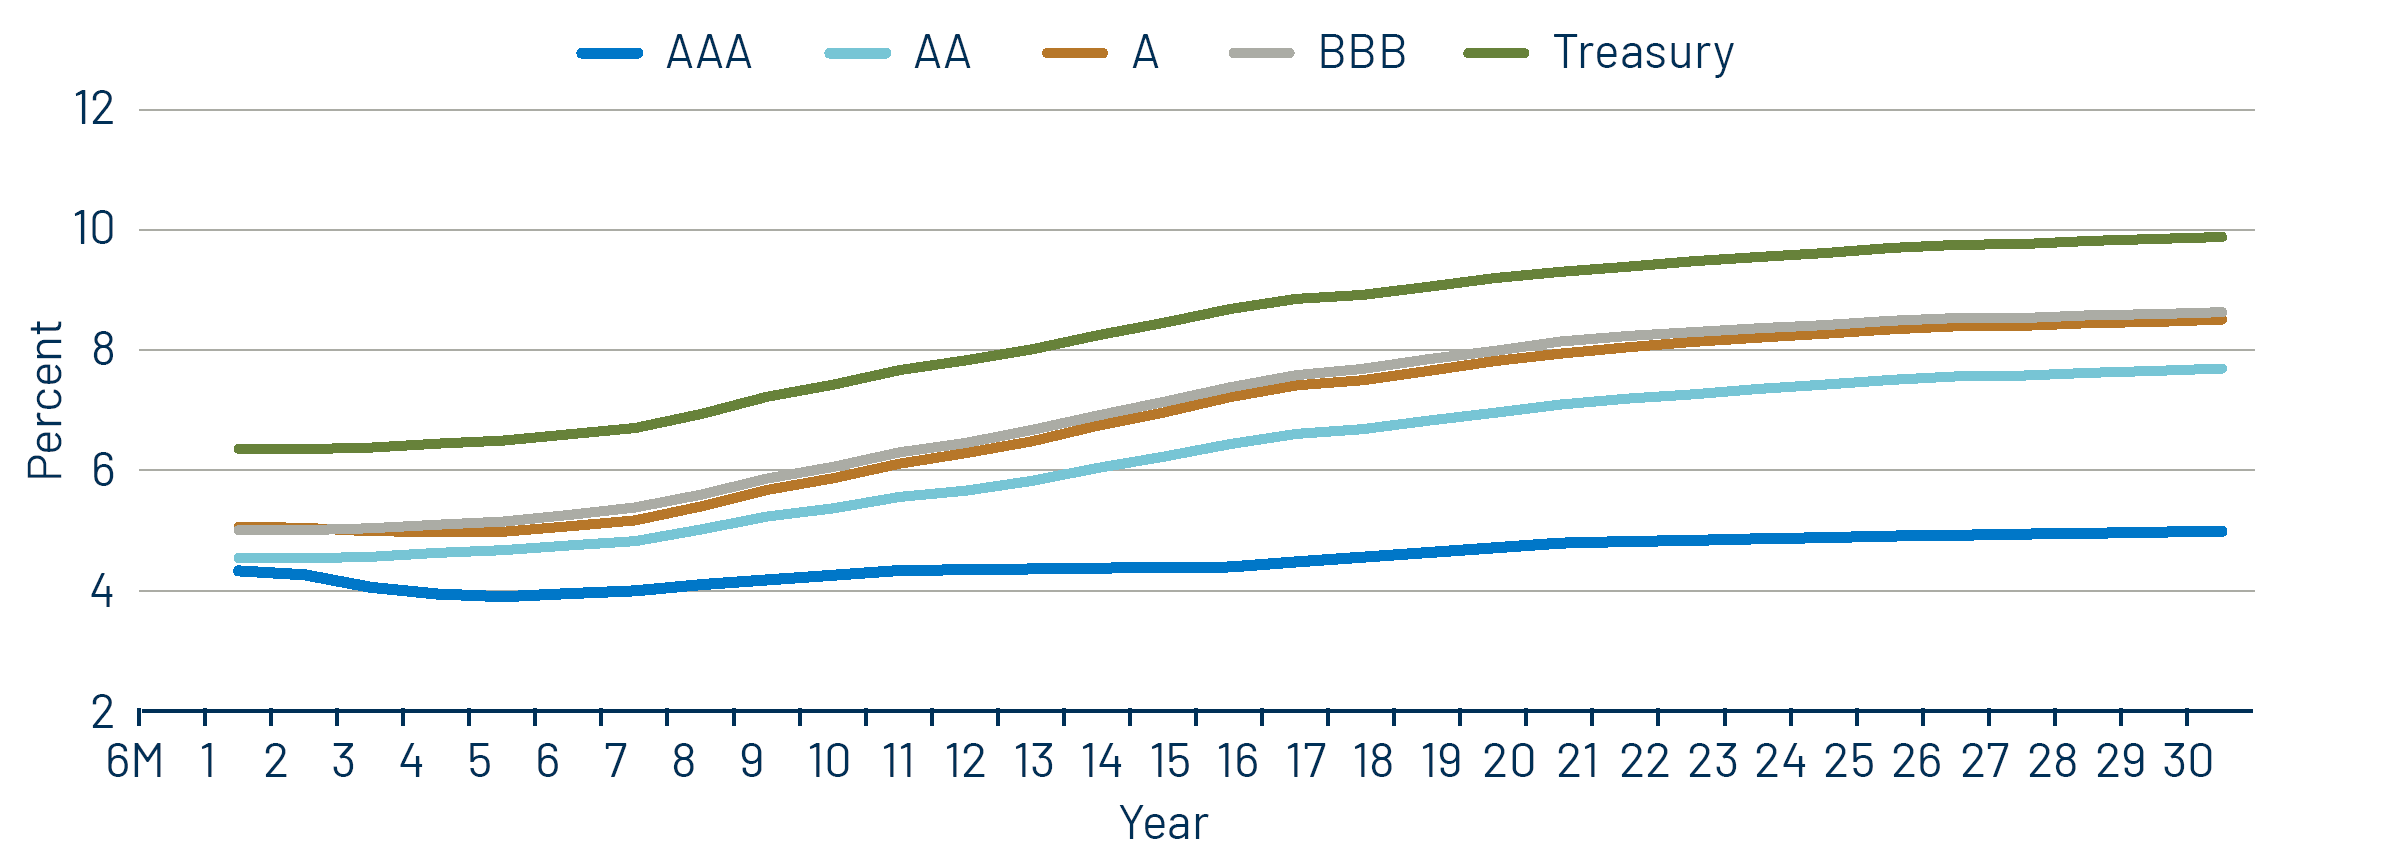
Theme #2: The muni curve has steepened, offering better value in intermediate and longer maturities.
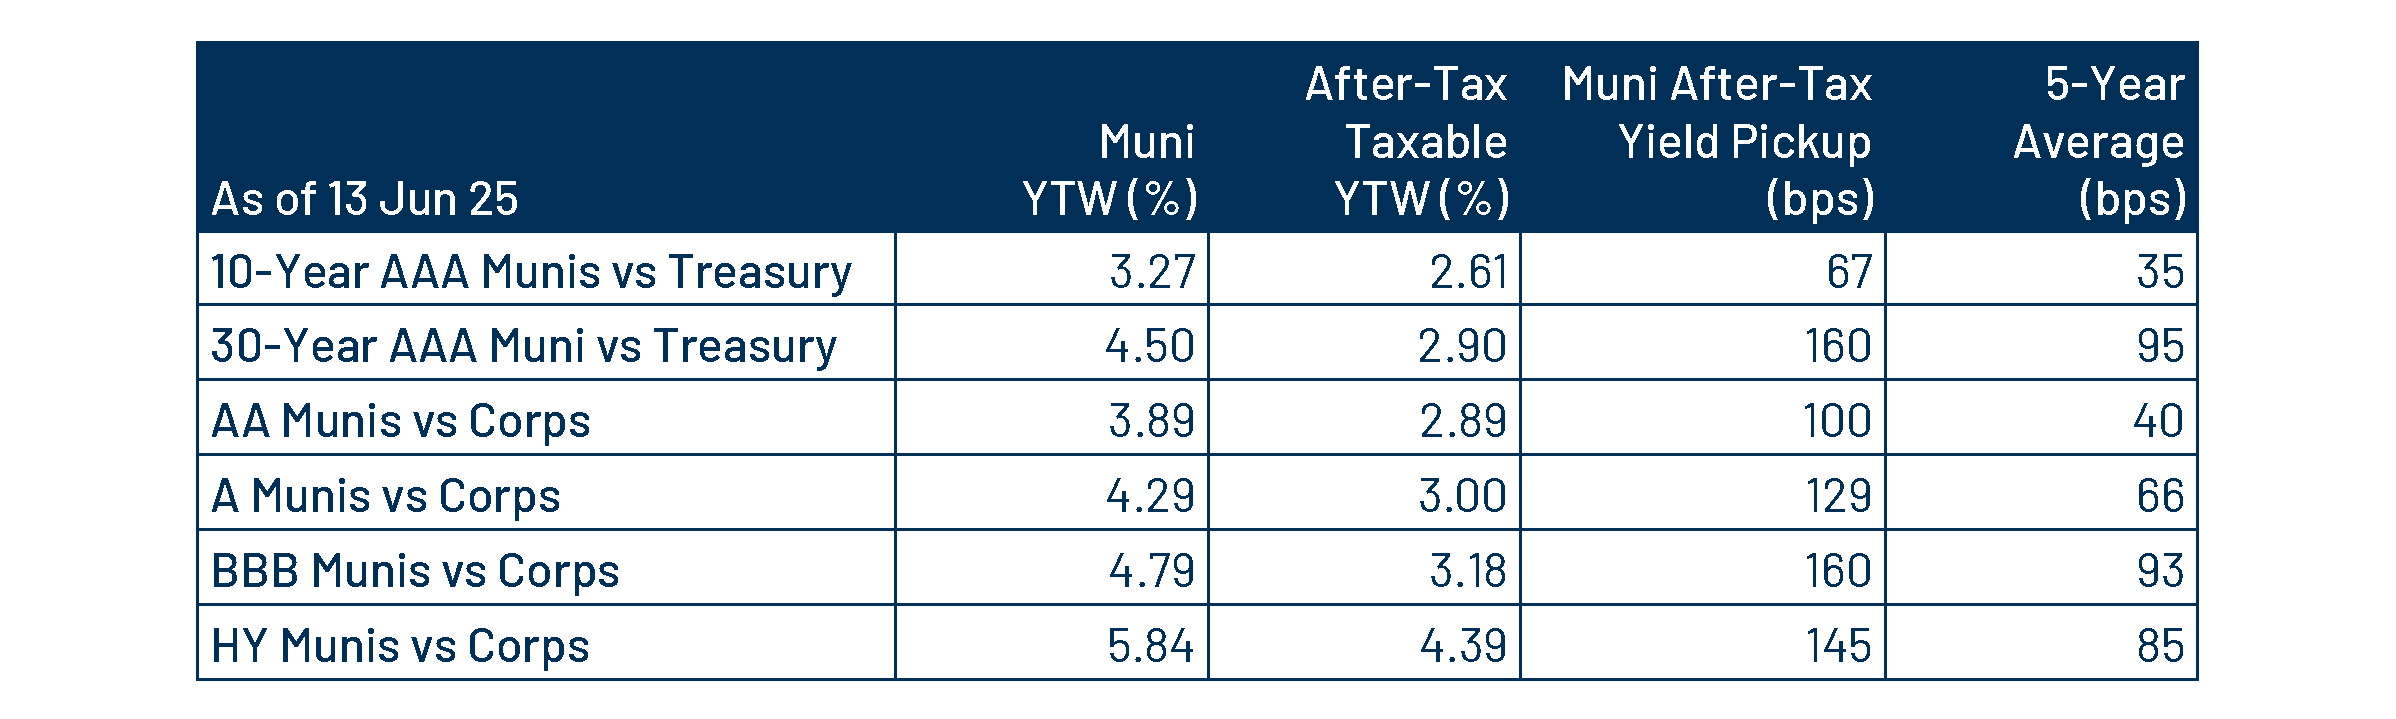
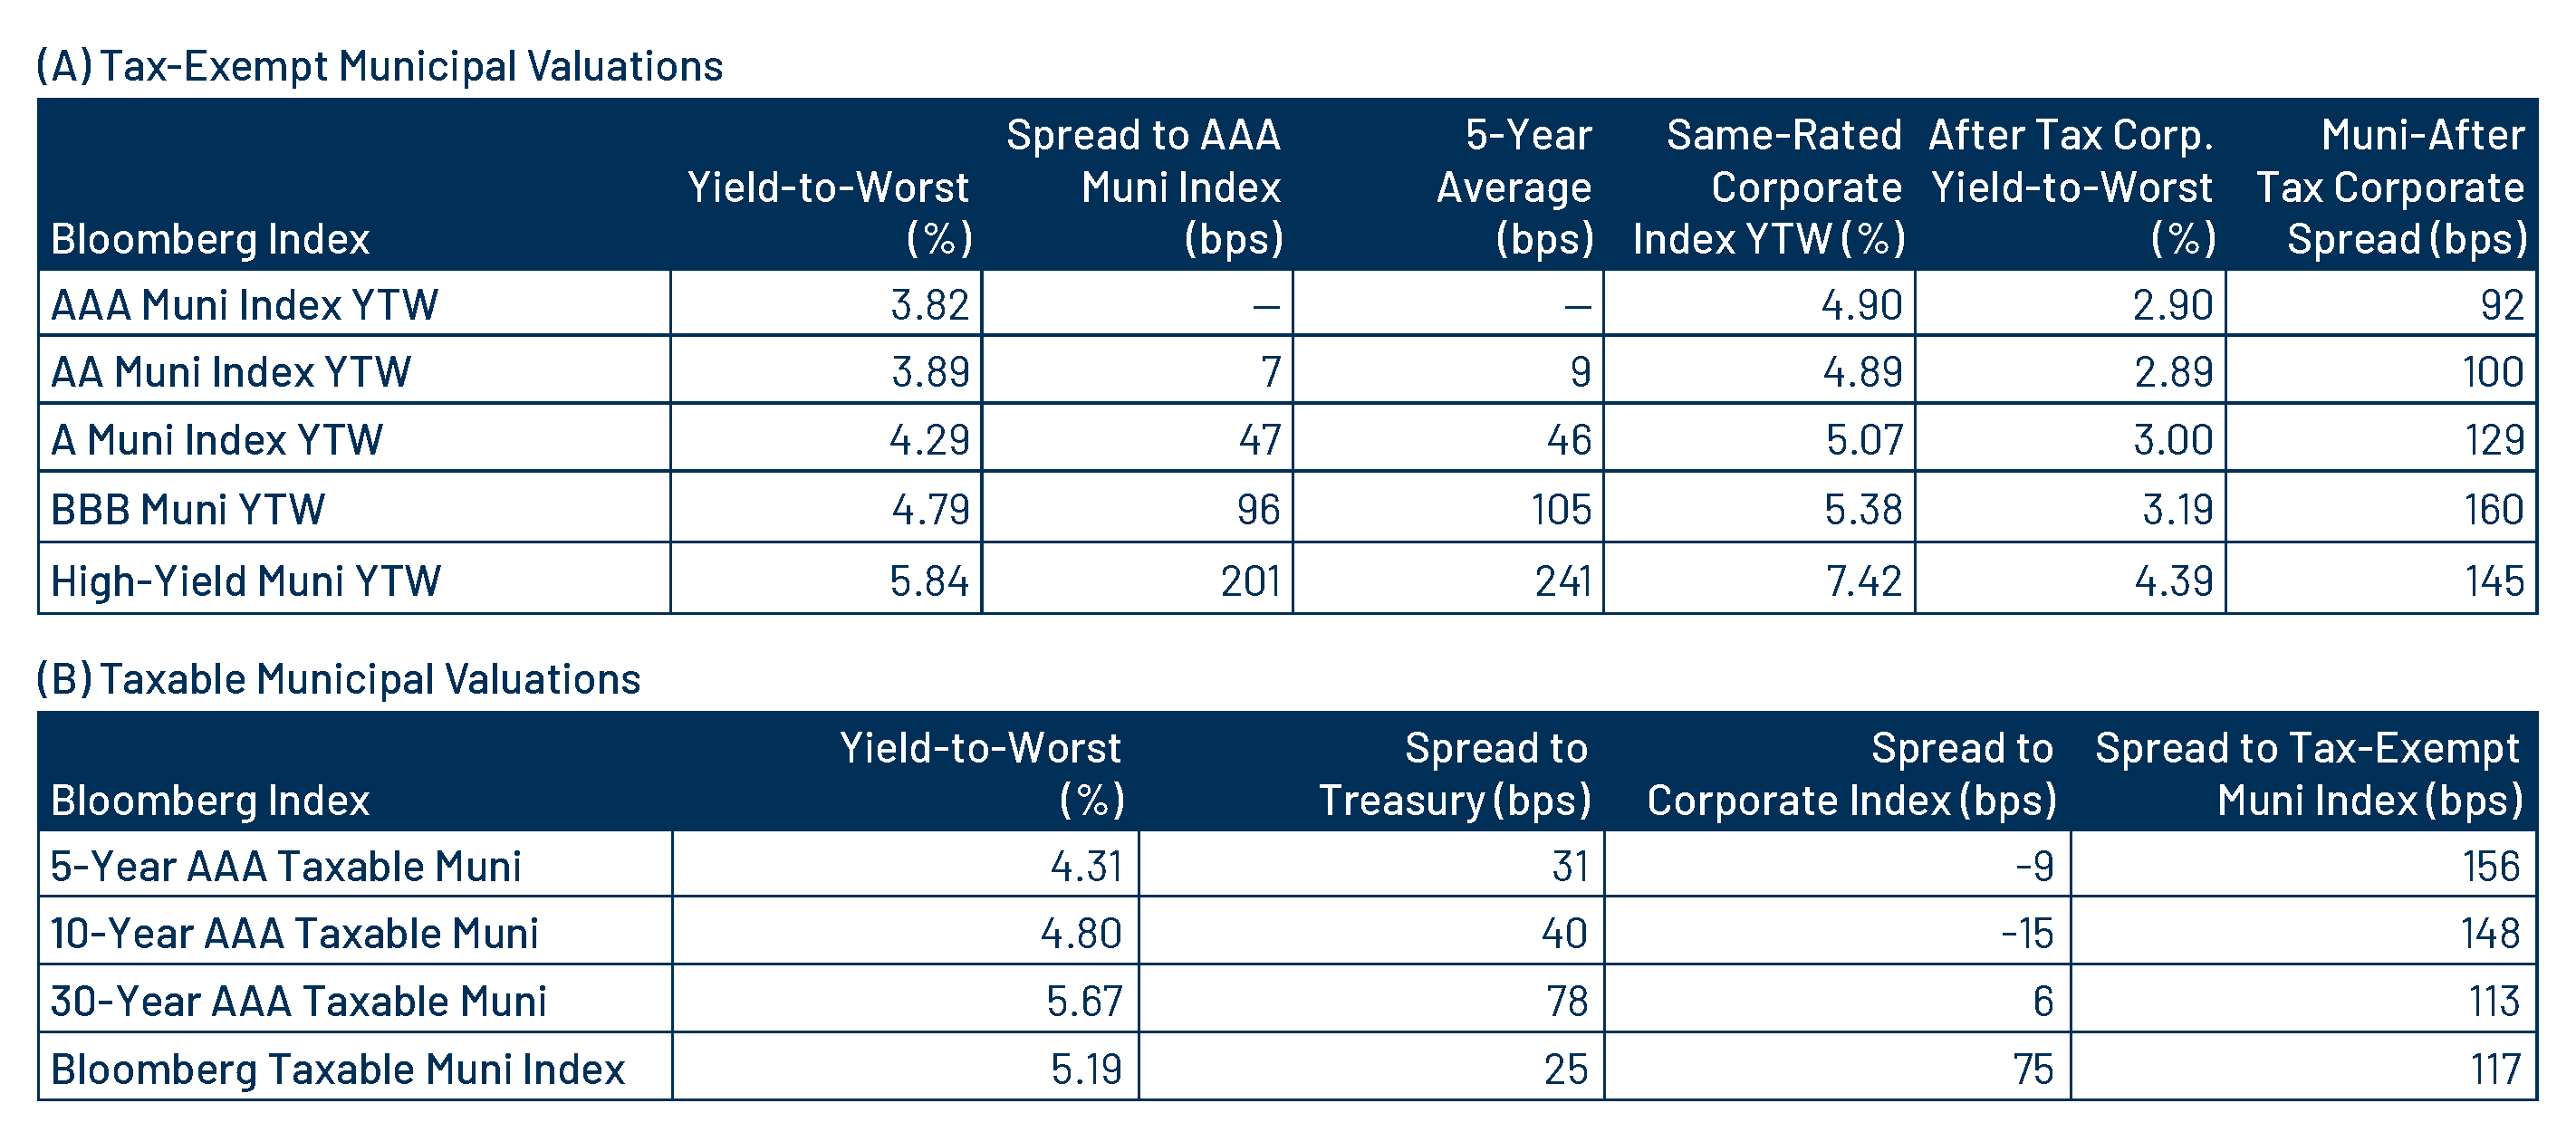
Theme #3: Munis offer attractive after-tax yield compared to taxable alternatives.