マーケット・ブログ
MARKETS
21 July 2026

Weekly Municipal Monitor—Summer Technicals

By Sam Weitzman

Macros, Markets and Munis

Municipals posted negative returns last week and underperformed Treasuries as geopolitical developments remained in focus with the US moving to reinstate a blockade of the Strait of Hormuz. Meanwhile, inflation data helped ease market concerns, with headline Consumer Price Index (CPI) declining 0.4% month-over-month, well below expectations and marking the largest decline in more than six years. Core CPI also decelerated over the month, remaining unchanged and below expectations. Treasury yields moved lower across most maturities with a steepening bias. Munis sold off 6-11 basis points across the curve, pressured by heavy supply and tight headline valuations. Supply remained elevated amid steady demand. This week we touch on summer technical dynamics.

Supply and Demand Remained Elevated Last Week

Fund Flows ($1.4 billion of net inflows): During the week ending July 15, weekly reporting municipal mutual funds recorded $1.4 billion of net inflows, in line with the prior week and marking the 13th consecutive week of inflows, according to Lipper. The intermediate-term category led demand with $596 million of inflows. The long-term category recorded $467 million of inflows and the short-term category reported $293 million of inflows. Last week’s inflows bring year-to-date (YTD) inflows to $58 billion.

Supply (YTD supply of $328 billion; up 12% YoY): The muni market recorded $13 billion of new-issue supply last week, 22% above the prior week’s level. YTD new-issue supply of $328 billion is 11% higher than the prior record-issuance year, with tax-exempt issuance up 12% year-over-year (YoY) and taxable issuance up 1%. This week’s calendar is expected to remain steady at $13 billion. Largest deals include $1.5 billion New York City Transitional Finance Authority and $944 million San Antonio Airport System transactions.

This Week in Munis: Summer Technicals

Municipal performance has historically strengthened during the summer months, supported by favorable supply-demand technicals that include seasonal coupon and maturity reinvestment, lighter net issuance and a rebound in demand following spring tax-season reallocations. Over the past decade, May, June and July have generally ranked among the strongest average return months for the Bloomberg Municipal Bond Index. While this year’s technical backdrop differs from historical norms given elevated issuance, municipal performance has remained resilient. From Memorial Day through July 17, the Bloomberg Municipal Bond Index returned 1.19%, outperforming both the Bloomberg U.S. Treasury Index (0.69%) and the Bloomberg U.S. Corporate Index (-0.53%). That outperformance is notable given that municipal supply remains on pace for a third consecutive record year.
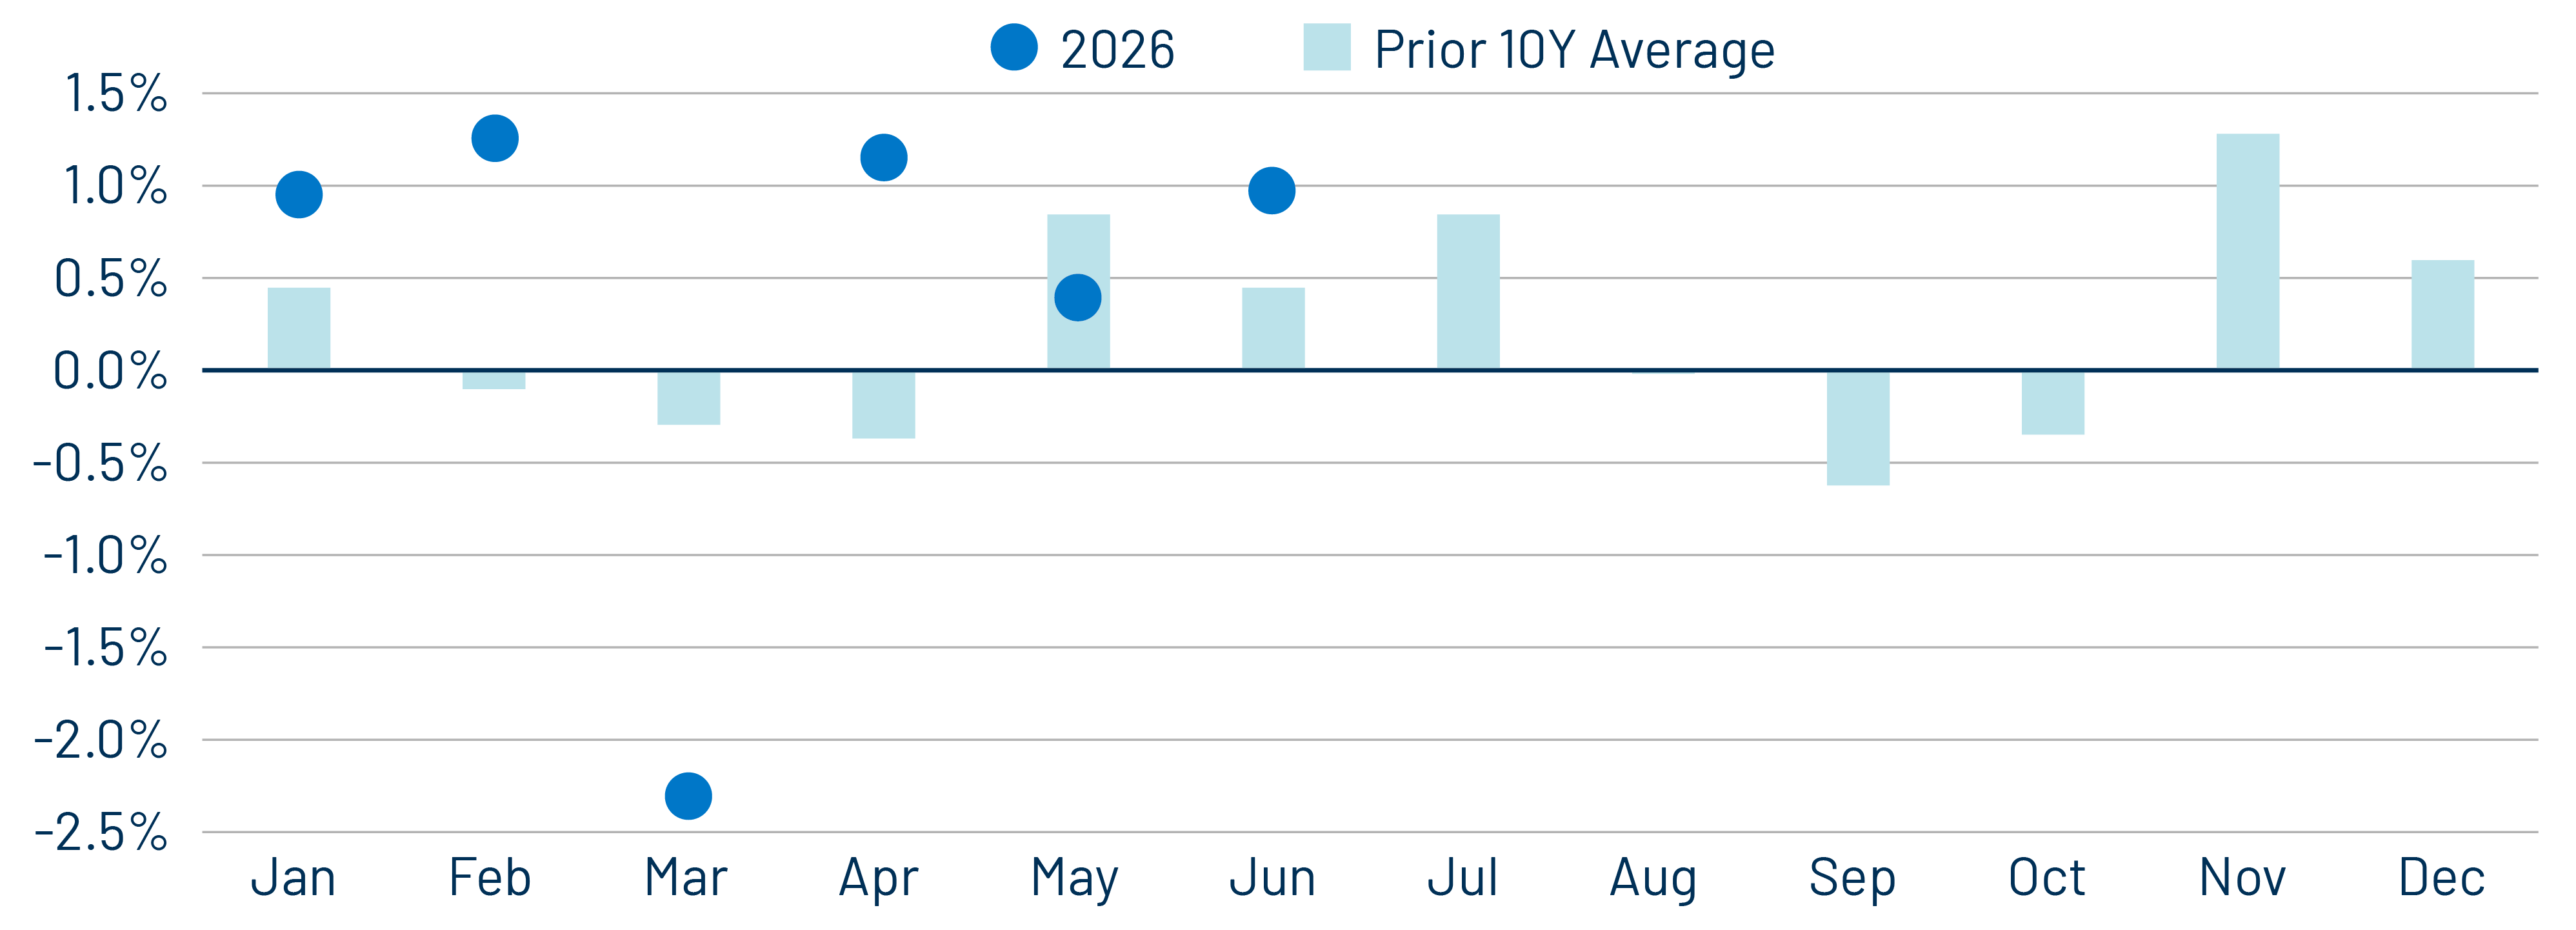
Exhibit 1: 10-Year Average Muni Monthly Returns vs. 2026
10-Year Average Muni Monthly Returns vs. 2026
Source: Bloomberg, Western Asset. As of 30 Jun 26. Select the image to expand the view.

Supply trends have historically supported municipal performance during the summer months. While gross issuance is often strong in June, elevated coupon payments, maturities and called bonds can meaningfully reduce net supply through the summer reinvestment period. From 2015 through 2023, the municipal market recorded negative net supply, on average, from June through September. As issuance rebounded in 2024 and 2025, the market shifted back to positive net supply, although summer issuance still represented one of the lighter seasonal periods in those years. In 2026, supply has remained elevated relative to prior record-year levels, resulting in positive net supply and a continued departure from the historical summer pattern.
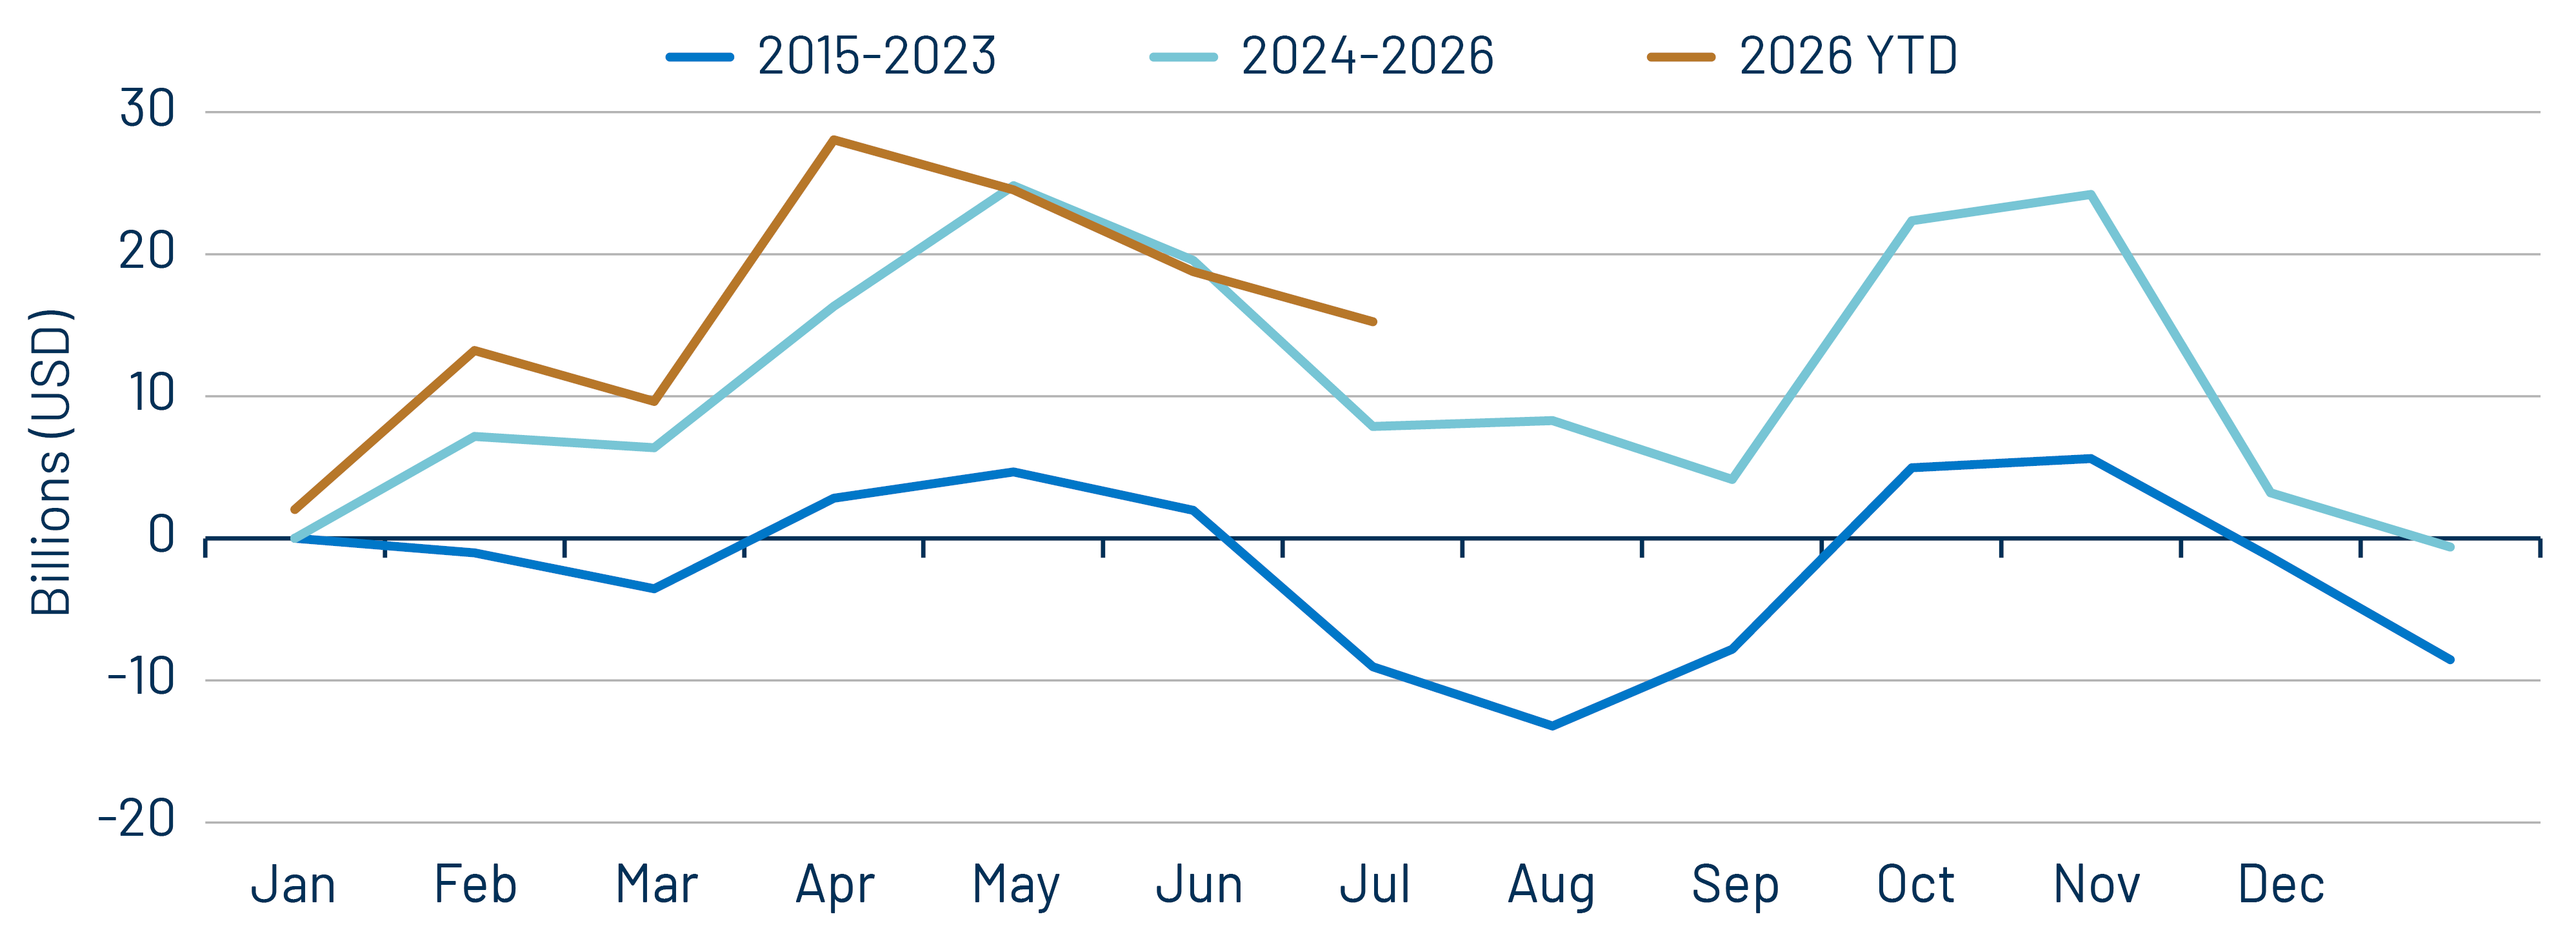
Exhibit 2: Tax-Exempt Net Supply Trends
Tax-Exempt Net Supply Trends
Source: Bloomberg, Western Asset. As of 30 Jun 26. Select the image to expand the view.

Strong municipal performance despite elevated supply underscores the strength of demand observed this year. According to ICI and Lipper data, YTD municipal fund inflows of $64 billion represent the second-highest calendar-year total on record and bring cumulative municipal fund inflows since January 2024 to $172 billion, approaching prior record inflow-cycle levels. In addition, separately managed account (SMA) demand remains robust and persistent. According to Cerulli Associates’ 2Q26 SMA Report, managed municipal SMA assets increased $65 billion during the first quarter of 2026, nearly double the increase in municipal mutual fund assets over the same period.
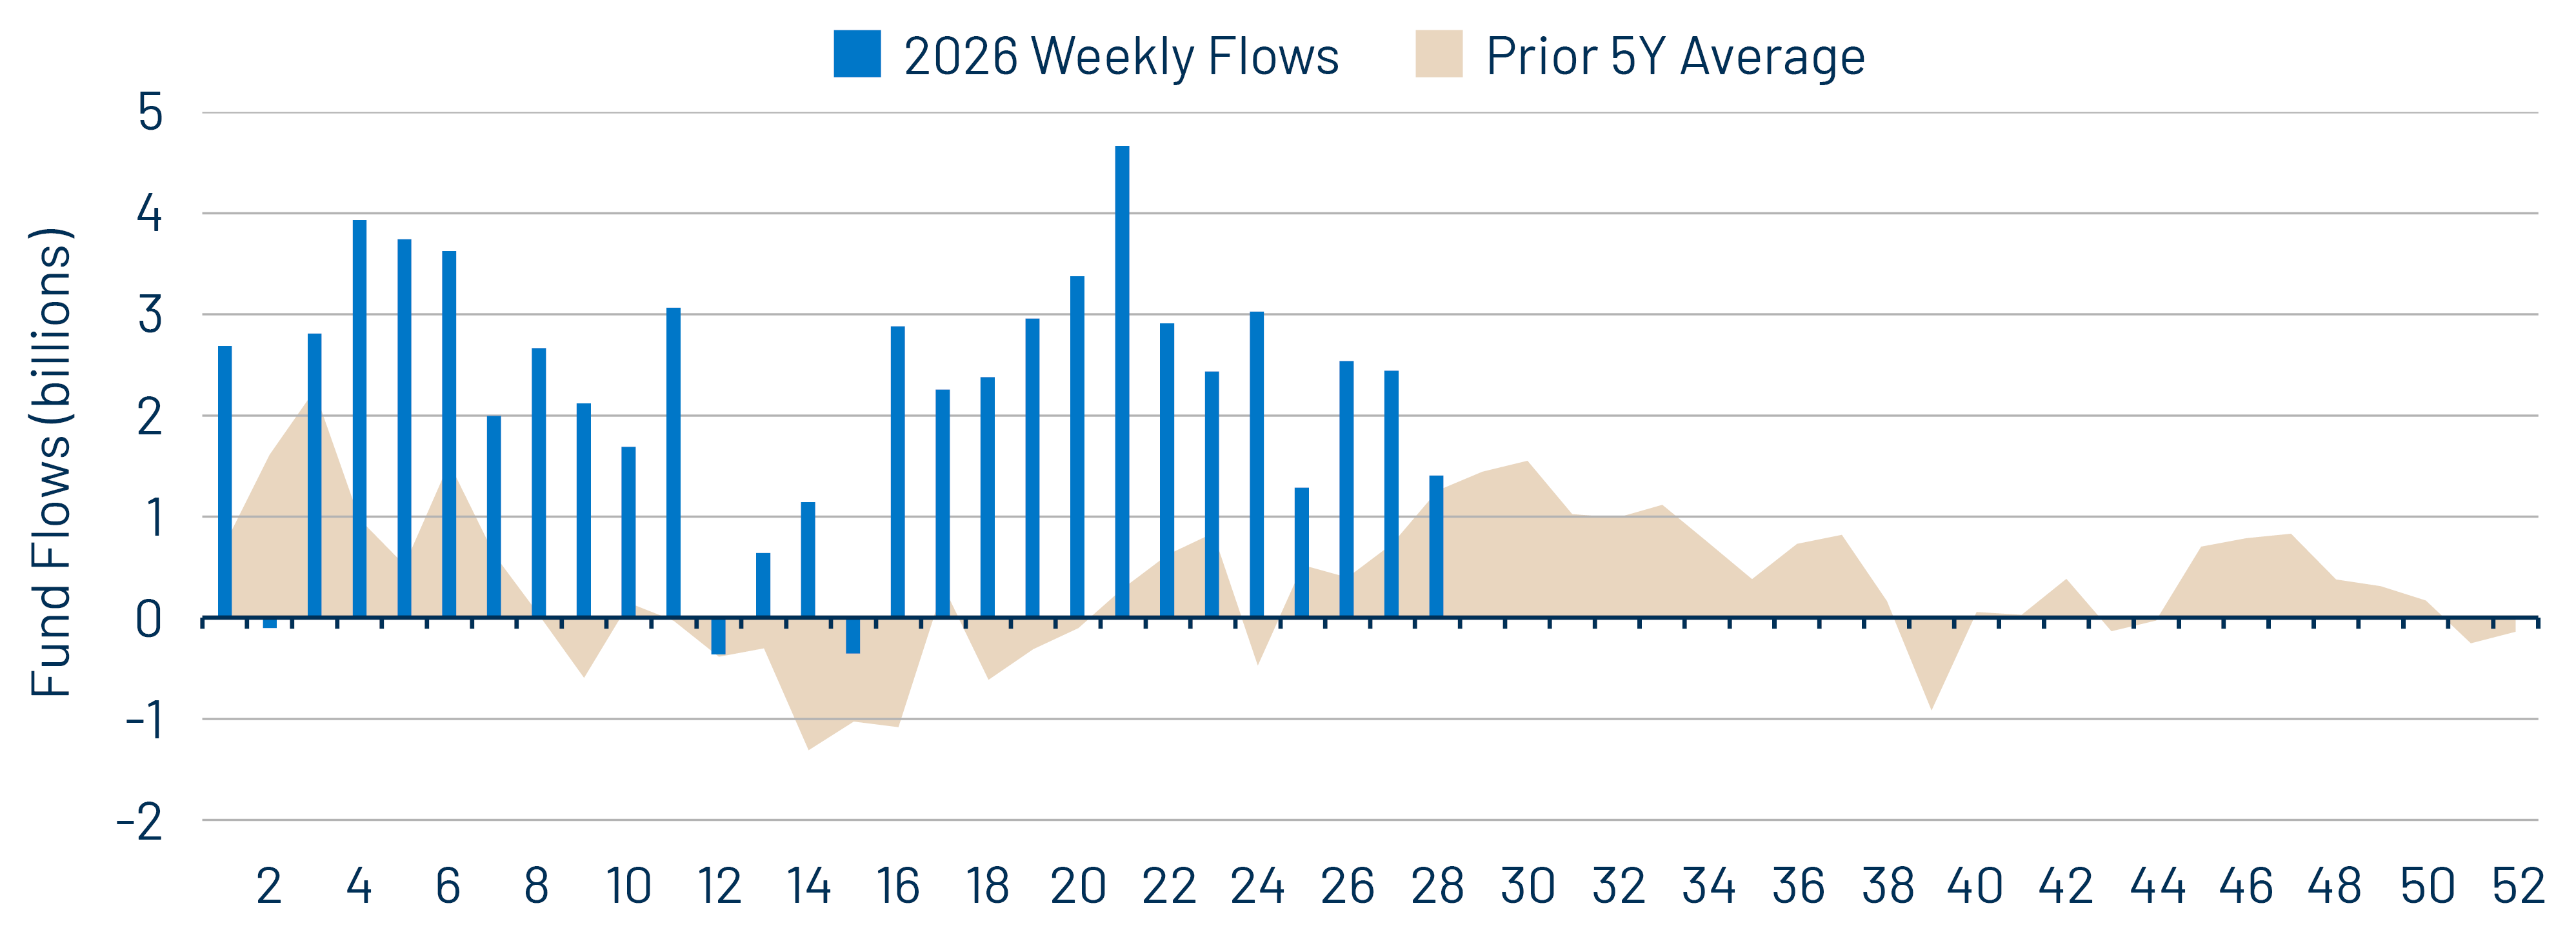
Exhibit 3: Municipal Demand Has Maintained an Above-Average Pace
Municipal Demand Has Maintained an Above-Average Pace
Source: ICI (weeks prior to 15 Jul 26), Lipper (week of 15 Jul 26), Western Asset. As of 15 Jul 26. Select the image to expand the view.

Continued demand from both mutual funds and SMAs should remain supportive of municipal market technicals despite elevated supply levels. While municipals have outperformed other fixed-income sectors so far this year, our view is that elevated issuance should continue to create attractive opportunities for active investors. Periodic increases in supply may create temporary price dislocations, but we believe those episodes are more likely to present attractive entry points than undermine the broader technical backdrop.

Municipal Credit Curves and Relative Value
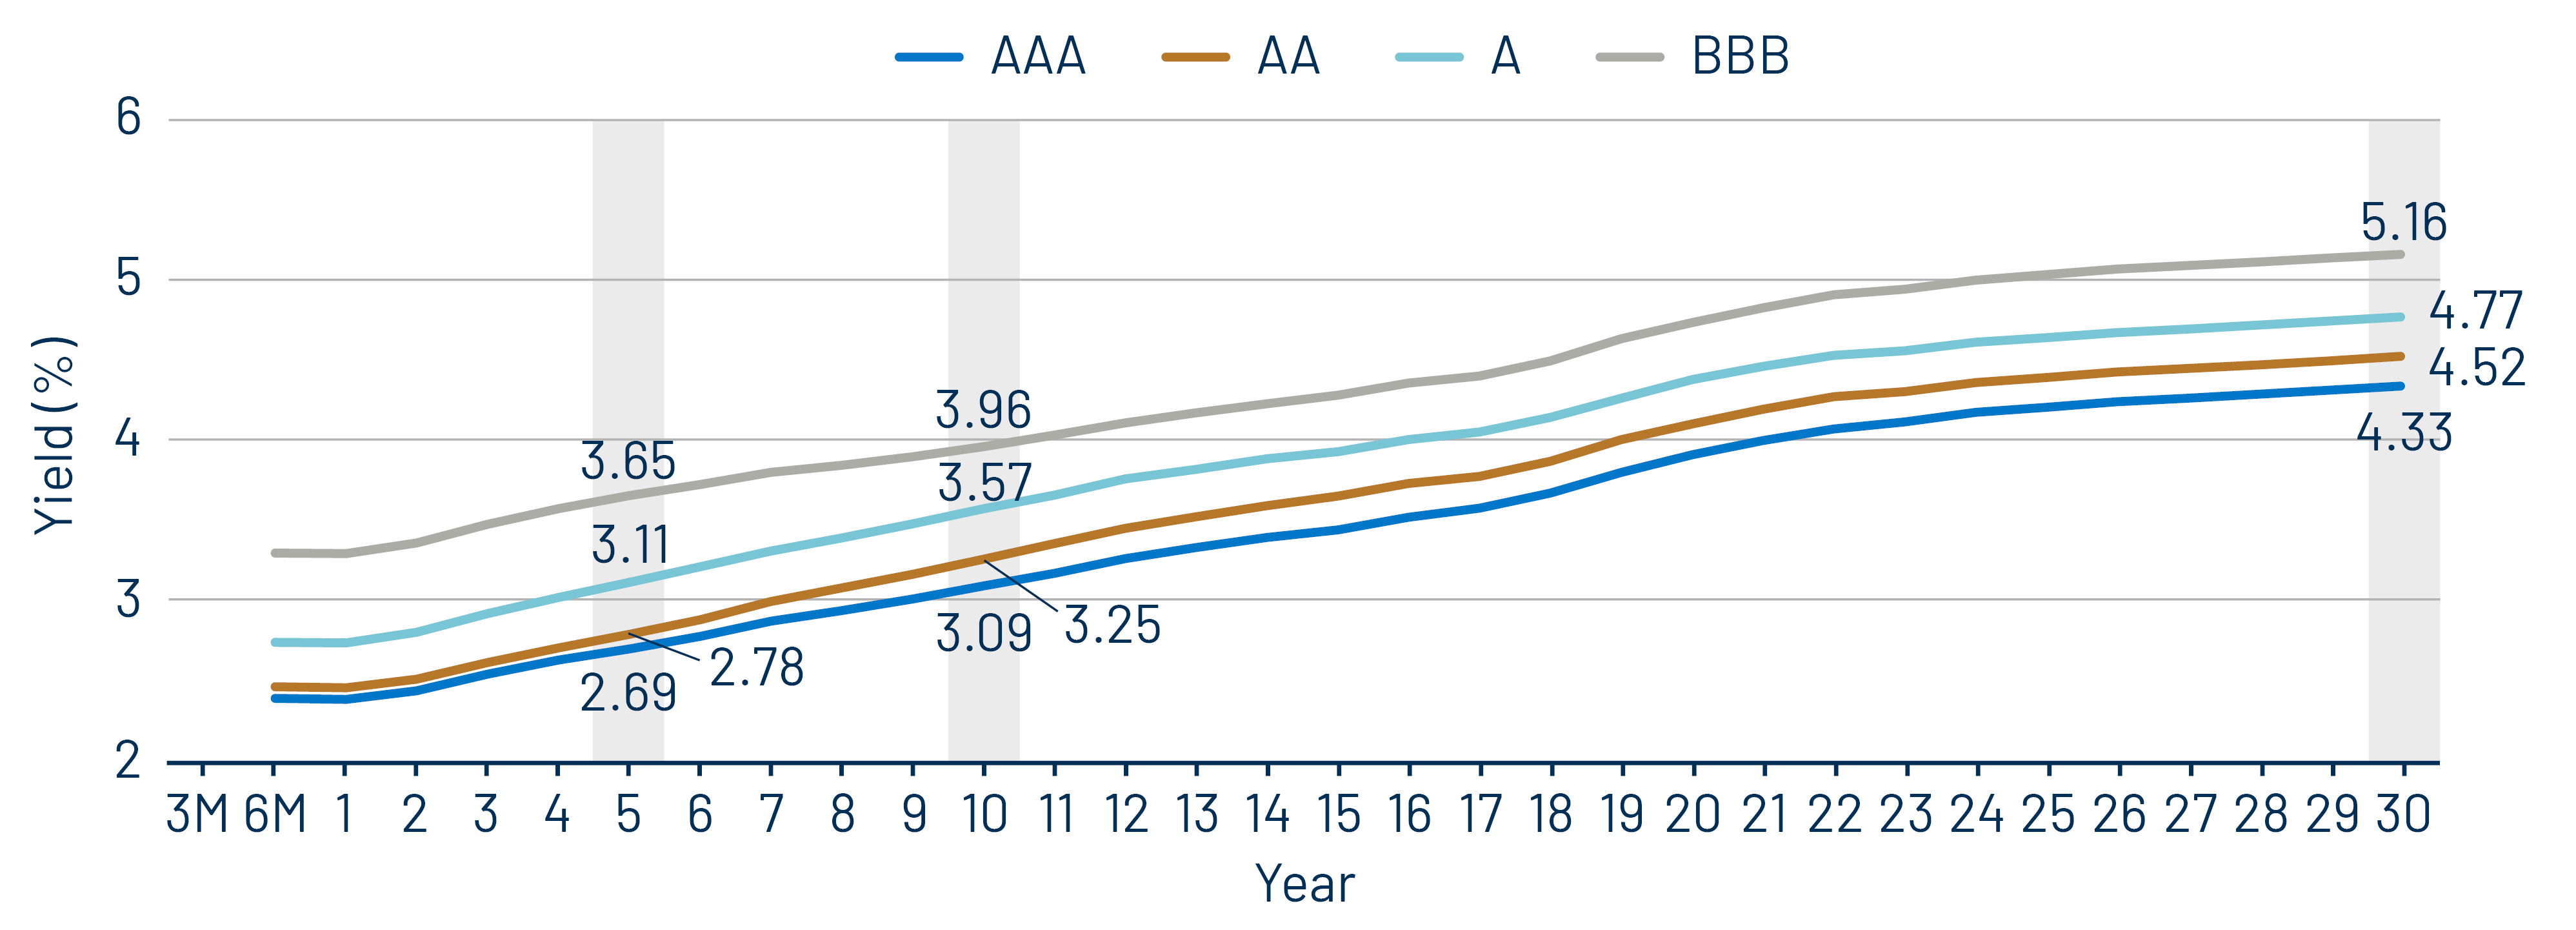
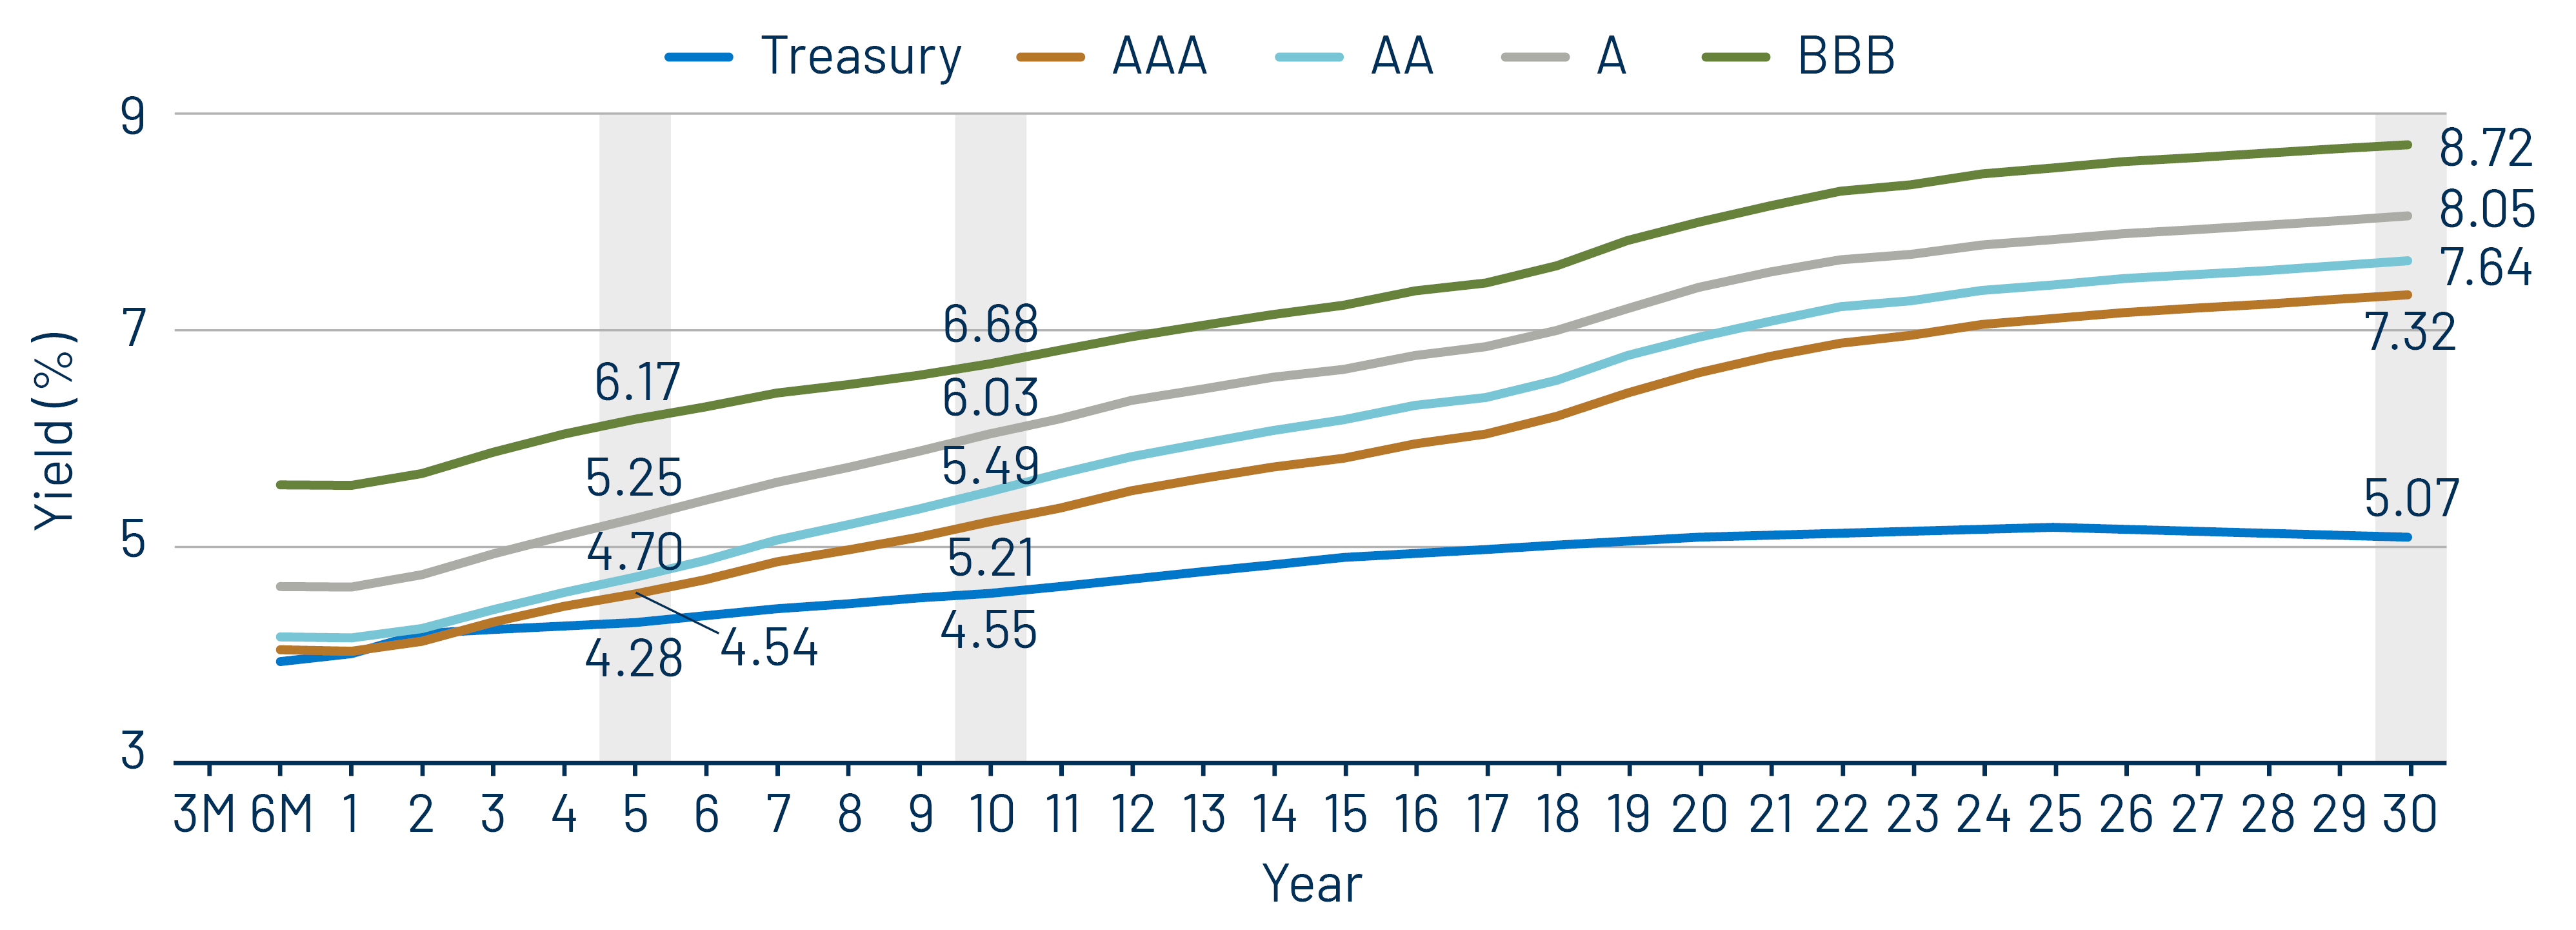
Exhibit 4: Muni Credit Curves
Muni Credit Curves
Source: Bloomberg, Western Asset. As of 17 Jul 26. Bloomberg Valuation Service (BVAL) Municipal Credit Indices (AAA, AA, A, BBB, respectively) and US Sovereign Curves. Taxable-Equivalent Muni Credit Curves consider the top marginal effective tax rate of 40.8%. AA Muni is represented by the US General Obligation AA Muni BVAL Yield Curve. The BVAL curve is populated with pricing from uninsured AA General Obligation bonds. A Muni is represented by the US General Obligation A Muni BVAL Yield Curve. The BVAL curve is populated with pricing from uninsured A General Obligation bonds. BBB Muni is represented by the US General Obligation BBB Muni BVAL Yield Curve. The BVAL curve is populated with pricing from uninsured BBB General Obligation bonds. Indices are unmanaged and one cannot directly invest in them. They do not include fees, expenses or sales charges. Past performance is not an indicator or a guarantee of future results. Select the image to expand the view.
Exhibit 5: Taxable-Equivalent Muni Credit Curves
Taxable-Equivalent Muni Credit Curves
Source: Bloomberg, Western Asset. As of 17 Jul 26. Bloomberg Valuation Service (BVAL) Municipal Credit Indices (AAA, AA, A, BBB, respectively) and US Sovereign Curves. Taxable-Equivalent Muni Credit Curves consider the top marginal effective tax rate of 40.8%. AA Muni is represented by the US General Obligation AA Muni BVAL Yield Curve. The BVAL curve is populated with pricing from uninsured AA General Obligation bonds. A Muni is represented by the US General Obligation A Muni BVAL Yield Curve. The BVAL curve is populated with pricing from uninsured A General Obligation bonds. BBB Muni is represented by the US General Obligation BBB Muni BVAL Yield Curve. The BVAL curve is populated with pricing from uninsured BBB General Obligation bonds. Indices are unmanaged and one cannot directly invest in them. They do not include fees, expenses or sales charges. Past performance is not an indicator or a guarantee of future results. Select the image to expand the view.
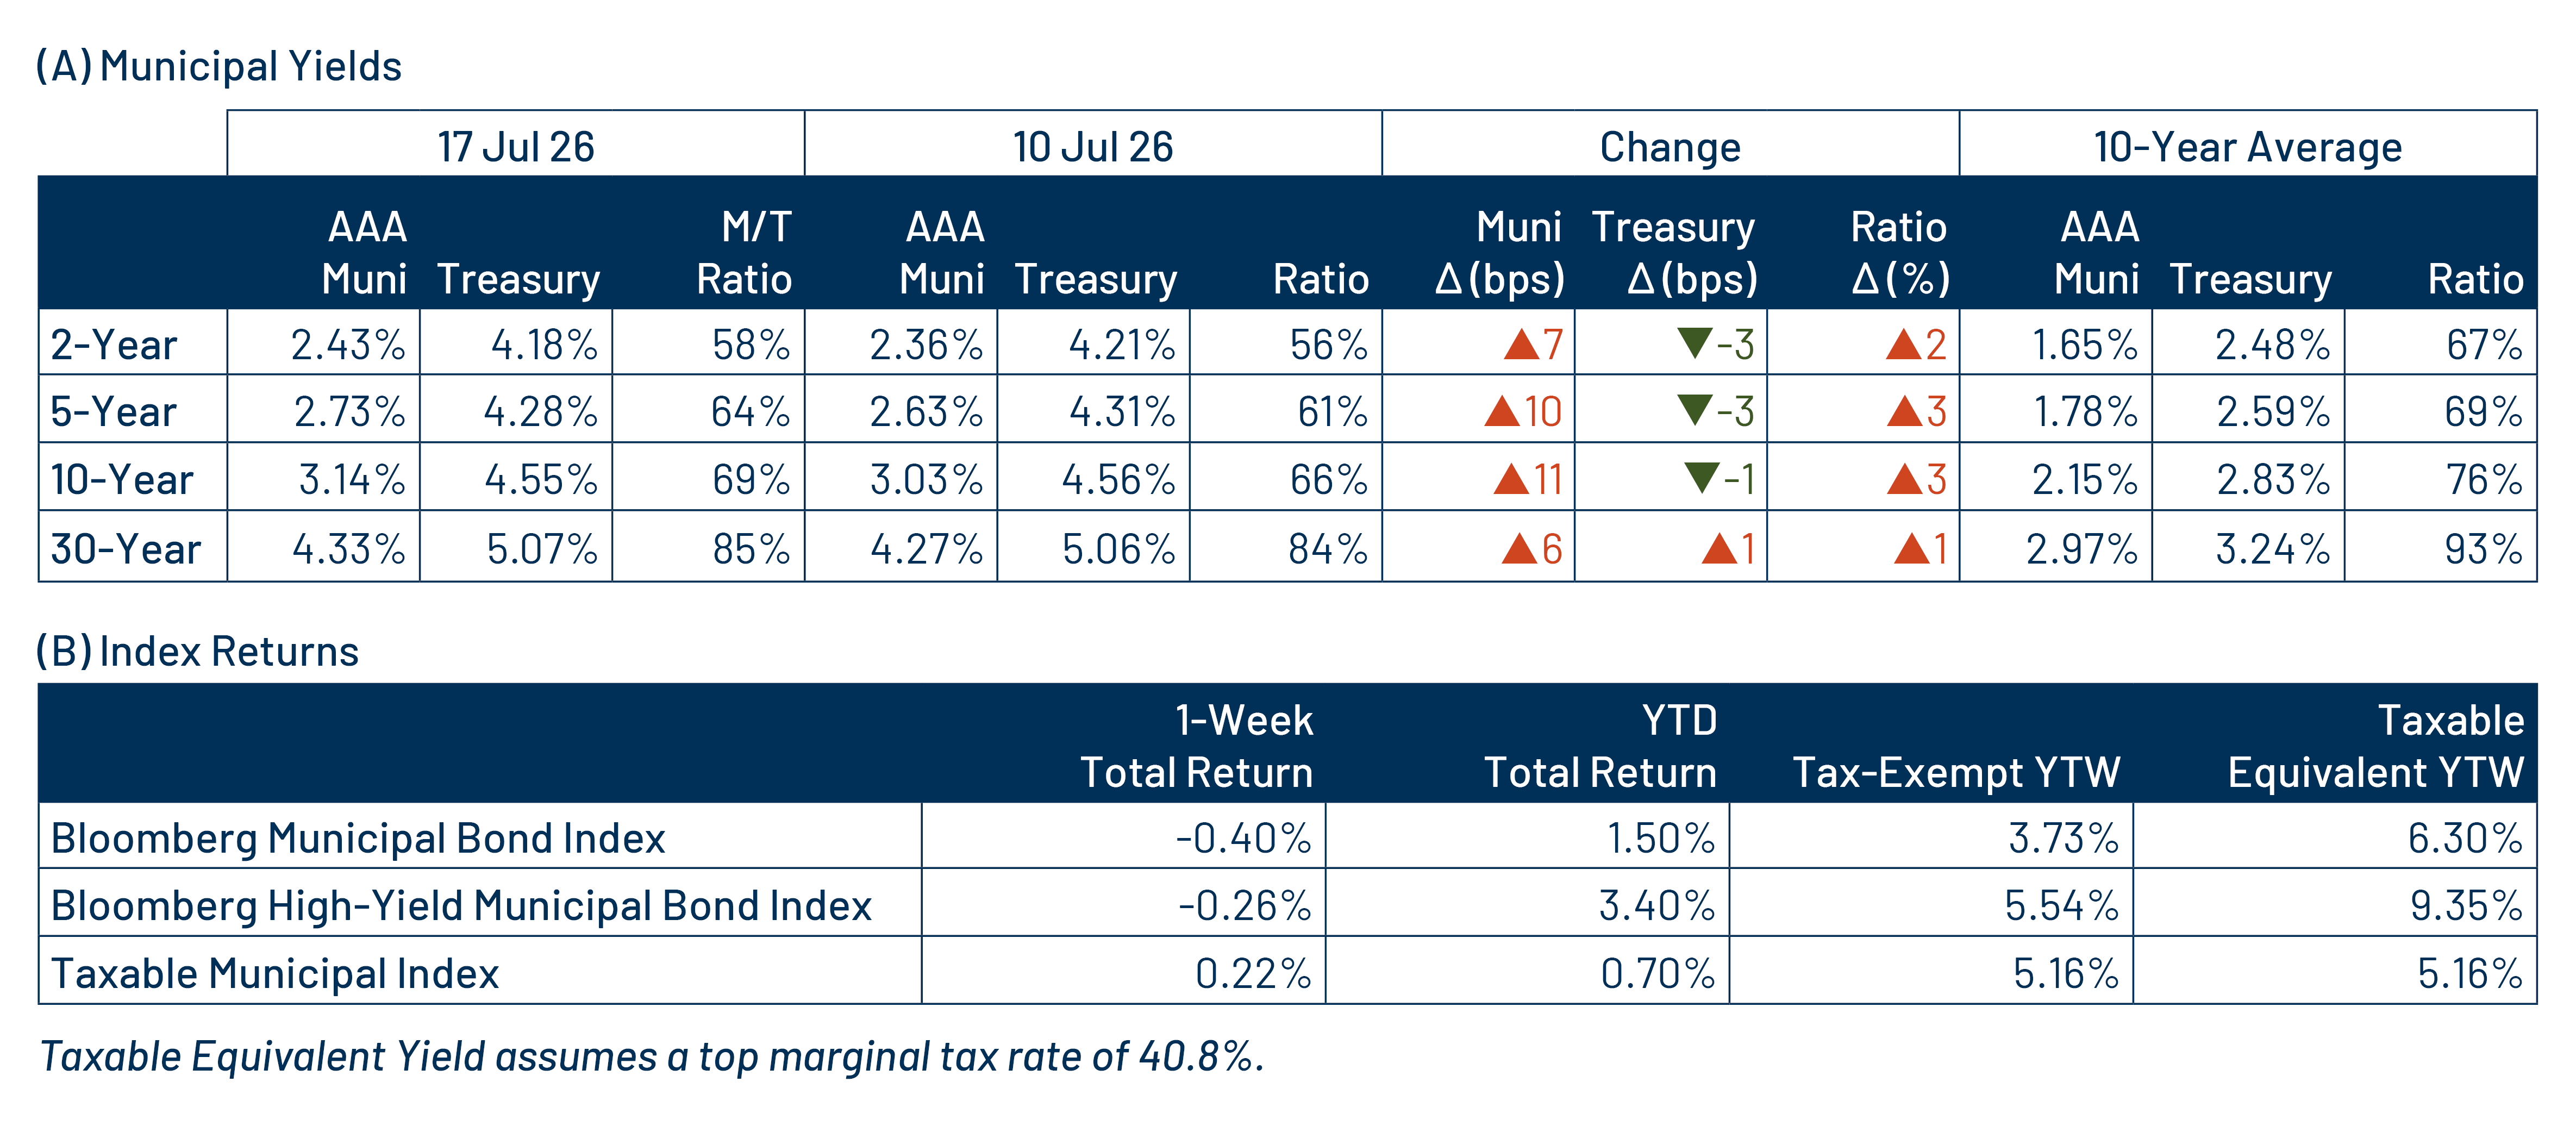
Exhibit 6: AAA Munis vs. Treasuries
AAA Munis vs. Treasuries
Source: Muni Yields: Thomson Reuters MMD, Treasury Yields: Bloomberg. As of 17 Jul 26. Past performance is not a guarantee of future results. It is not possible to invest directly in an index. Select the image to expand the view.
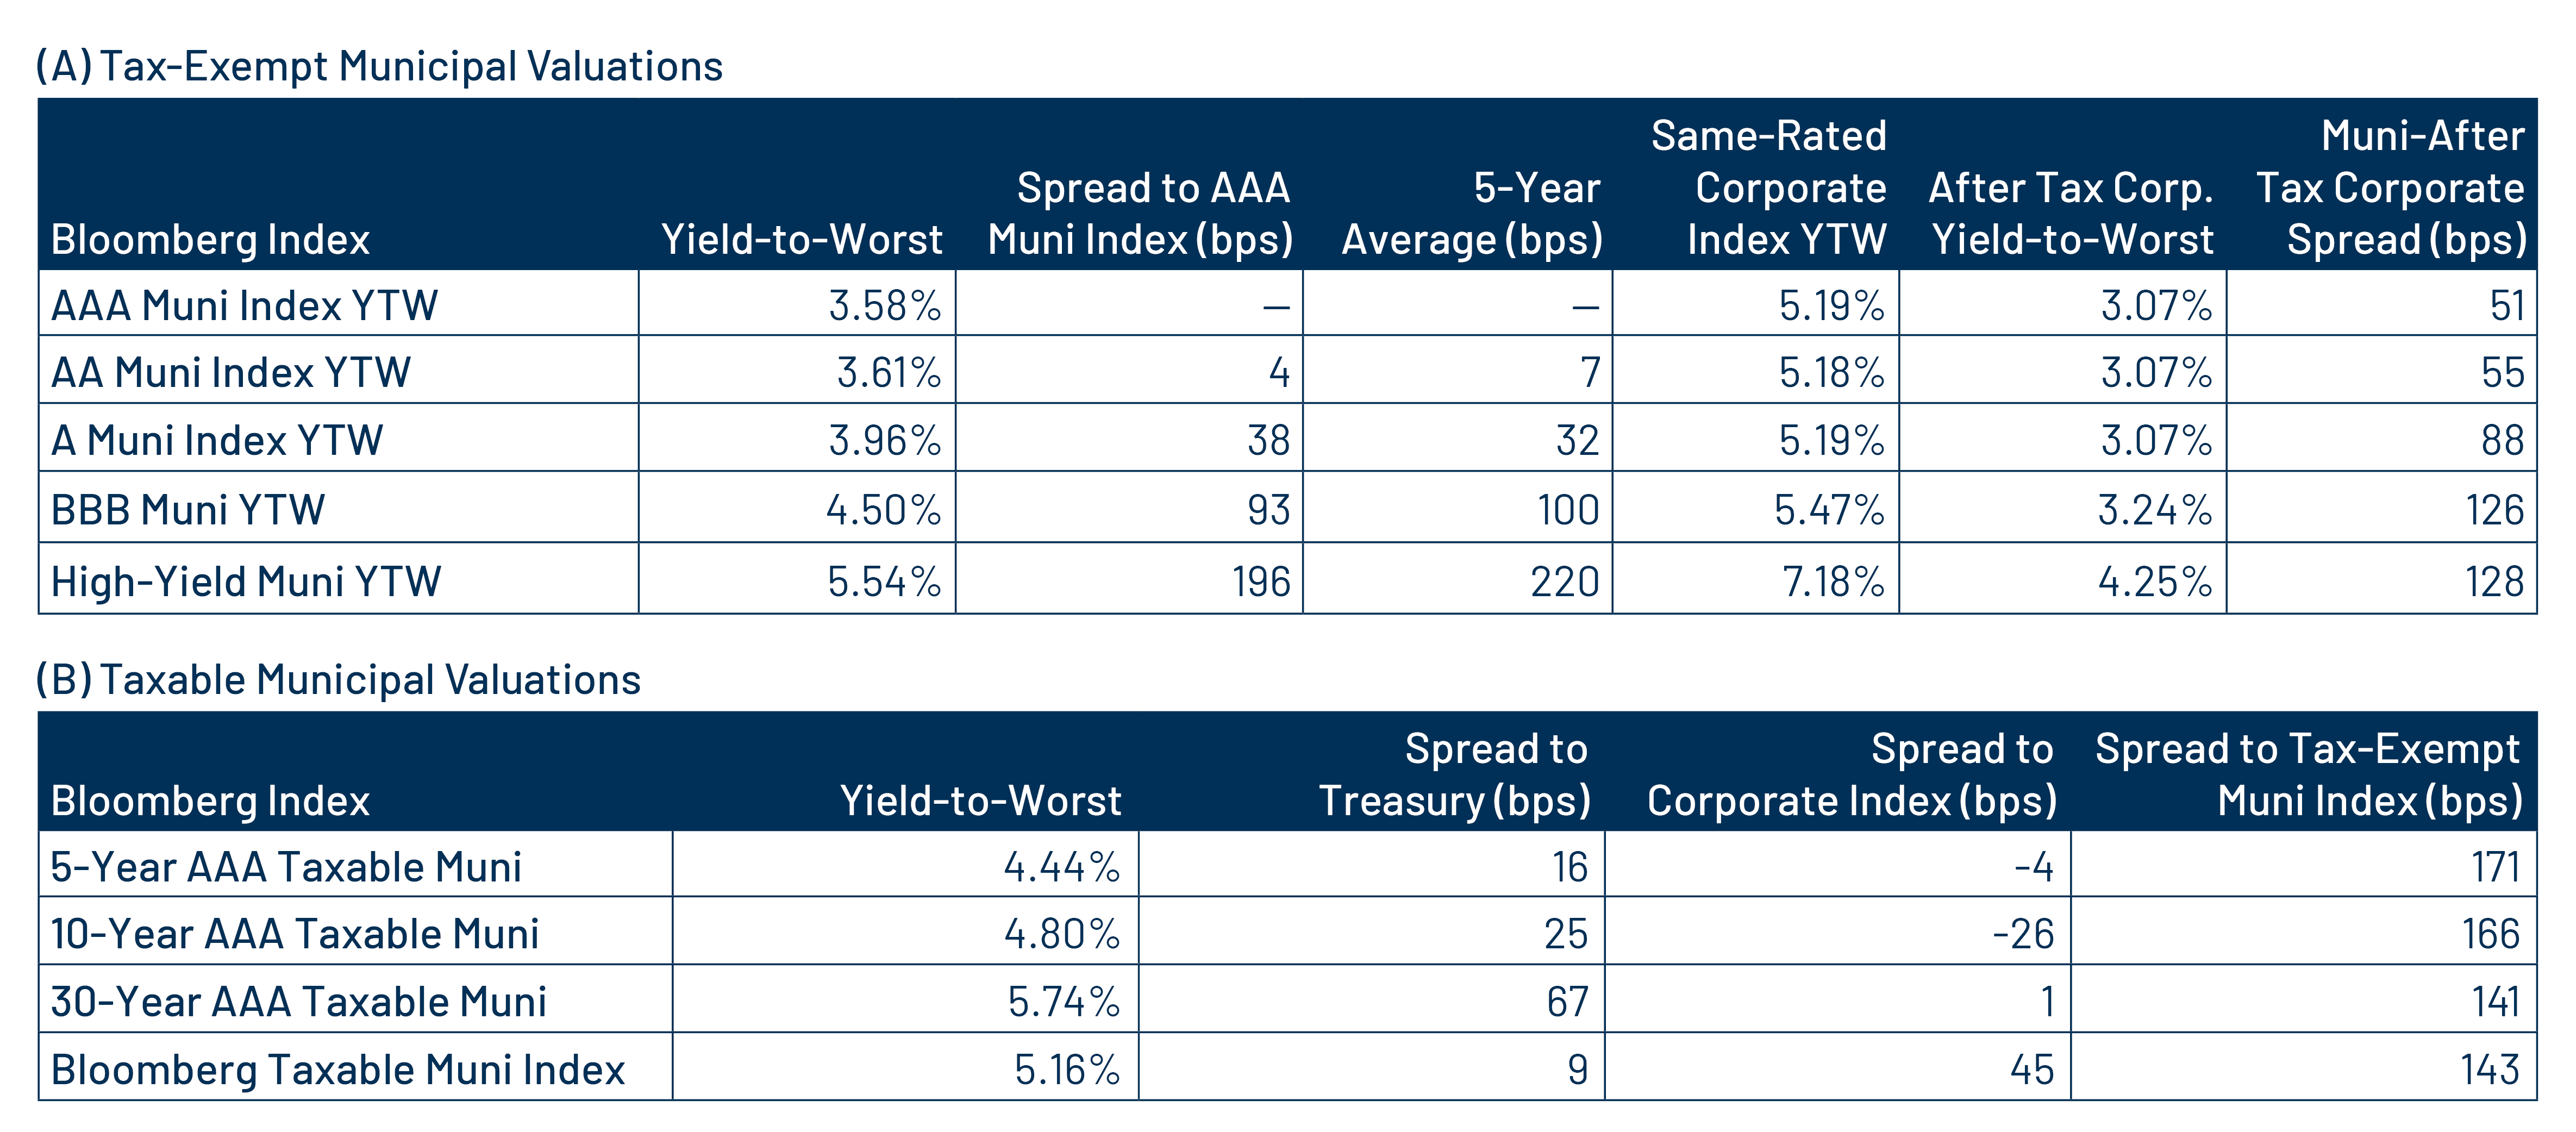
Exhibit 7: Tax-Exempt and Taxable Muni Valuations
Tax-Exempt and Taxable Muni Valuations
Source: Bloomberg, Western Asset. As of 17 Jul 26. Yield-to-worst (YTW) is the lowest potential yield that can be received on a bond without the issuer actually defaulting. AAA, AA, A, BBB Corporate Indices; After-Tax Yield assumes a top effective tax rate of 40.8%. Taxable Muni Index Corporate comparable used is the Global Corporate Aggregate (ex. BBB) to better align credit quality and duration. Select the image to expand the view.

Western Asset Key Themes for Muni Investors

Theme 1: Municipal taxable-equivalent yields remain elevated relative to historical averages.
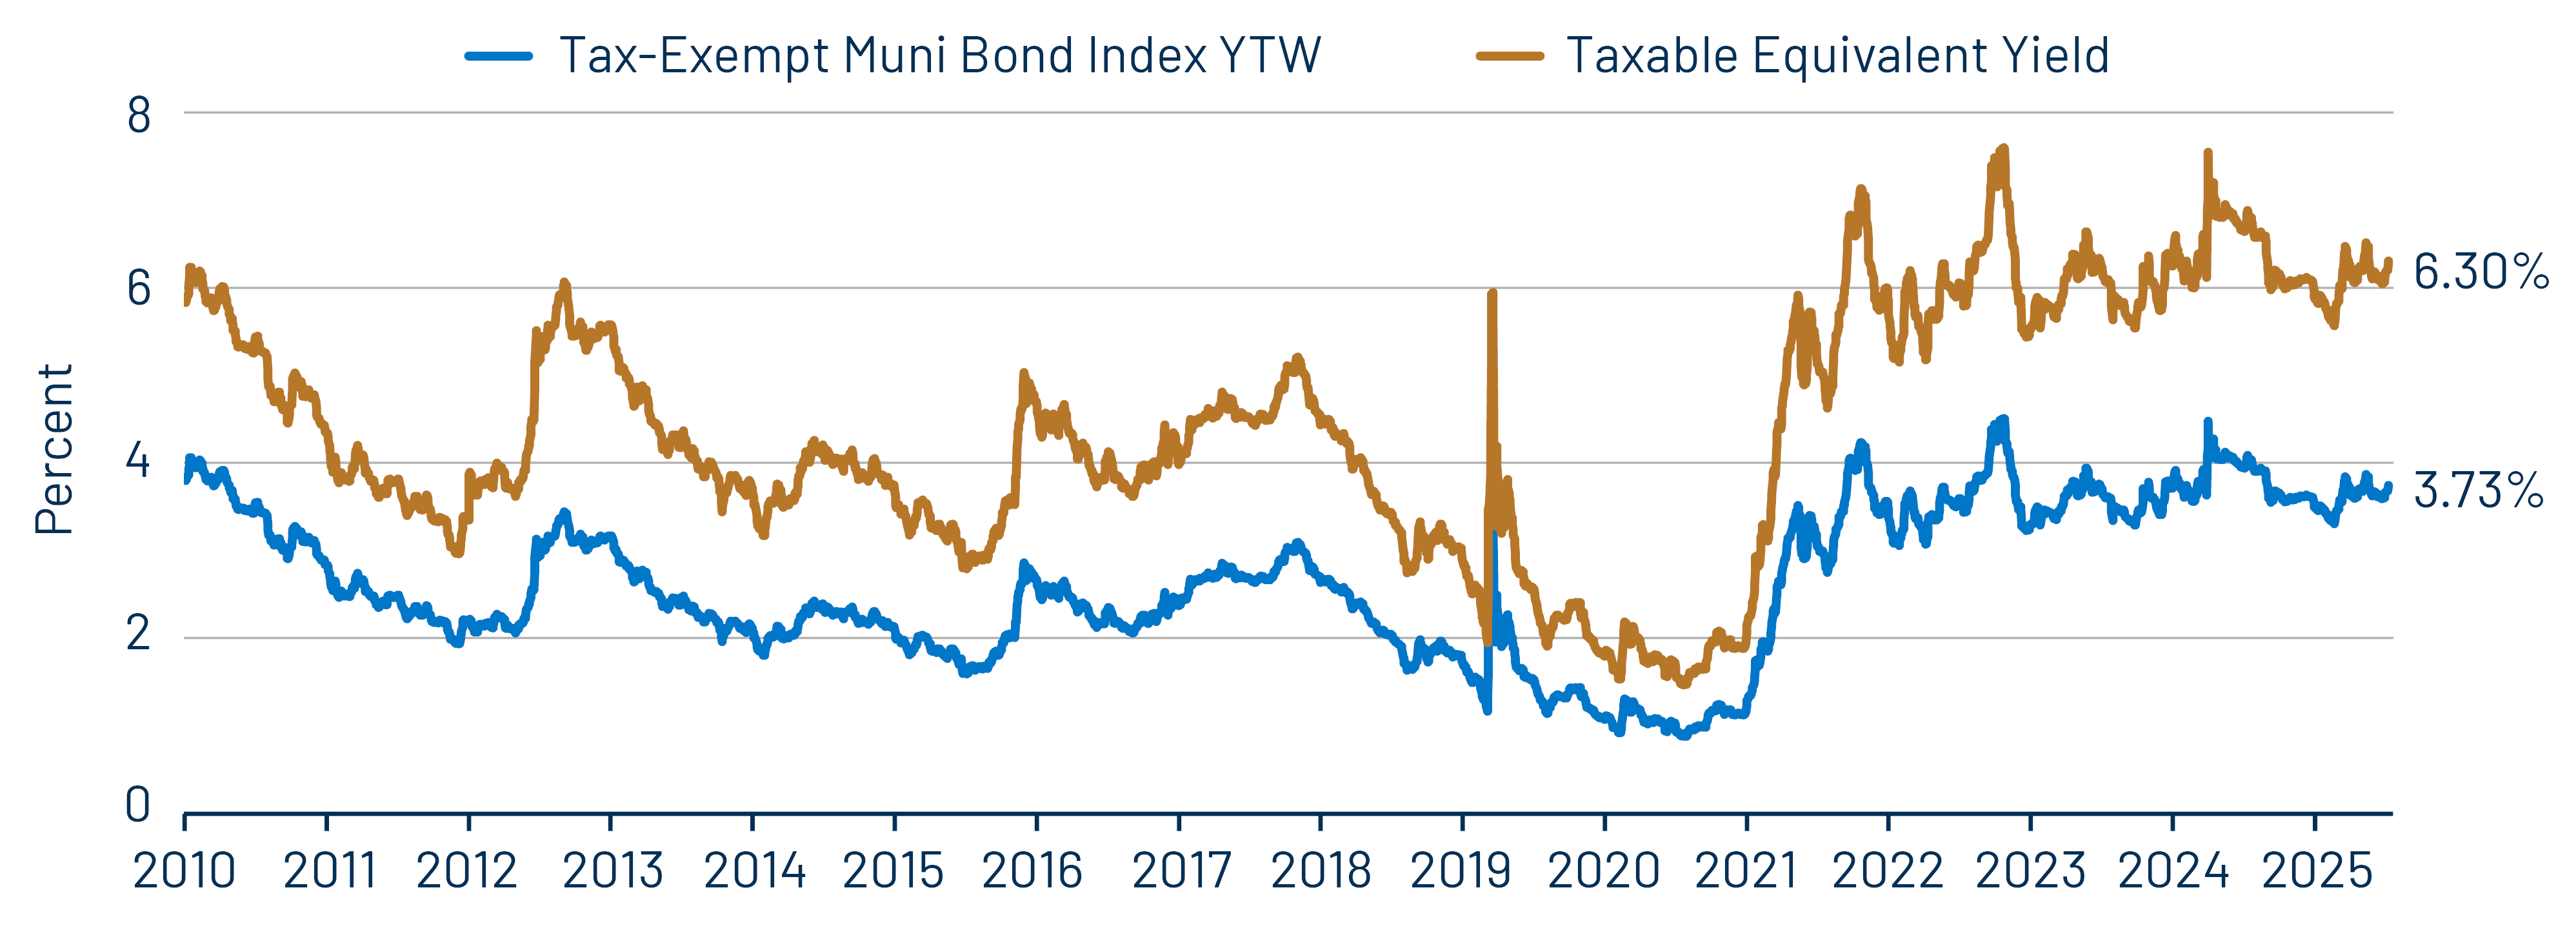
Exhibit 8: Muni and Taxable-Equivalent Muni Yield-to-Worst
Muni and Taxable-Equivalent Muni Yield-to-Worst
Source: Bloomberg, Western Asset. As of 17 Jul 26. Bloomberg Municipal Bond Index yield considering highest marginal tax rate of 40.8%. Indexes are unmanaged and one cannot directly invest in them. They do not include fees, expenses or sales charges. Past performance is not an indicator or a guarantee of future results. Select the image to expand the view.

Theme 2: Munis offer attractive after-tax yield pickup vs. longer-duration or lower-quality taxable alternatives.
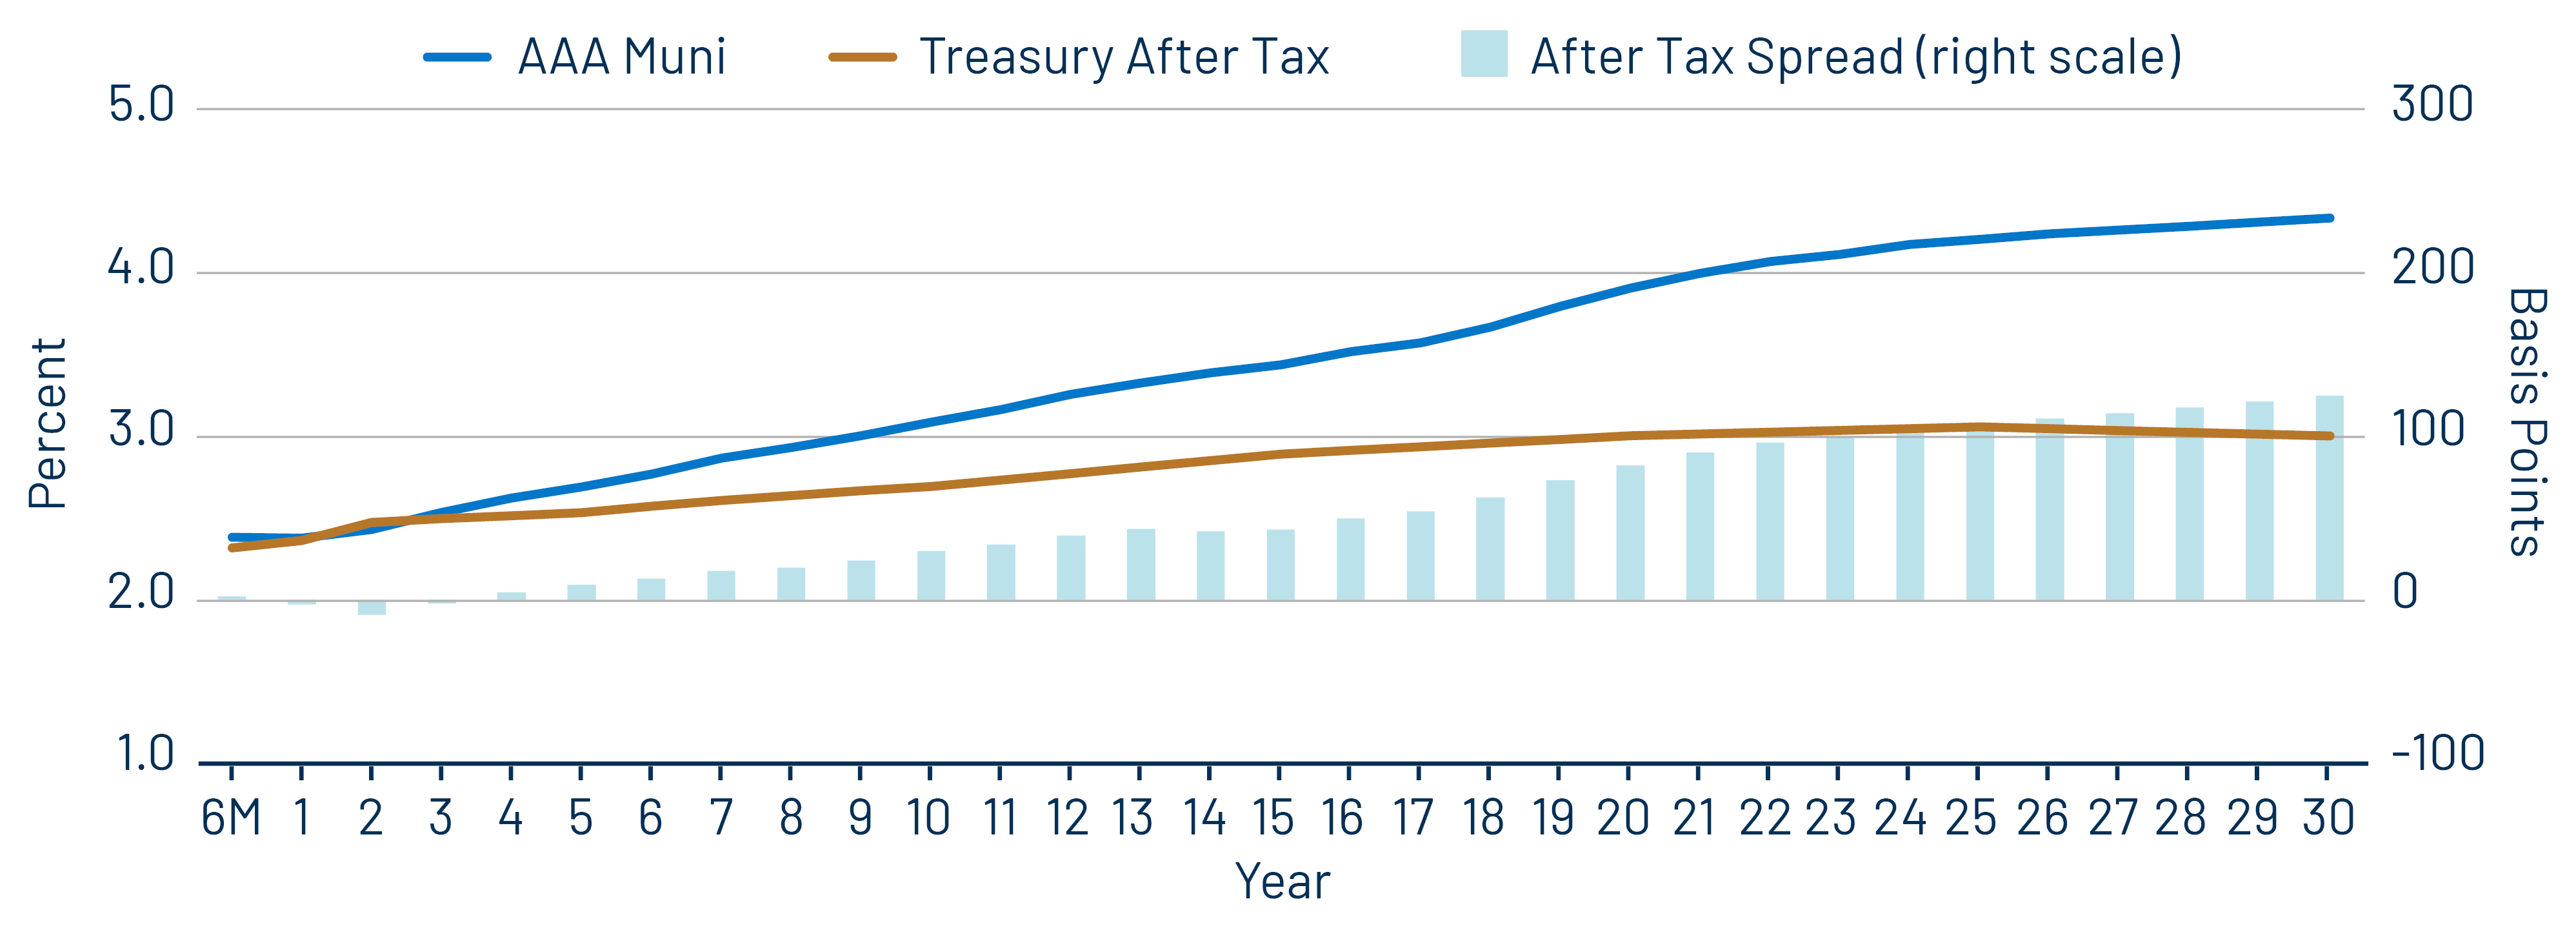
Exhibit 9: AAA Municipal vs. Treasury Yield Curves
AAA Municipal vs. Treasury Yield Curves
Source: Bloomberg, Western Asset. As of 17 Jul 26. Bloomberg Valuation Service (BVAL) AAA Muni Curve and US On-/Off-the-Run Sovereign Curve. Indexes are unmanaged and one cannot directly invest in them. They do not include fees, expenses or sales charges. Past performance is not an indicator or a guarantee of future results. Select the image to expand the view.

Theme 3: The muni curve remains steep and offers relative value in longer maturities.
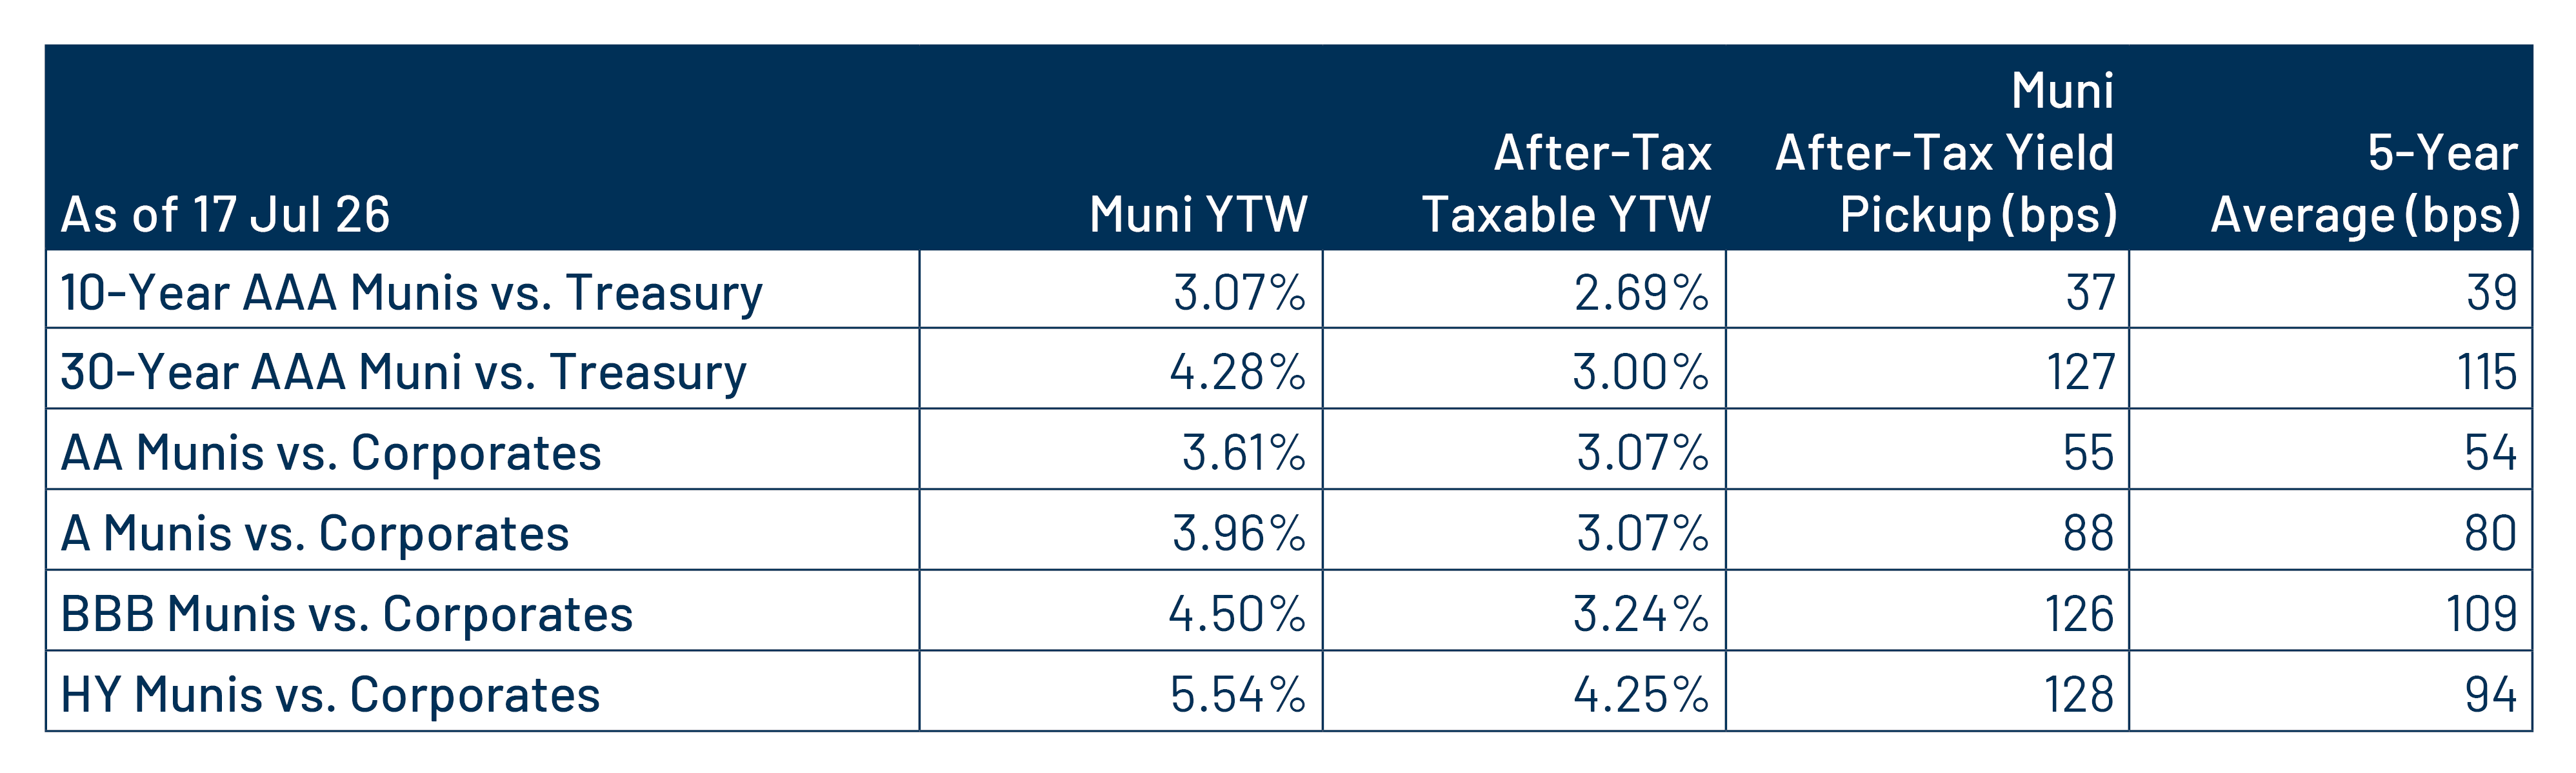
Exhibit 10: Municipal vs. Taxable Fixed-Income Yields by Quality
Municipal vs. Taxable Fixed-Income Yields by Quality
Source: Western Asset, Bloomberg. As of 17 Jul 26. 10- and 30-Year comparison reflects Bloomberg Valuation Service (BVAL) AAA Muni Curve and US On-/Off-the-Run Sovereign Curve. AA Muni reflects the Bloomberg AA Muni Bond Index. A Muni reflects the Bloomberg A Muni Bond Index. BBB Muni reflects the Bloomberg BBB Muni Bond Index. HY Muni reflects the Bloomberg High Yield Muni Bond Index. AA Corp reflects the Bloomberg AA Corporate Bond Index. A Corp reflects the Bloomberg A Corporate Bond Index. BBB Corp reflects the Bloomberg BBB Corporate Bond Index. After-tax yield considers the top marginal tax rate of 40.8%. Indexes are unmanaged and one cannot directly invest in them. They do not include fees, expenses or sales charges. Past performance is not an indicator or a guarantee of future results. Select the image to expand the view.

投資一任契約および金融商品に係る投資顧問料(消費税を含む):
投資一任の場合は運用財産の額に対して、年率1.10%(税抜き1.00%)を上限とする運用手数料を、運用戦略ごとに定めております。また、別途運用成果に応じてお支払いいただく手数料(成功報酬)を設定する場合があります。その料率は、運用成果の評価方法や固定報酬率の設定方法により変動しますので、手数料の金額や計算方法をこの書面に記載することはできません。

投資信託の場合は投資信託ごとに信託報酬が定められておりますので、目論見書または投資信託約款でご確認ください。有価証券の売買又はデリバティブ取引の売買手数料を運用財産の中からお支払い頂きます。投資信託に投資する場合は信託報酬、管理報酬等の手数料が必要となります。これらの手数料には多様な料率が設定されているためこの書面に記載することはできません。デリバティブ取引を利用する場合、運用財産から委託証拠金その他の保証金を預託する場合がありますが、デリバティブ取引の額がそれらの額を上回る可能性があります。その額や計算方法はこの書面に記載することはできません。投資一任契約に基づき運用財産の運用を行った結果、金利、通貨の価格、金融商品市場における相場その他の指標に係る変動により、損失が生ずるおそれがあります。損失の 額が、運用財産から預託された委託証拠金その他の保証金の額を上回る恐れがあります。個別交渉により、一部のお客様とより低い料率で投資一任契約を締結する場合があります。

© Western Asset Management Company Ltd 2026. 本資料の著作権は、ウエスタン・アセット・マネジメント株式会社およびその関連会社(以下「ウエスタン・アセット」という)に帰属するものであり、意図した受取人のみを対象として作成されたものです。本資料に記載の内容は、秘密情報及び専有情報としてお取り扱いください。ウエスタン・アセットの書面による事前の承諾なしに、全部又は一部を無断で複写、複製することや転載することを堅くお断りいたします。

過去の運用実績は将来の運用実績を示すものではありません。また、本資料は、将来の実績を予測または予想するものではありません。

本資料は、適格機関投資家、特定投資家、企業年金基金、公的年金等、豊富な投資経験と高度な専門知識とを備えたプロフェッショナルのお客様のみにご提供するものです。

本資料は情報の提供のみを目的としています。資料作成時点のウエスタン・アセットの見解を掲載したものであり、将来予告なしに変更する場合があります。また、リアルタイムの市場動向や運用に関する見解ではありません。

本資料で第三者のデータが使用されている場合、ウエスタン・アセットはそのデータが公表時点で正確であると信じていますが、それを保証するものではありません。ウエスタン・アセットの戦略・商品の受賞またはランキングが含まれている場合、これらは独立した第三者または業界出版物により公平な定量・定性情報に基づき決定されたものです。ウエスタン・アセットは、これらの第三者の標準的な業界サービスを利用したり、出版物を購読したりする場合がありますが、それらは、すべてのアセット・マネージャーが利用可能なものであり、ランキングや受賞に影響を与えるものではありません。

本資料に記載の戦略・商品には、元本の一部または全部の損失を含む大きなリスクが伴う場合があります。また、当該戦略や商品に投資することは大きな変動を伴う可能性があり、投資家にはそのようなリスクを受け入れる経済力および意思を持つことが求められます。

特段の注記がない限り、本資料に記載の戦略のパフォーマンスはコンポジットのデータです。コンポジットではないその他のデータについては、当戦略の運用方針に最も近いと考えられる口座を、コンポジットの代表口座として掲載しています。つまり、代表口座は運用結果により選択されるものではありません。代表口座のポートフォリオ特性は、コンポジットやその他のコンポジット構成口座と異なる場合があります。これらの口座についての情報はご依頼に応じてご提供いたします。

本資料に記載している内容は、ウエスタン・アセットの投資家に対する投資助言ではありません。個別銘柄・発行体に関する一般的または具体的に言及する内容は、例としてご提示したものであり、購入または売却を推奨するものでもありません。また、ウエスタン・アセットの役職員及びお客様は、本資料に記載の有価証券を保有している可能性があります。

本資料は、会計、法務、税務、投資またはその他の助言の提供を意図したものではなく、またそれらに依存すべきではありません。お客様は、ウエスタン・アセットが提供する戦略・商品への投資を行うにあたり、経済的リスクやメリットなどについて助言が必要である場合は、ご自身の弁護士、会計士、投資家、税理士、その他のアドバイザーに相談して下さい。お客様は、居住国で適用される法令を遵守する責任を負います。

ウエスタン・アセットは世界有数の運用専門会社です。1971年の設立以来、債券運用に特化したアクティブ運用機関として最大規模の運用資産と運用チームを有しています。拠点は米国カリフォルニア州パサデナ、ニューヨーク、英国ロンドン、シンガポール、東京、豪メルボルン、香港、スイス・チューリッヒにあり、フランクリン・リソーシズIncの完全子会社ですが、経営全般に独立性を保っております。構成法人:米国:ウエスタン・アセット・マネジメント・カンパニーLLC(米証券取引委員会(SEC)登録の投資顧問会社)。オーストラリア・メルボルン:ウエスタン・アセット・マネジメント・カンパニーPty Ltd(事業者番号ABN 41 117 767 923。オーストラリア金融サービスライセンス(AFSL)番号303160(オーストラリア証券投資委員会(ASIC)が規制)。シンガポール:ウエスタン・アセット・マネジメント・カンパニーPte. Ltd.(CMSライセンスCo. Reg. No. 200007692R、シンガポール通貨監督庁が監督)。日本:ウエスタン・アセット・マネジメント株式会社(金融商品取引業者、金融庁が規制)。英国:ウエスタン・アセット・マネジメント・カンパニーLimited(英金融行動監視機構(FCA)が認可(FRN145930)、規制)。本資料は英国ではFCAが定義する「プロフェッショナルな顧客」のみを対象とした宣伝目的に使用されます。許可された欧州経済領域 (EEA)加盟国へ配信する場合もあります。最新の承認済みEEA加盟国のリストは電話(+44 (0)20 7422 3000)にてお問い合わせください。

詳細は当社ウエブサイトwww.westernasset.co.jpをご参照ください。

ウエスタン・アセット・マネジメント株式会社について
業務の種類: 金融商品取引業者(投資運用業、投資助言・代理業、第二種金融商品取引業)
登録番号: 関東財務局長(金商)第427号
加入協会: 一般社団法人資産運用業協会(会員番号011-01319)