Munis Rallied Last Week
Investment-grade munis posted strong returns last week as municipal yields moved lower across the curve. After moving lower with Treasuries early in the week, high-grade municipals outperformed the rate selloff on Friday following stronger-than-anticipated payrolls data. Meanwhile, muni supply hit its highest level since 2017 as flows turned positive. The Bloomberg Municipal Index returned 1.07% during the week, the High Yield Muni Index returned 1.29% and the Taxable Muni Index returned 0.65%. This week we highlight the robust municipal issuance observed this year.
Weaker Technicals Were Driven by an Elevated New-Issue Calendar
Fund Flows: During the week ending June 5, weekly reporting municipal mutual funds recorded $549 million of net inflows, according to Lipper. Long-term funds recorded $561 million of inflows, intermediate funds recorded $35 million of inflows and high-yield funds recorded $154 million of inflows. Short-term funds recorded $26 million of outflows. This week’s inflows led estimated year-to-date (YTD) net inflows higher to $11.5 billion.
Supply: The muni market recorded $16 billion of new-issue volume last week, up nearly three times from the prior week. YTD issuance of $207 billion is 43% higher than last year’s level, with tax-exempt issuance 51% higher and taxable issuance 3% lower year-over-year (YoY). This week’s calendar is expected to decline to $8 billion. Largest deals include $700 million Los Angeles County and $437 million Oklahoma Industries Authority transactions.
This Week in Munis: Supply Surge
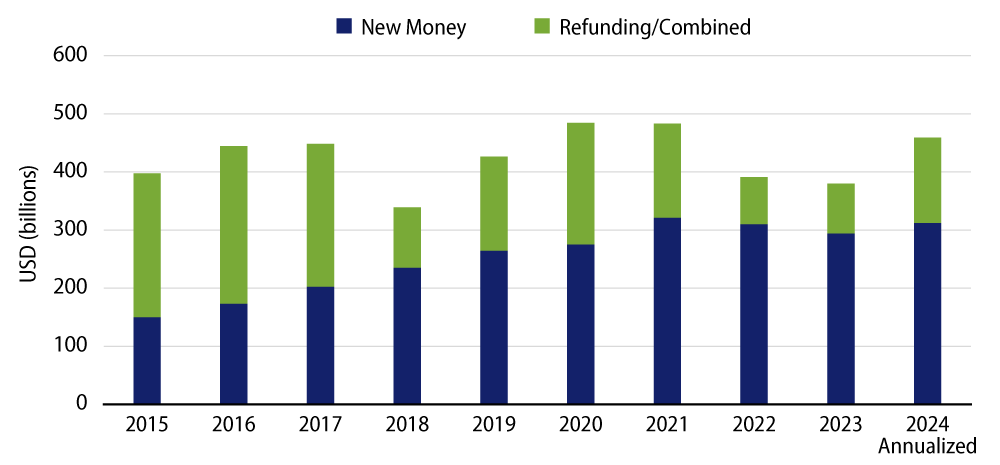
Last week’s $16 billion of muni supply marked the highest weekly level of issuance since 2017 and continued a trend of elevated issuance observed this year. Through May 31, 2024, YTD municipal issuance of $193 billion marked the highest level of issuance for the first five months of a year in over a decade. Municipal supply is now on pace to exceed $460 billion for the 2024 calendar year, which would represent a 26% increase from 2023 levels.

This year’s elevated supply has been largely driven by tax-exempt refunding issuance, as refunding-related issuance is on track to increase 72% YoY. The higher refunding activity is attributable to issuers refinancing taxable municipal debt that was issued in recent years, taking advantage of the better relative value offered by the tax-exempt market in the higher rate environment. In addition to taxable refunding, because the tax-exempt advanced refunding provision was outlawed in 2017, a greater level of tax-exempt debt is reaching current call dates, contributing to additional current refunding volume.
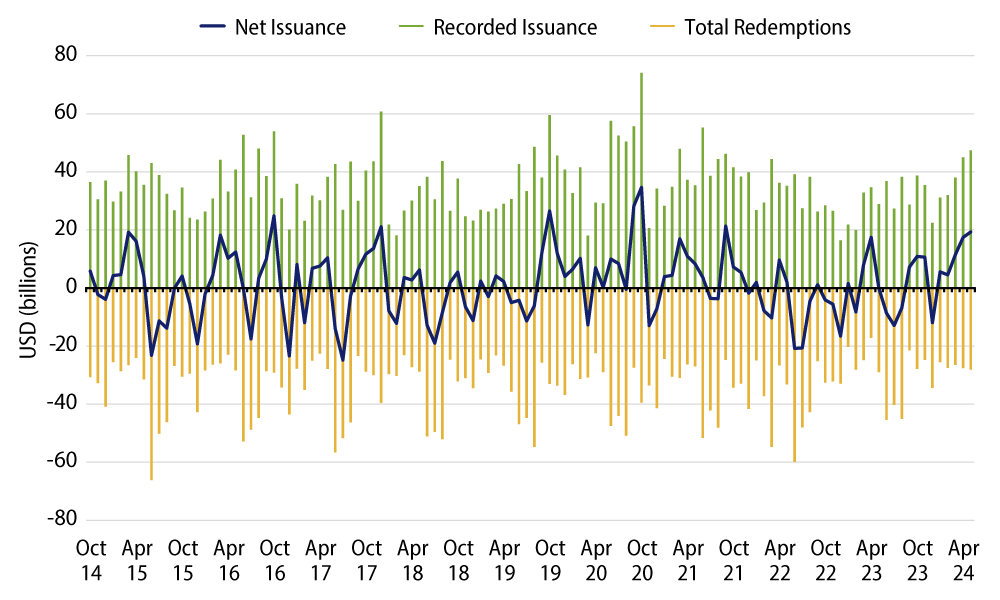
Following years of negative tax-exempt net issuance trends that have limited growth and supported a strong technical backdrop for the municipal asset class, 2024 net new tax-exempt issuance has been positive and totaled $58 billion. The higher supply levels observed have contributed to weaker market technicals and underperformance versus high-grade taxable fixed-income. As a result, nominal municipal yields and after-tax relative valuations versus Treasuries and corporate fixed-income are more compelling than at the start of the year, contributing to an attractive value proposition for investors subject to tax rates.
Municipal Credit Curves and Relative Value


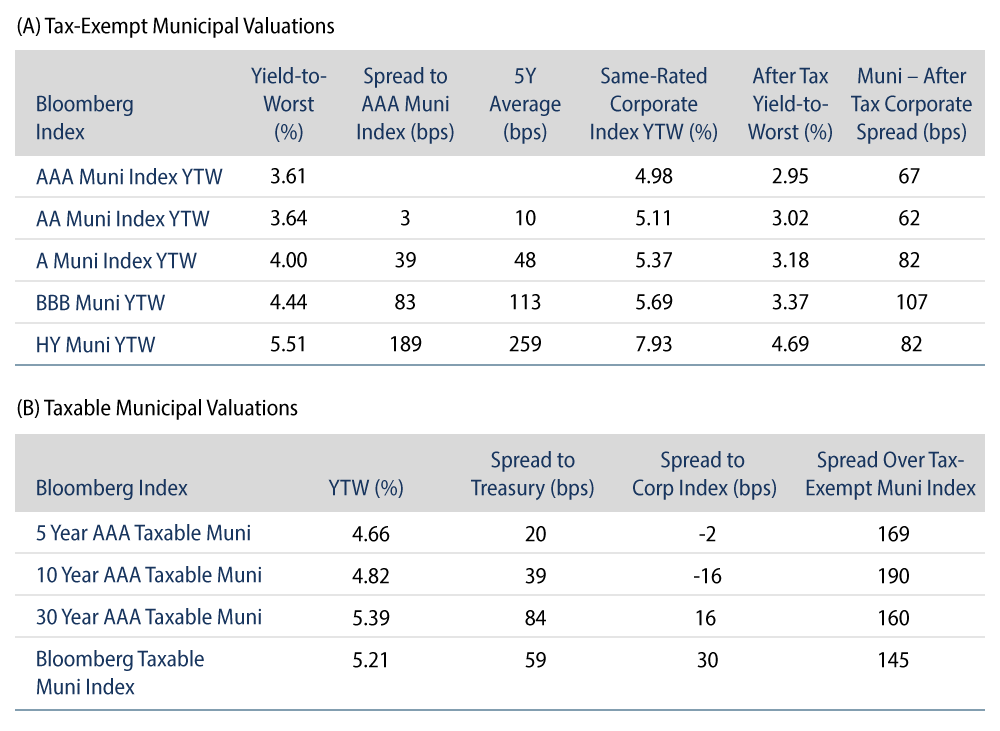
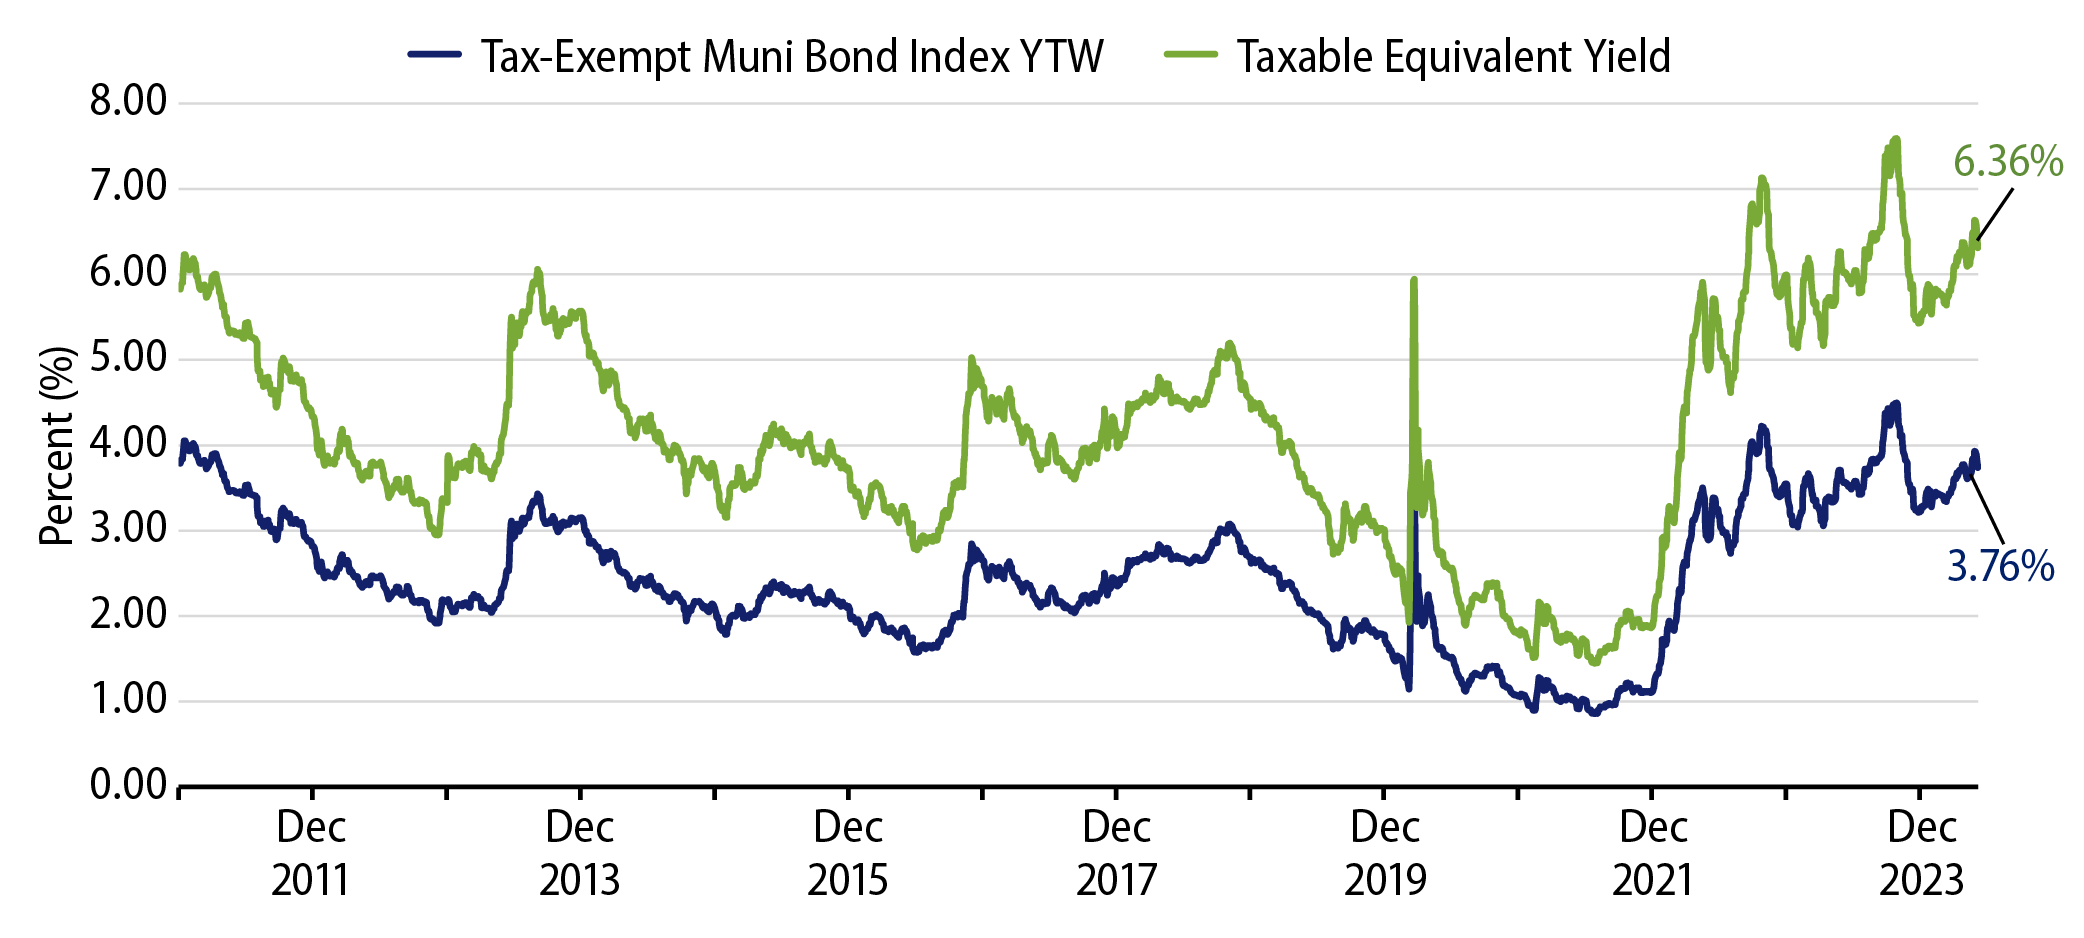
Theme #1: Municipal taxable-equivalent yields are above decade averages.
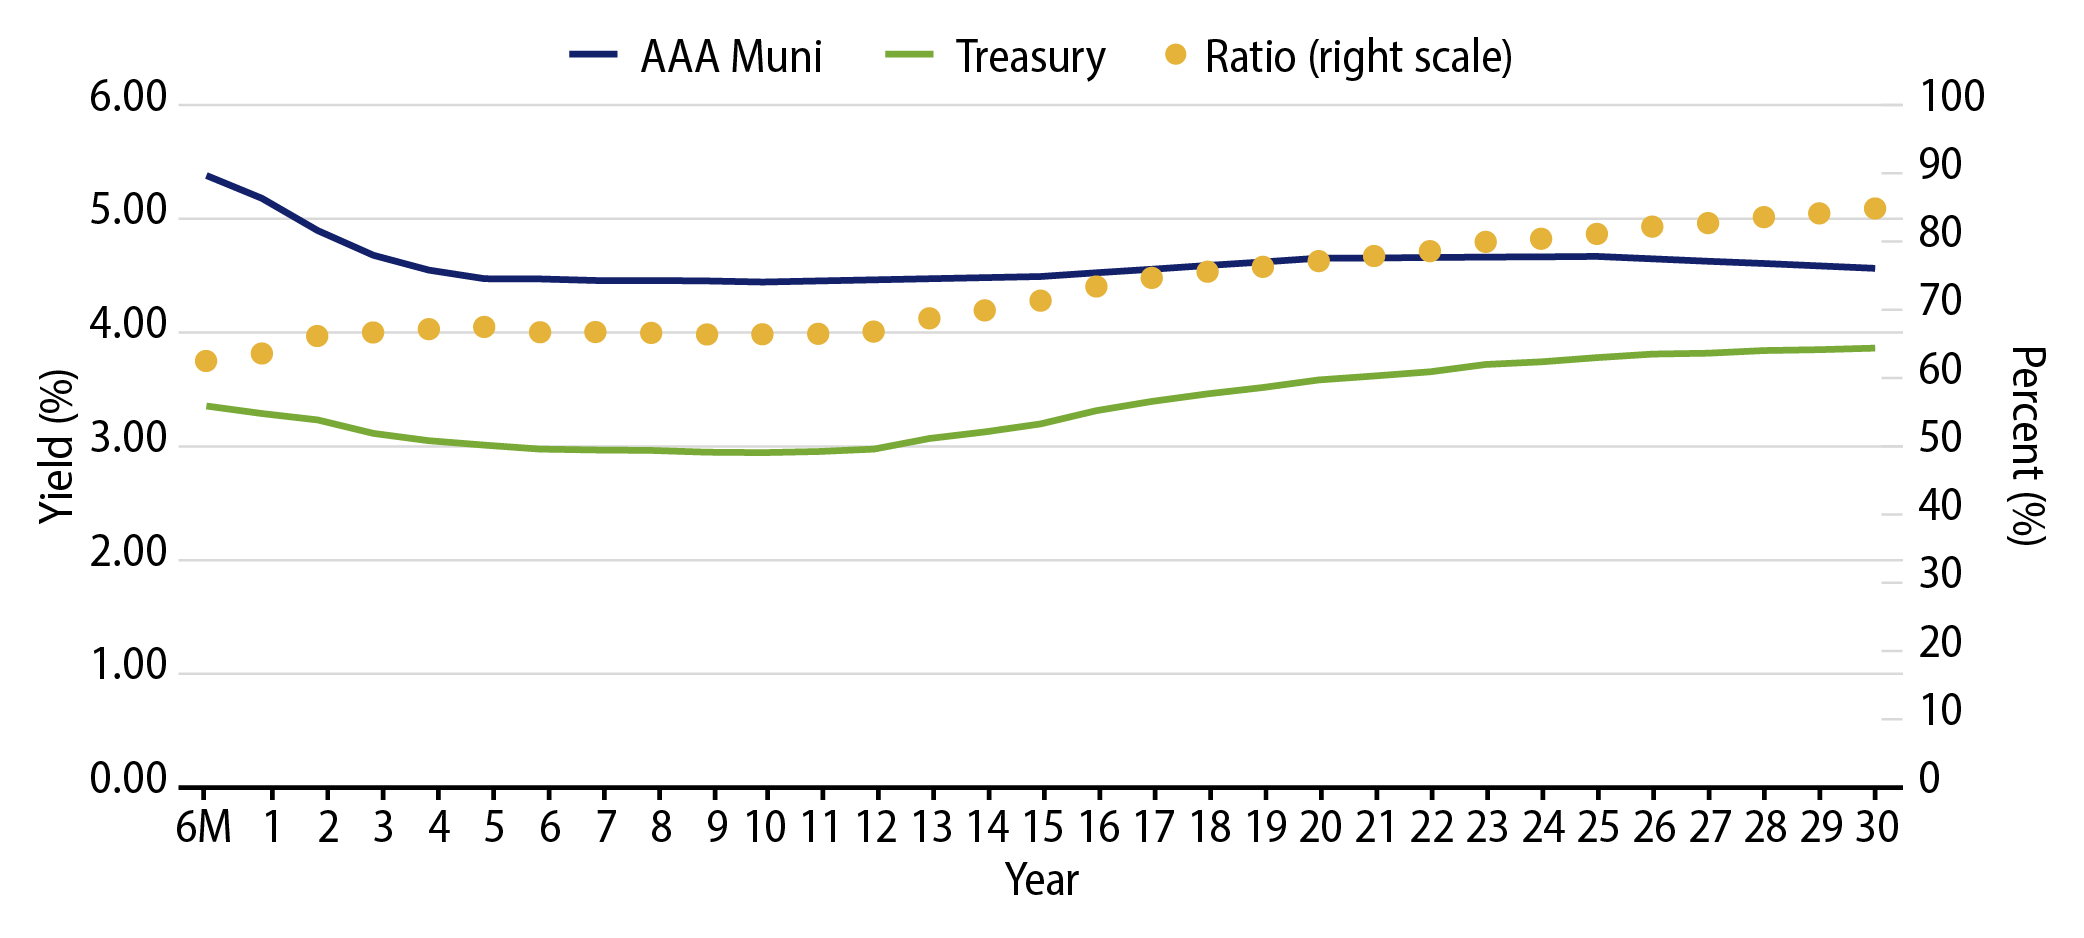
Theme #2: The muni yield curve remained inverted, leading to potential value in bar-belled structure.
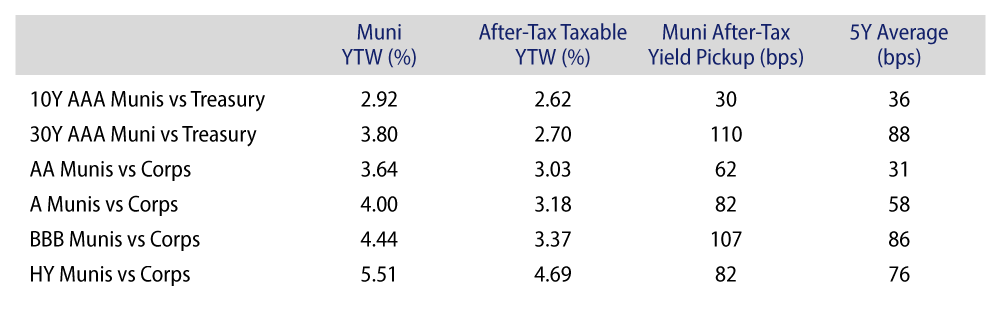
Theme #3: Munis offer attractive after-tax yield pickup versus long Treasuries and corporate credit.