Municipals Posted Negative Returns Last Week
Munis posted negative returns last week and outperformed Treasuries, as Treasury yields moved higher on stronger-than-anticipated core Consumer Price Index (CPI) and Producer Price Index (PPI) data. High-grade muni yields moved higher across the yield curve, and technicals improved as municipal mutual funds recorded inflows. The Bloomberg Municipal Index returned -0.07% during the week, the High Yield Muni Index returned 0.16% and the Taxable Muni Index returned -1.46%. This week we highlight wealth trends from recent IRS data.
Fund Flows and Supply Levels Continued to Move Higher
Fund Flows: During the week ending March 16, weekly reporting municipal mutual funds recorded $295 million of net inflows, according to Lipper. Long-term funds recorded $315 million of inflows, intermediate funds recorded $25 million of inflows and high-yield funds recorded $279 million of inflows. Short-term funds recorded $52 million of outflows. This week’s inflows lead estimated year-to-date (YTD) net inflows higher to $4.6 billion.
Supply: The muni market recorded $10 billion of new-issue volume last week, up 10% from the prior week. YTD issuance of $83 billion is 38% higher than last year’s level, with tax-exempt issuance 52% higher and taxable issuance 48% lower year-over-year (YoY). This week’s calendar is expected to decline to $7.5 billion. Largest deals include $1.2 billion NY Metropolitan Transportation Authority (MTA) and $770 million Florida Development Corp transactions.
This Week in Munis: Wealth Boom Bodes Well for Muni Demand
Recently released IRS income data for the 2021 tax year highlights overall income and wealth trends across the US. For the municipal market, this reported income data across tax brackets and states provides insight into tax collections and taxing power for municipalities, a key gauge of credit health. From a market technicals perspective, income trends also inform the composition of potential demand for municipal securities, not only shedding light on the number of taxpayers that can benefit from the municipal tax exemption, but also in which states demand could be highest.
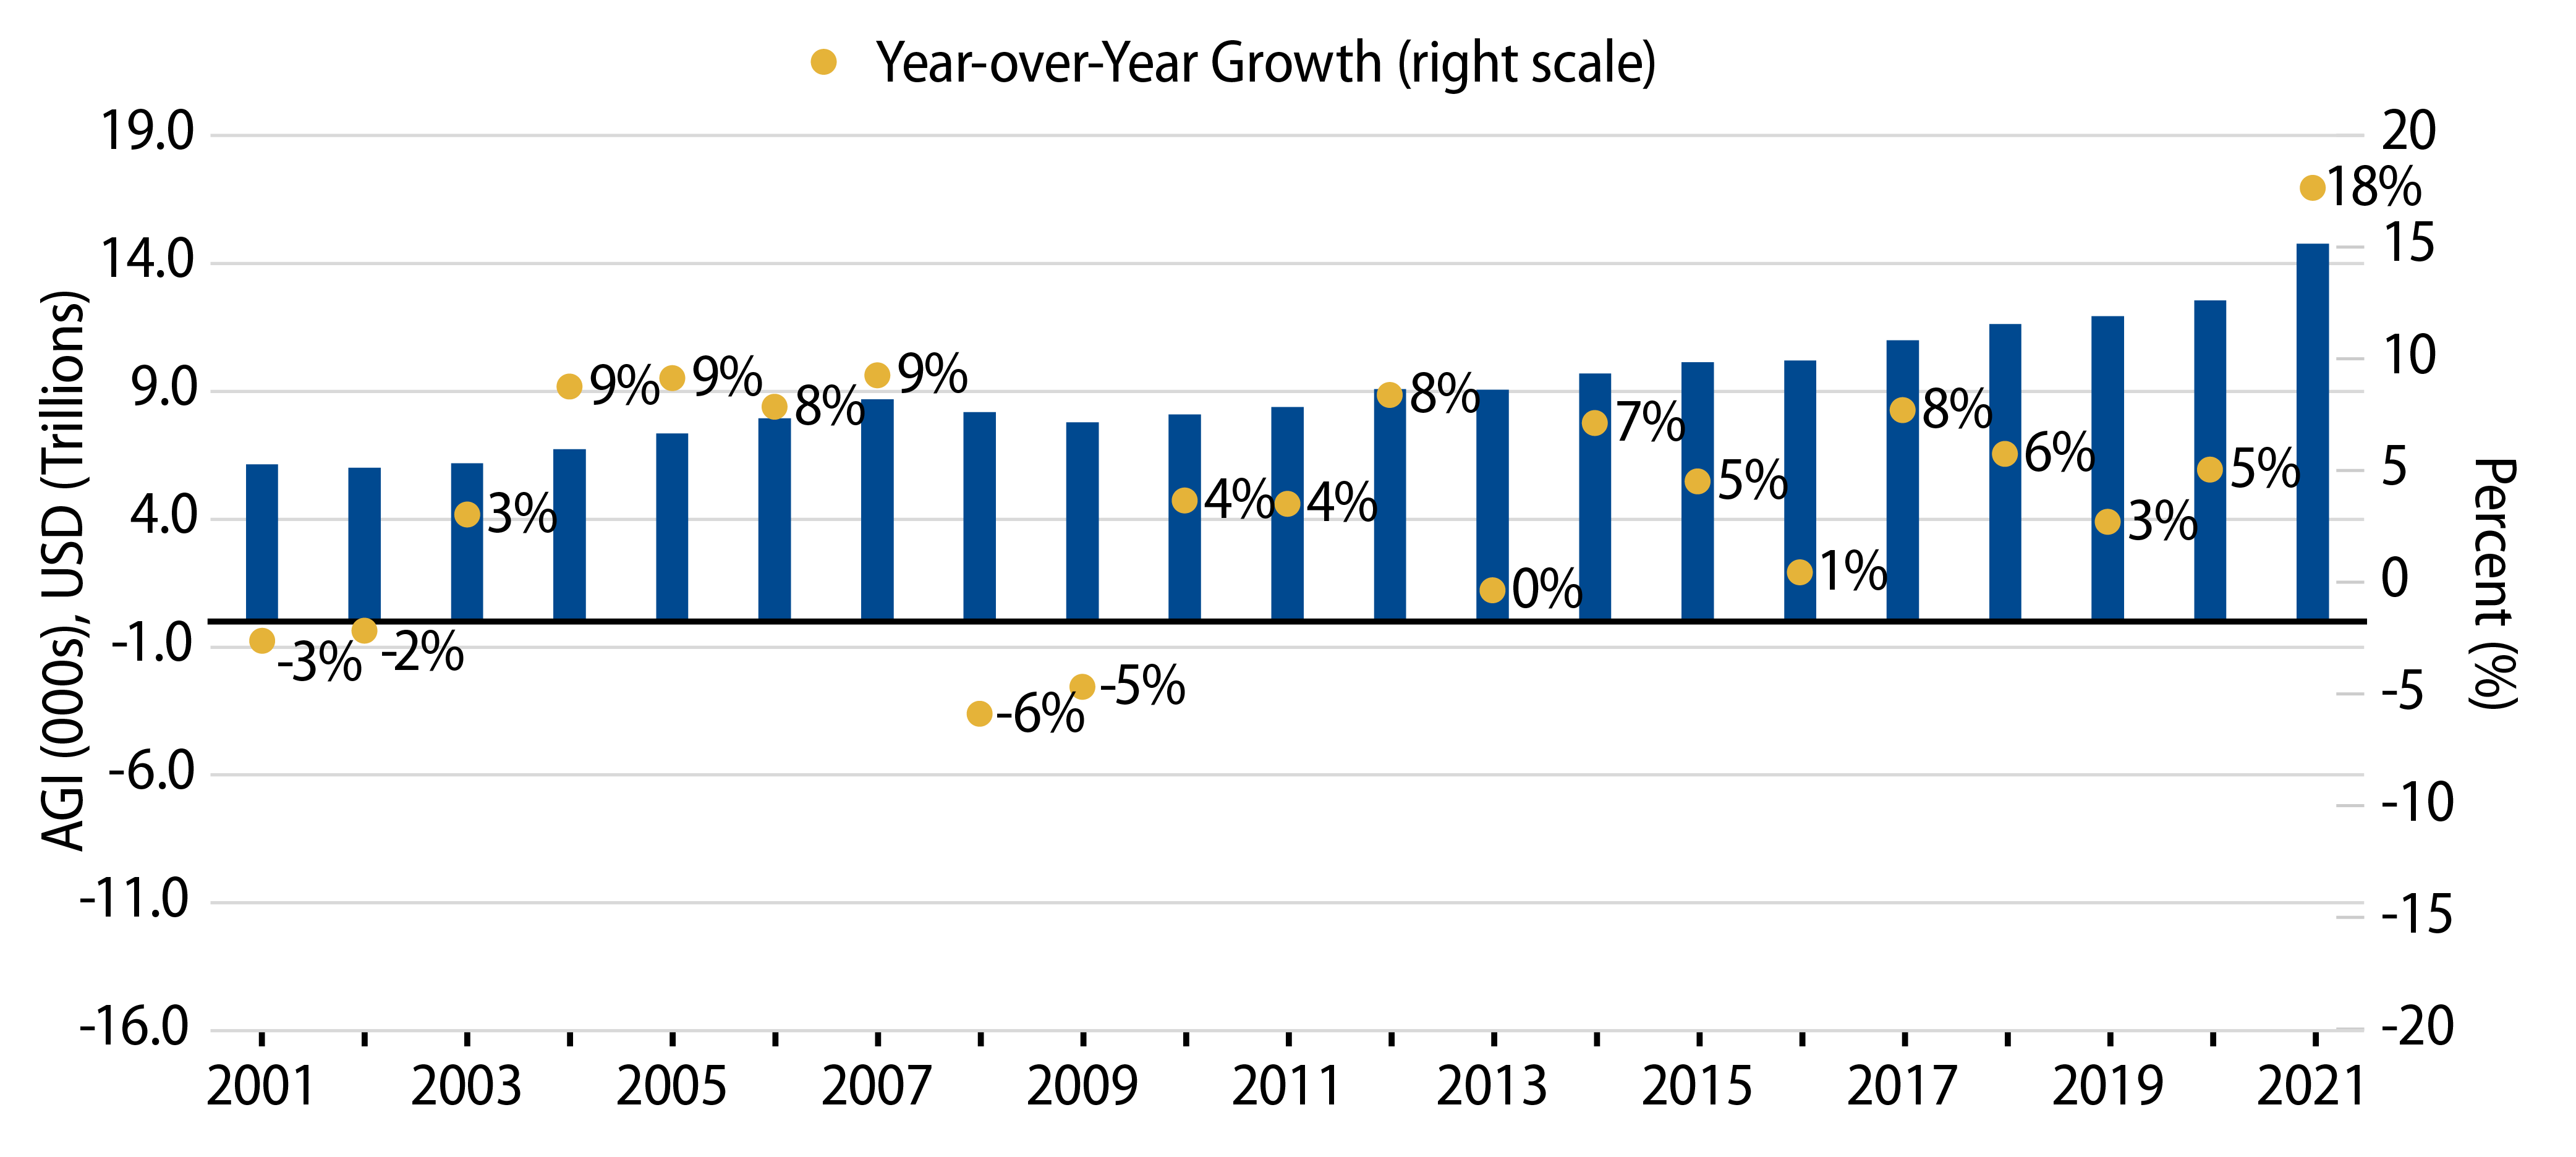
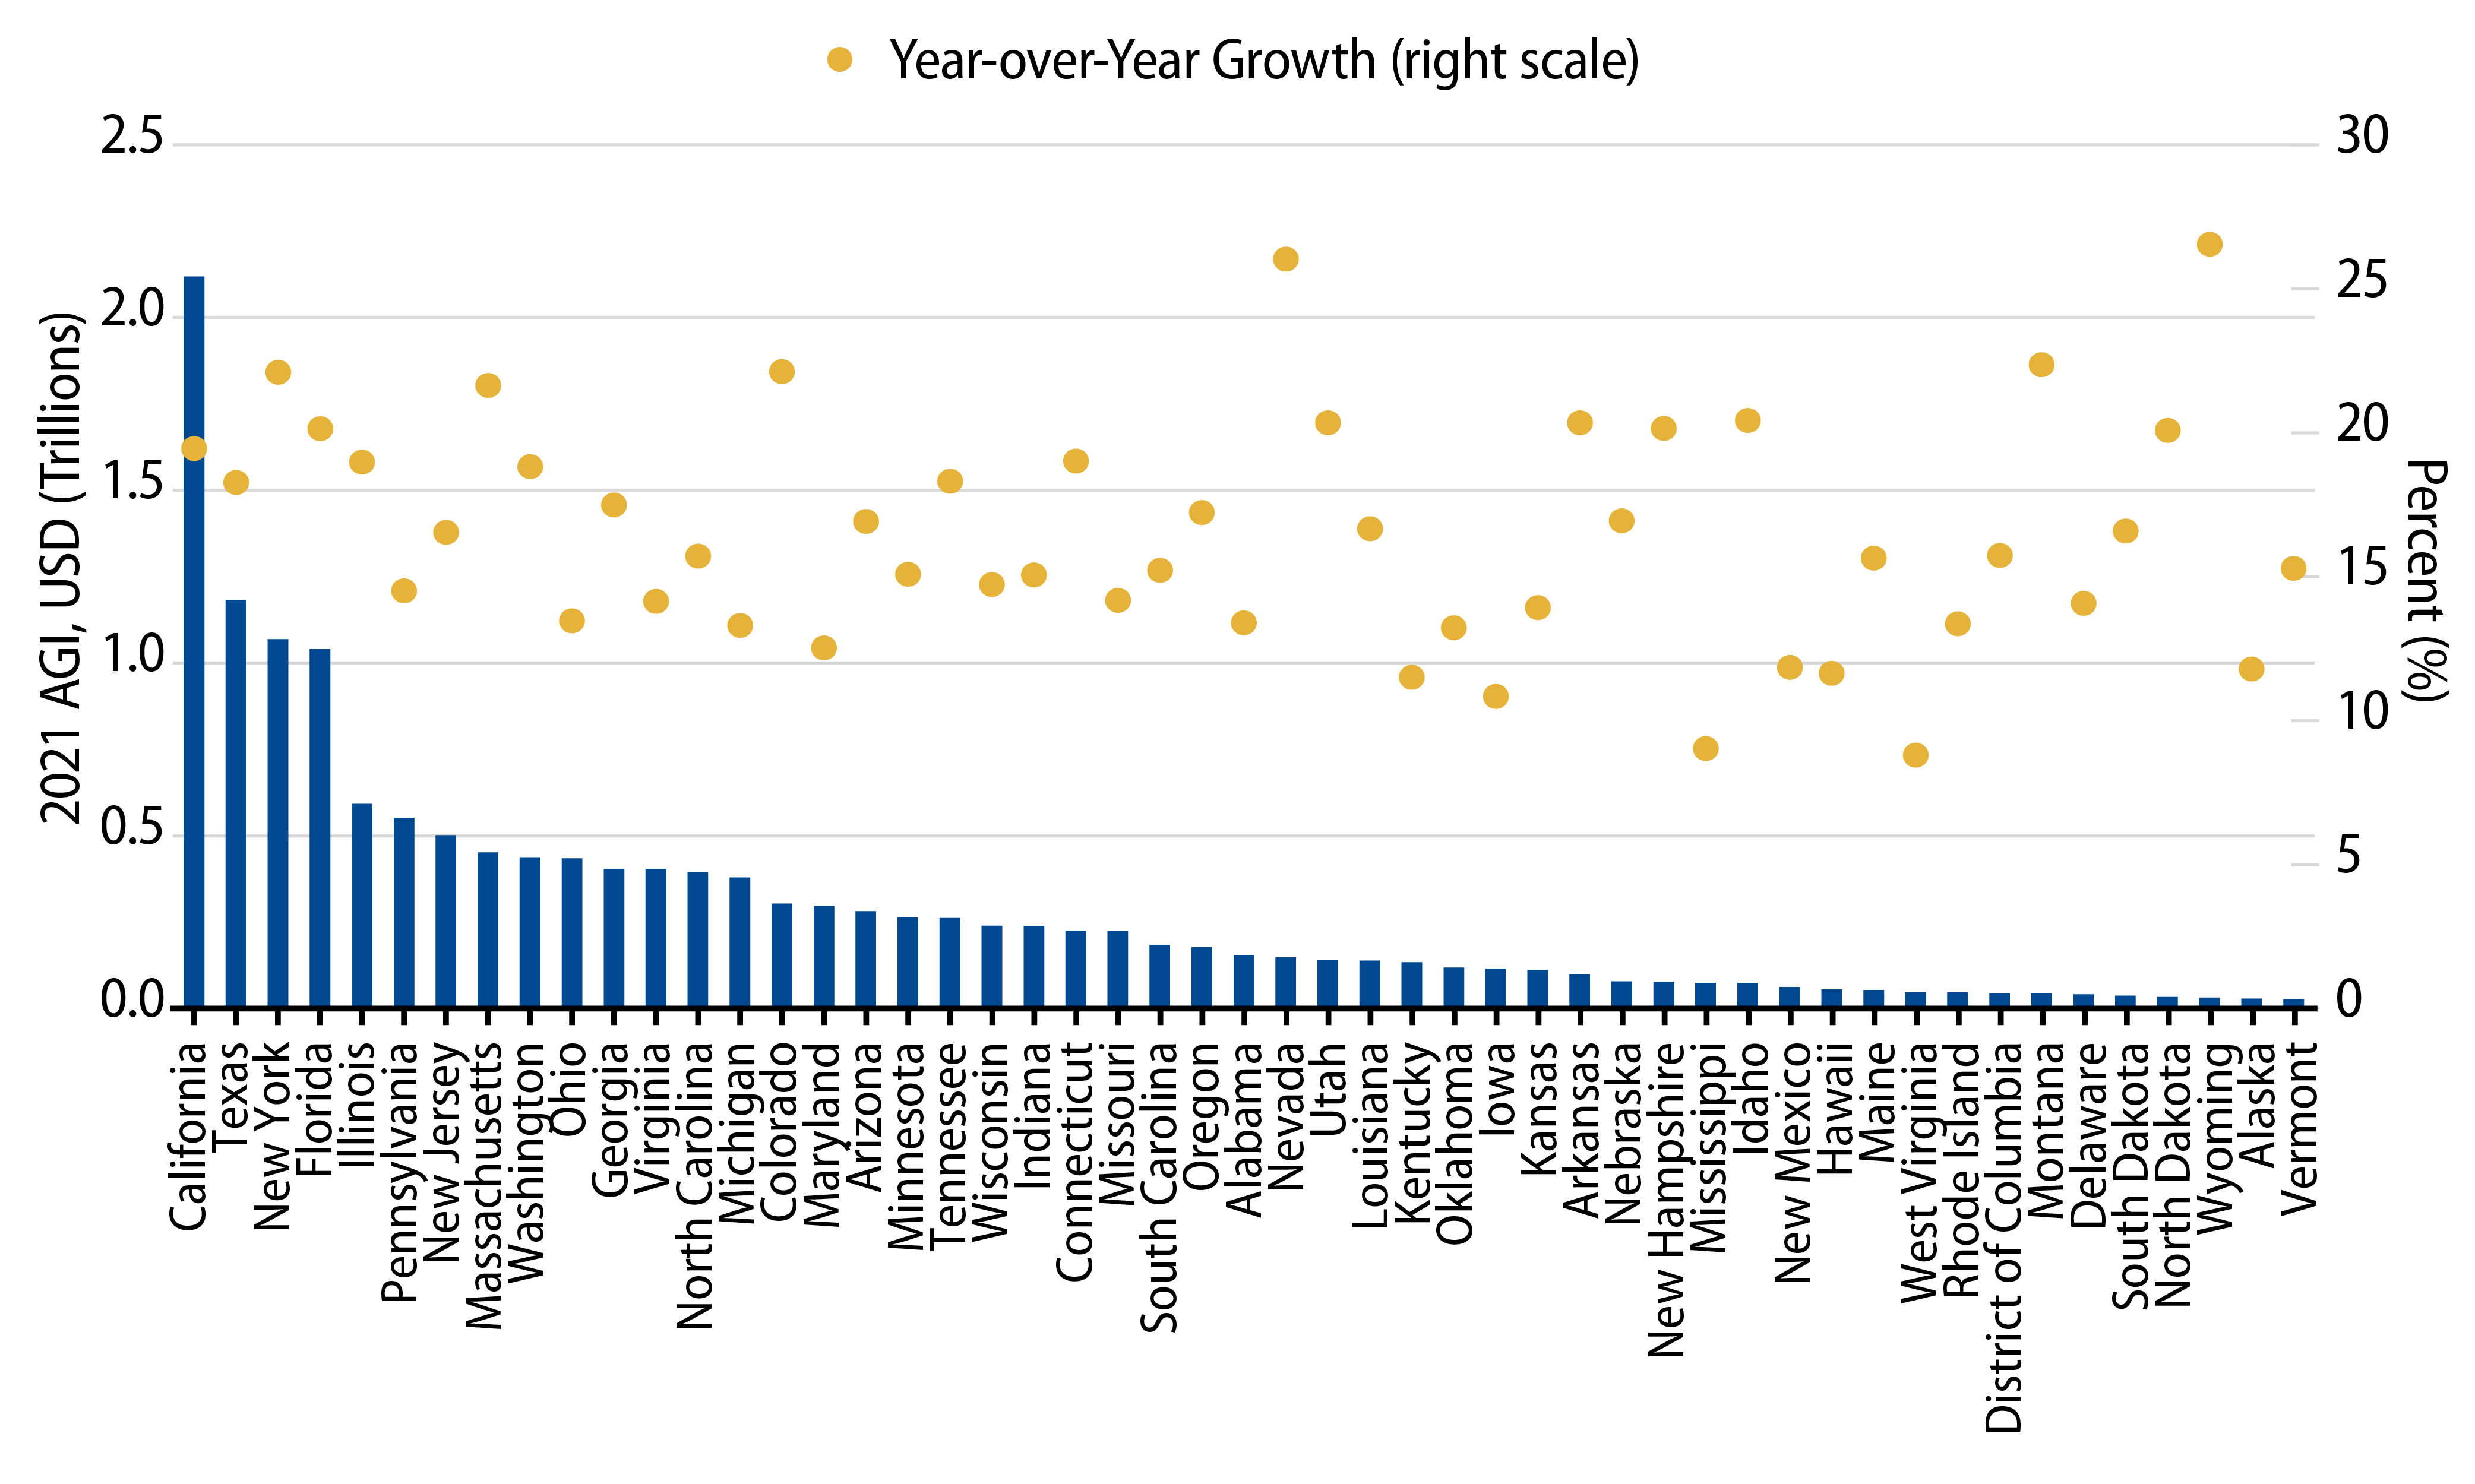
As economies continued to recover from the pandemic drawdowns and as the labor market strengthened, adjusted gross income (AGI) in the US increased $2.2 trillion in 2021 (or 17.7% YoY), marking the highest YoY increase in AGI over the past 20 years (Exhibit 1). AGI growth in 2021 was widespread across states, led by Wyoming (27%), Nevada (26%) and Montana (22%). New York, often maligned for domestic outmigration issues, recorded 22% growth in AGI, ranking fifth among states (Exhibit 2).
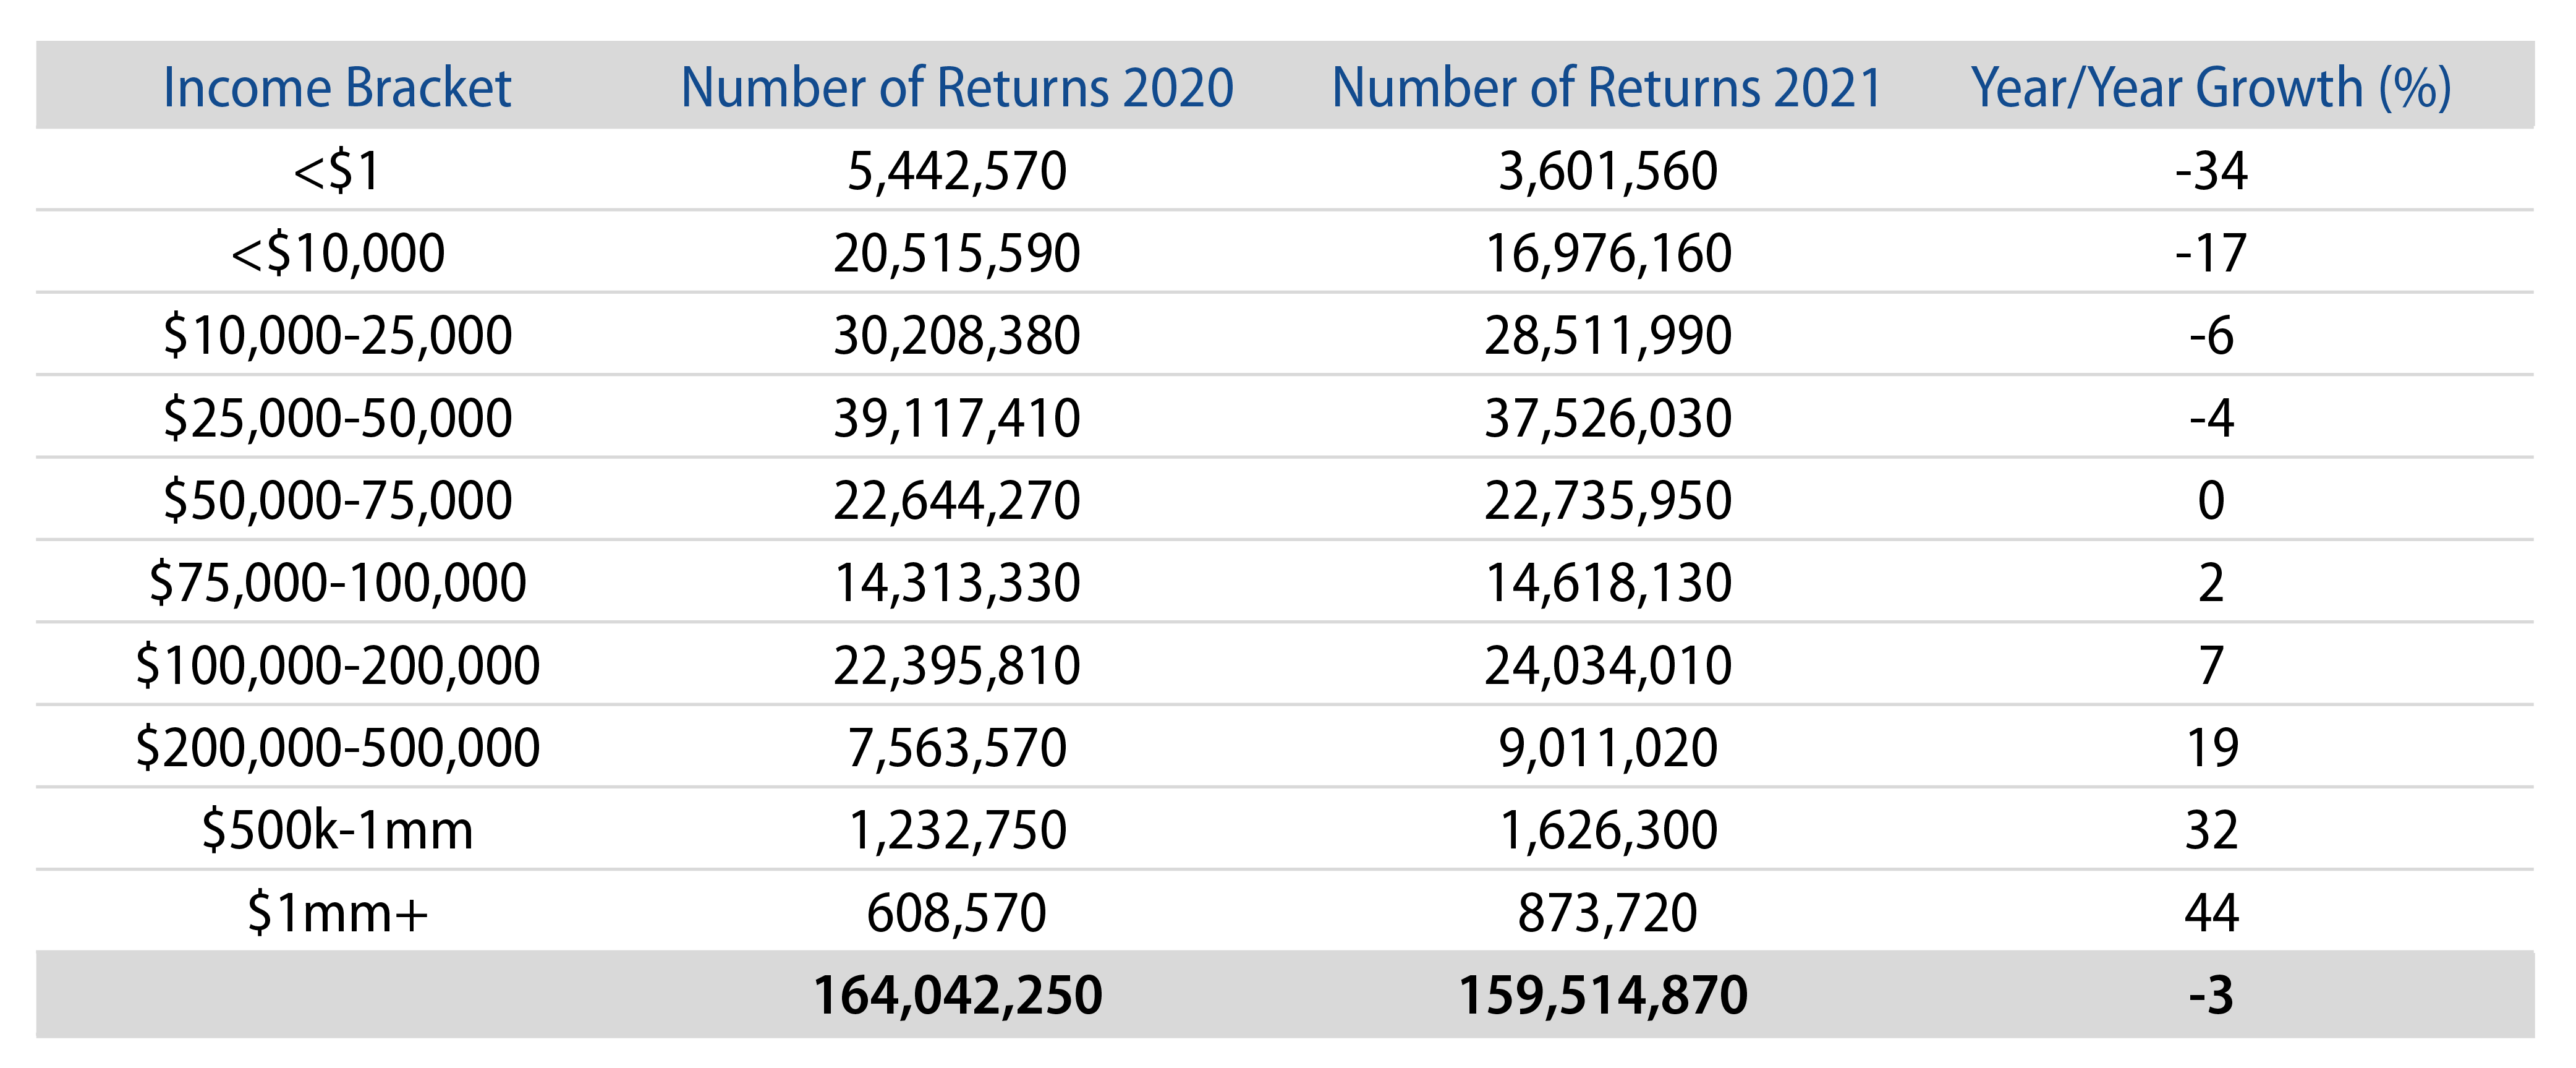
Improving overall wealth levels supported a decline of filers in the lowest marginal tax brackets and an increase in filers subject to higher tax rates. Filers with an annual AGI below $50,000 declined 4% to 34% across income cohorts. Meanwhile, filers with AGIs over $500,000, who benefit the most from the municipal tax exemption given relatively higher tax rates, increased 32% to 44%.
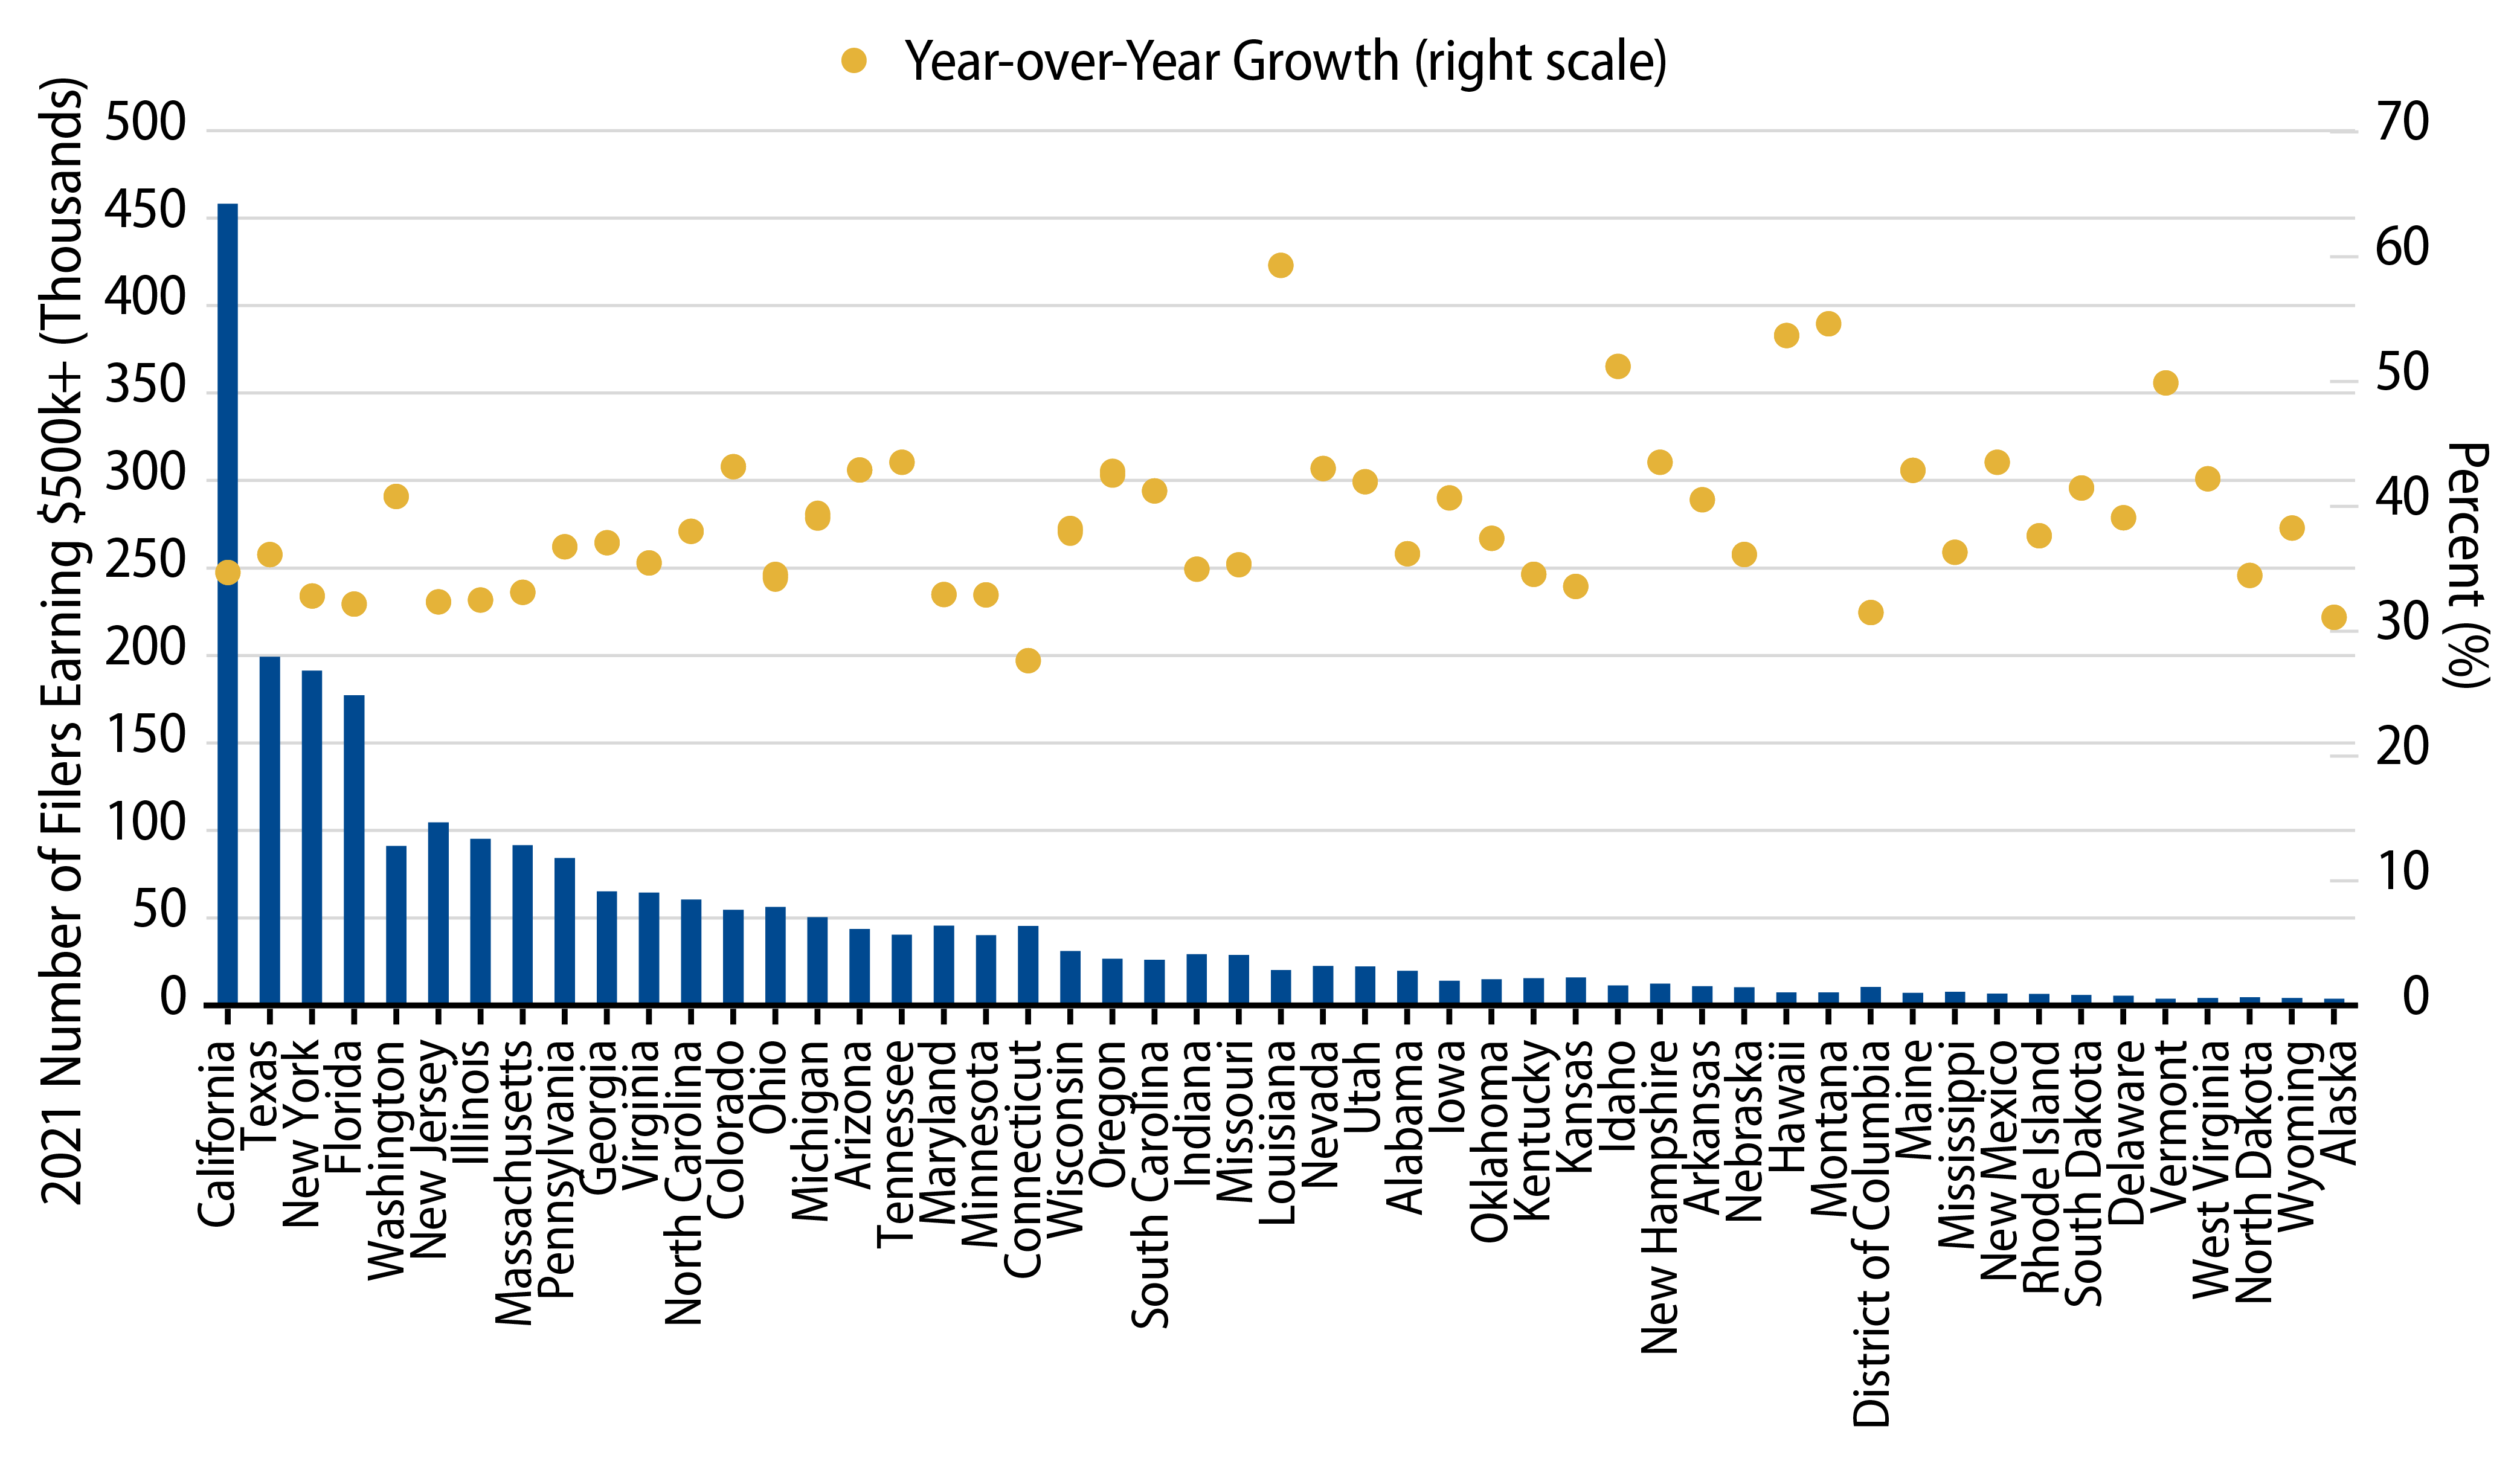
Growth of high-income earners was widespread, similar to national trends. Louisiana (+59% YoY), Montana (+55%) and Hawaii (+54%), recorded the highest YoY growth rates of high-income filers. Meanwhile, California (+117,000 filers), Texas (+53,000 filers), and New York (+47,000 filers), recorded the strongest growth by number of filers.
Domestic migration and population trends across states often contribute to headlines that point to credit concerns for municipalities. However, population changes only consider a single component of a municipal tax base that can support tax revenues and credit quality. Wealth levels are a key driver of taxing power for state and local governments, and this IRS release is an example of recent strength that has supported recent record high tax collections and favorable municipal credit quality. As income trends and tax rates both move higher for many, Western Asset believes that municipals will offer value for a greater number of individuals going forward.
Municipal Credit Curves and Relative Value
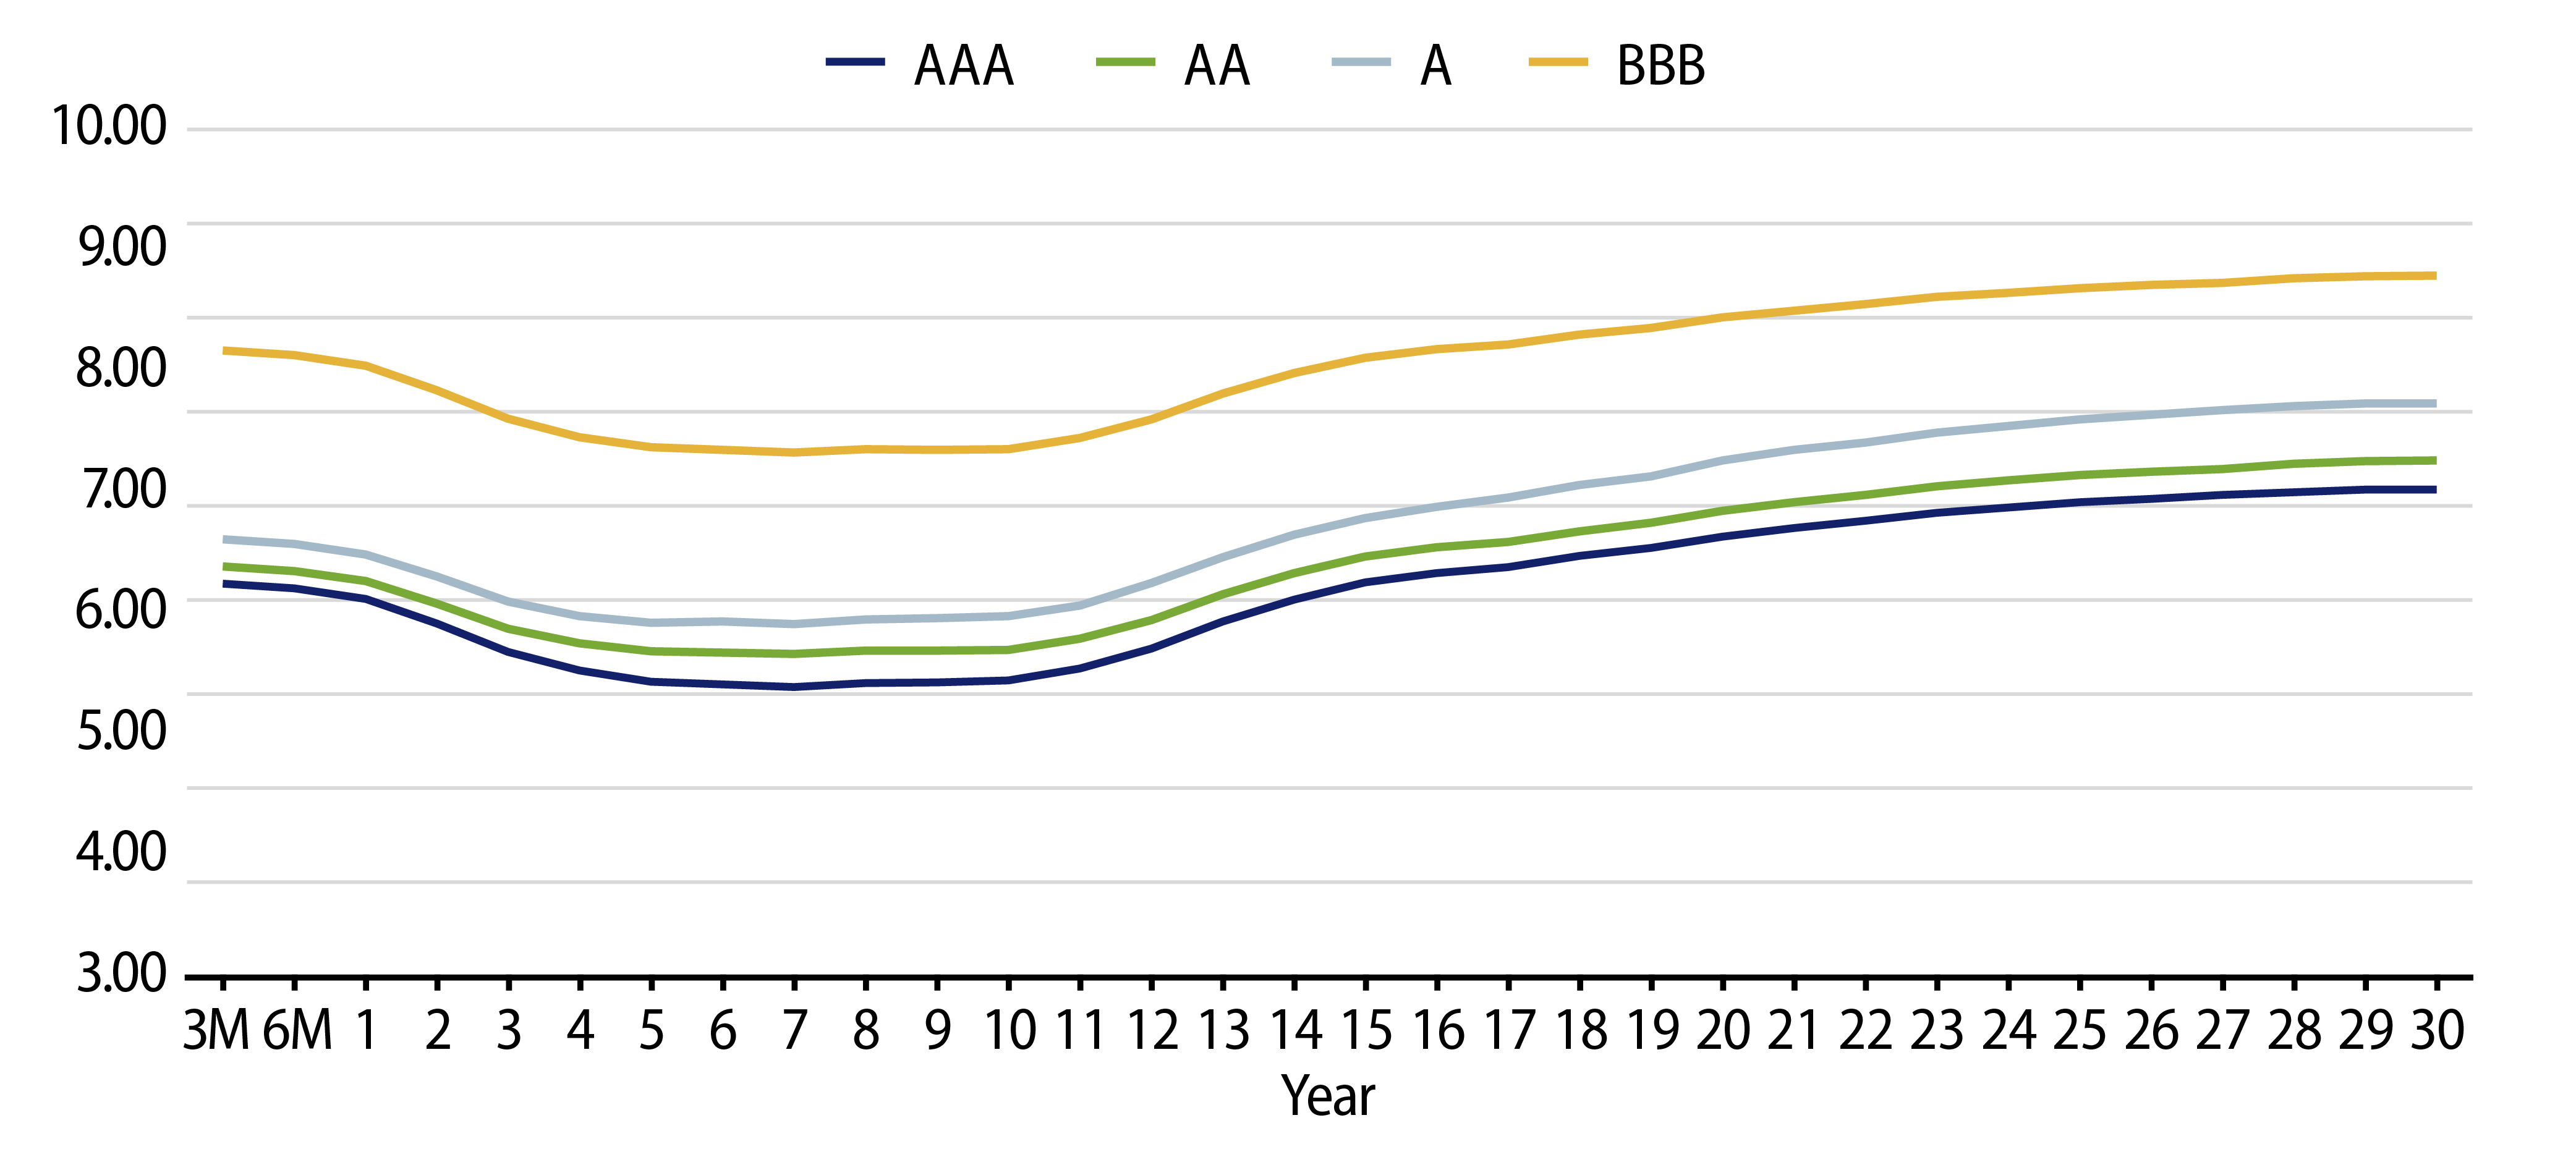
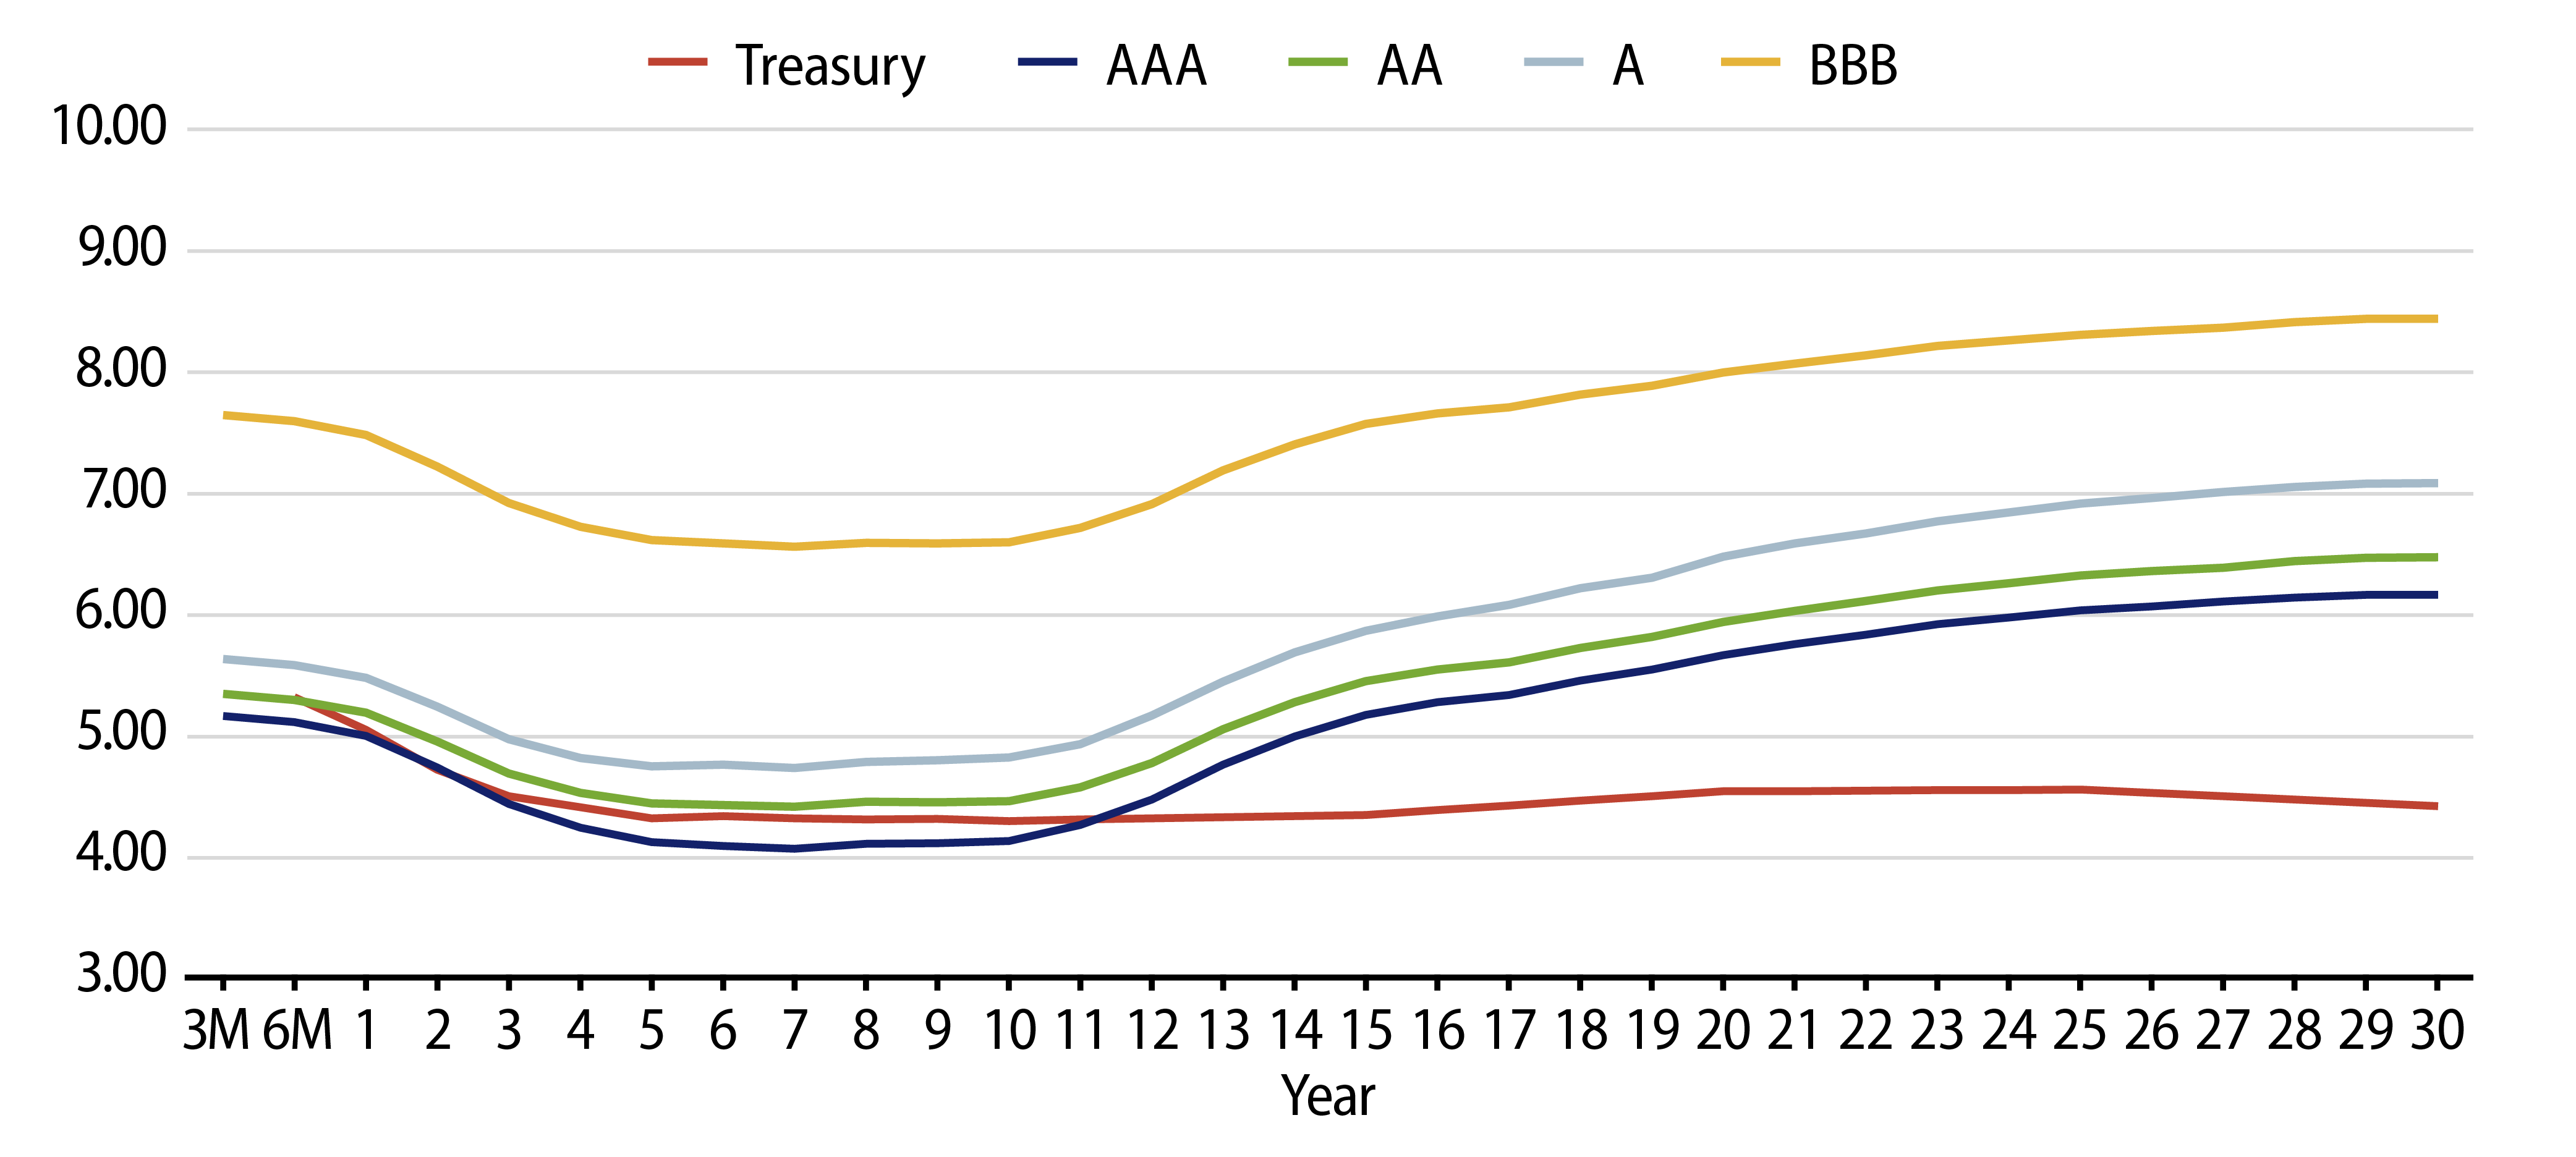
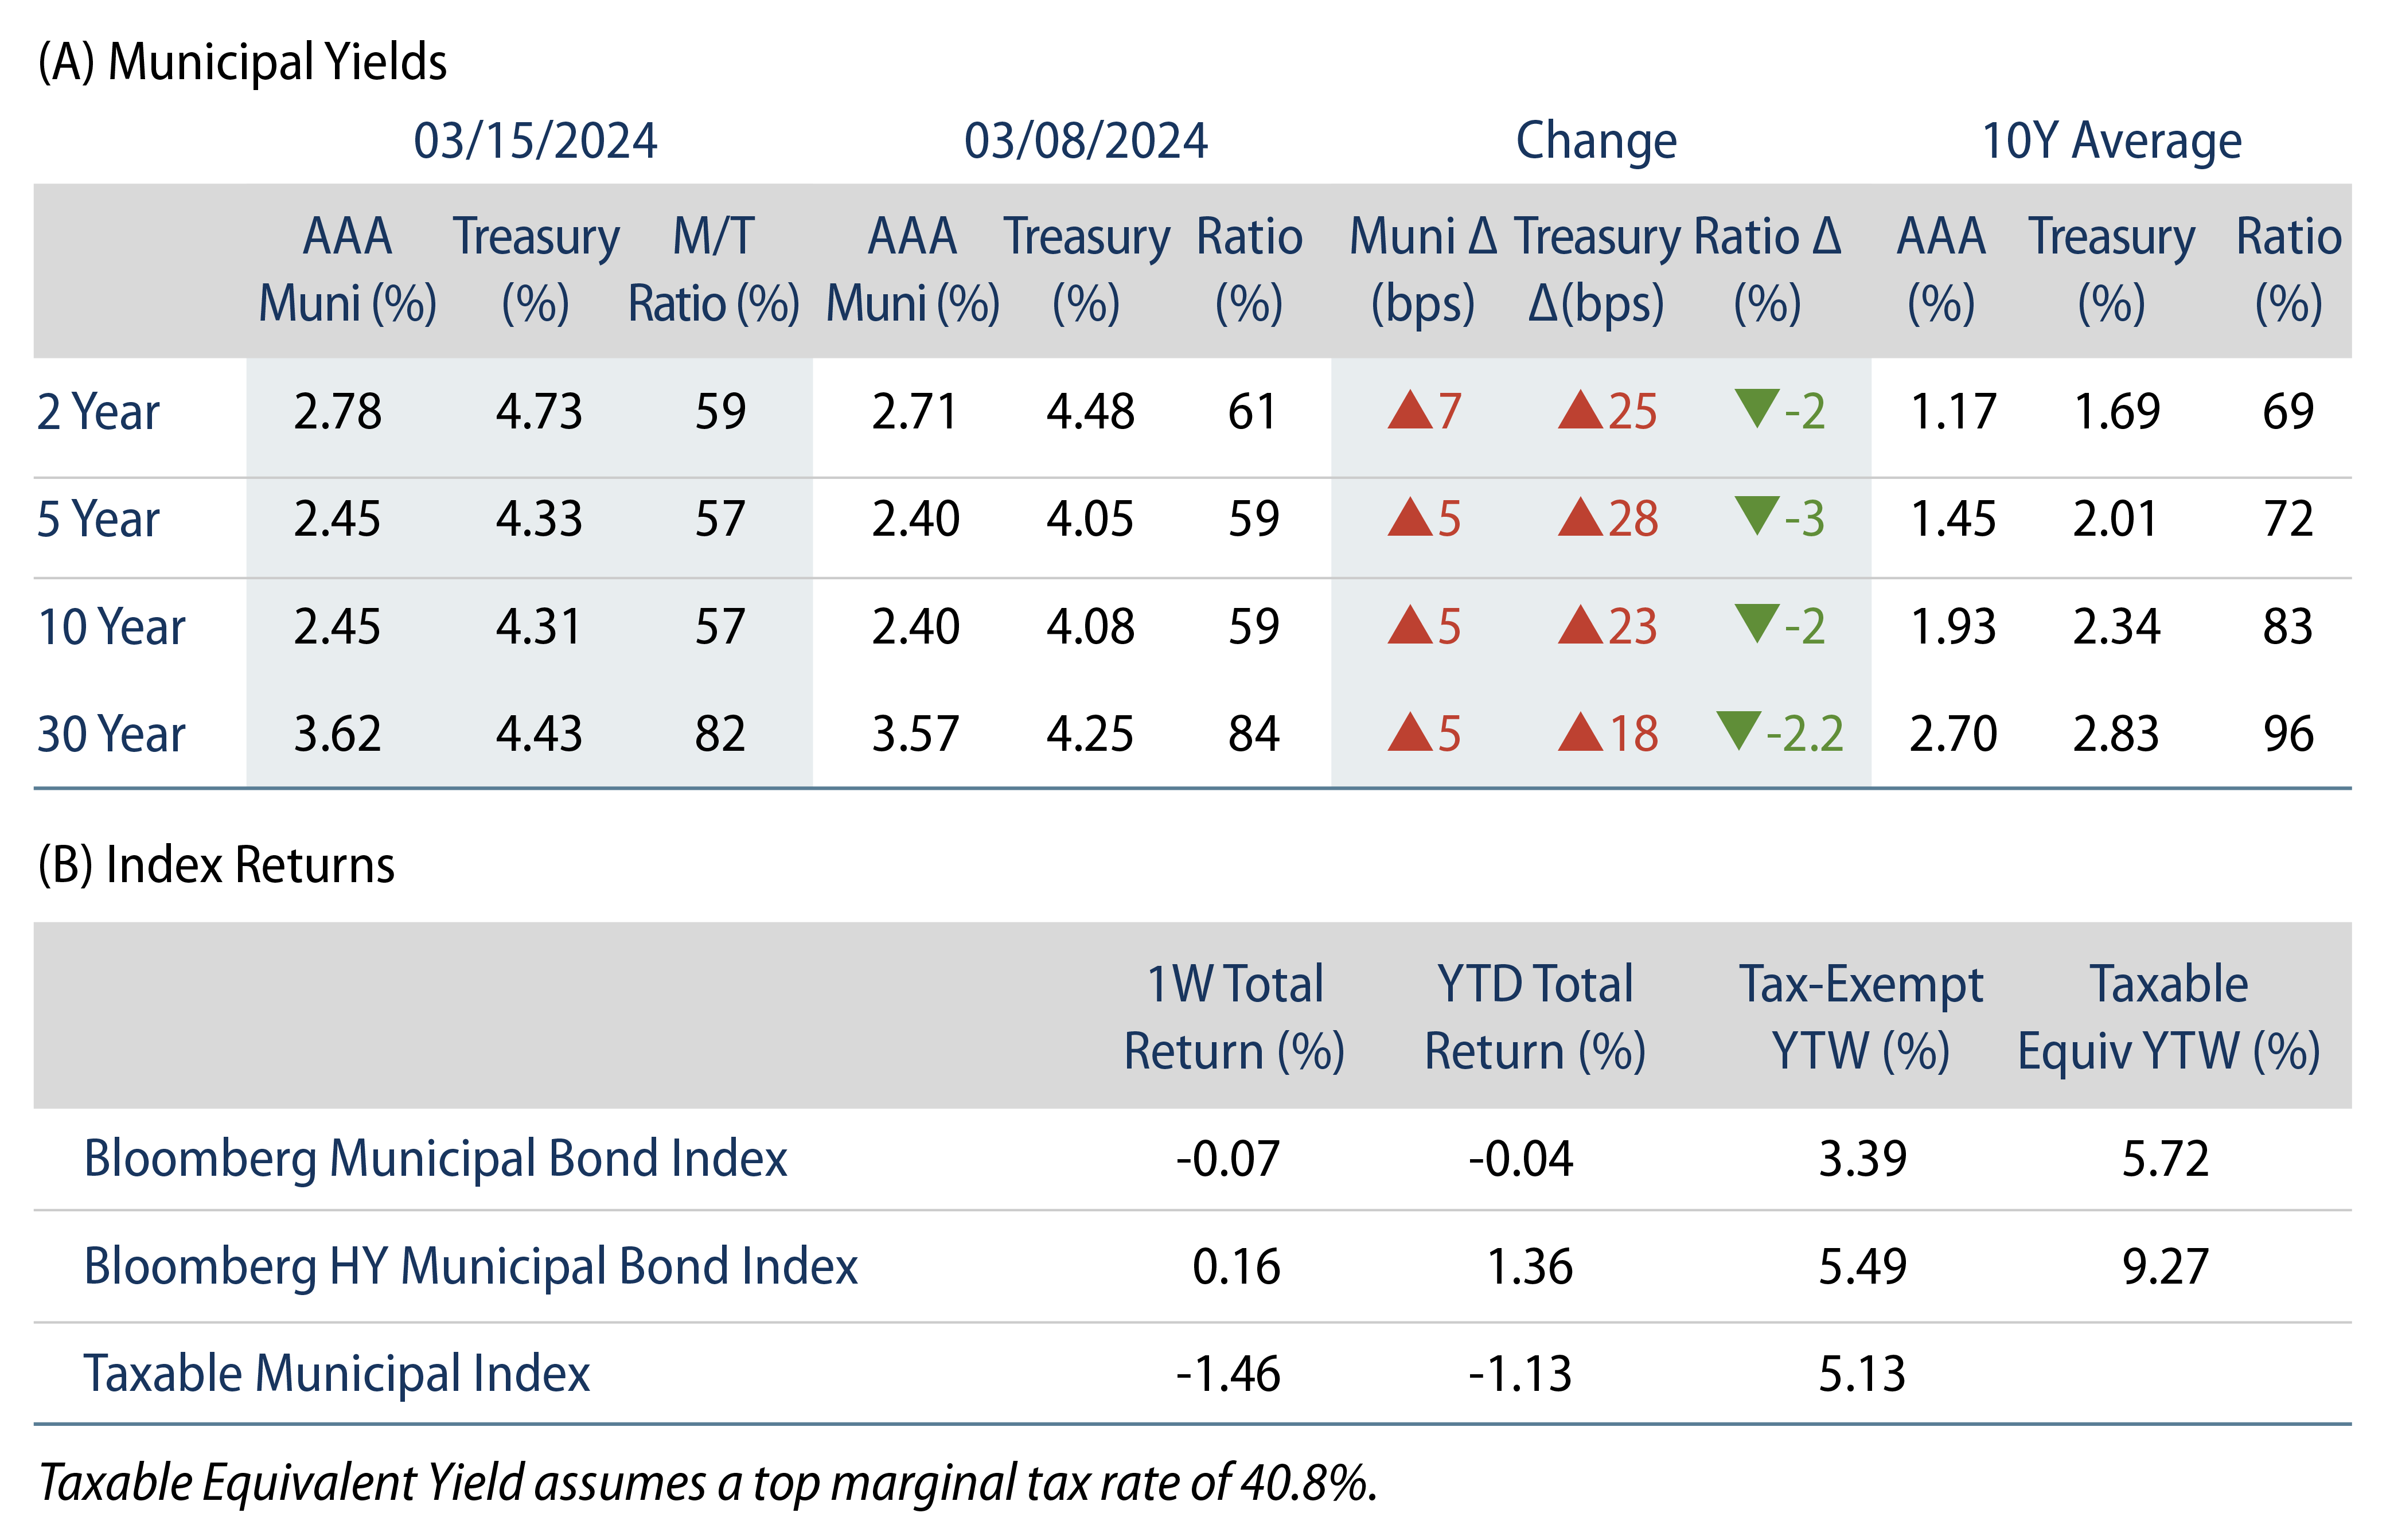

Theme #1: Municipal taxable-equivalent yields are above decade averages.

Theme #2: Recent yield-curve steepening has highlighted relative value in longer maturities.

Theme #3: Munis offer attractive after-tax yield pickup versus long Treasuries and corporate credit.


