マーケット・ブログ
MARKETS
17 January 2024

Weekly Municipal Monitor—What to Watch for in 2024

By Sam Weitzman

Municipals Posted Positive Returns Last Week

Munis posted positive returns last week, underperforming US Treasuries, which rallied despite hotter-than-expected Consumer Price Index (CPI) data. High-grade muni yields moved higher in short maturities, but were largely unchanged in intermediate maturities. Meanwhile, muni technicals improved as funds recorded inflows. The Bloomberg Municipal Index returned 0.05% during the week, the High Yield Muni Index returned 0.28% and the Taxable Muni Index returned 0.77%. This week we highlight key market themes we’re tracking for muni investors in 2024.

Market Technicals Improved as Muni Funds Recorded Inflows

Fund Flows: During the week ending January 10, weekly reporting municipal mutual funds recorded $39 million of net inflows, according to Lipper. Long-term funds recorded $367 million of outflows, high-yield funds recorded $346 million of inflows and intermediate funds recorded $237 million of inflows.

Supply: Last week’s total muni issuance reached $11 billion to begin the year, $10 billion of which was tax-exempt. This week’s calendar is expected to drop to $7 billion, which is still sizeable given the holiday-shortened week. The largest transactions include $532 million Scripps Health and $503 million Dallas Independent School District transactions.

This Week in Munis: What to Watch for in 2024

As we embark on a new calendar year, this week we highlight key muni market themes worth monitoring across municipal market supply and demand technicals, fundamentals and valuations.

Supply and Demand Technicals

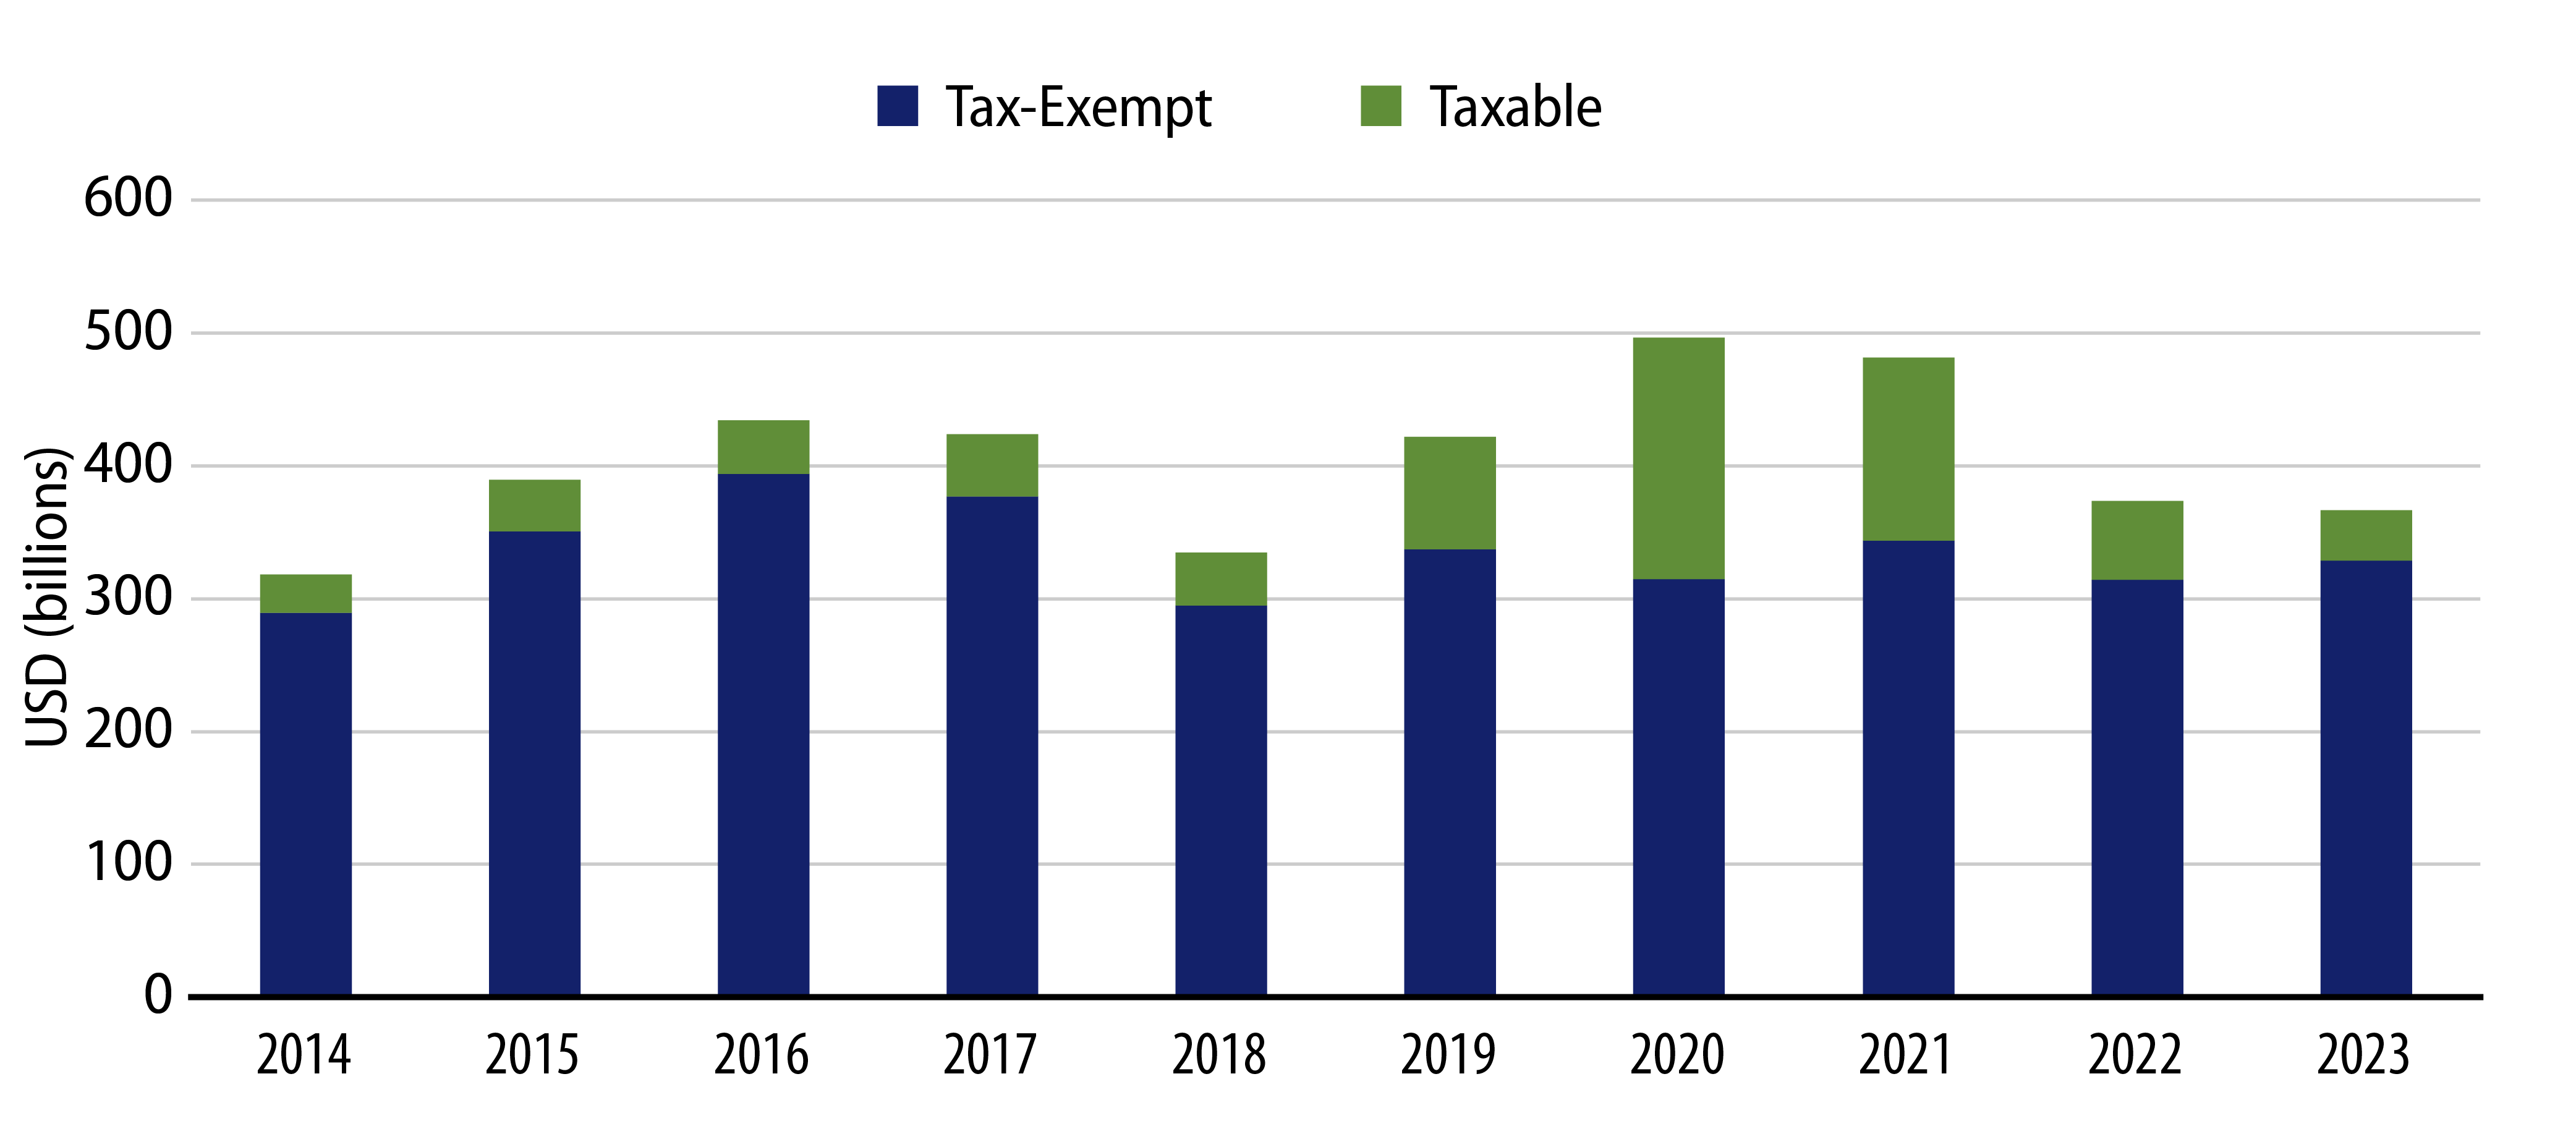
Supply: Will supply increase as issuers take advantage of lower rates to come off the sidelines?

In 2023 municipal supply levels declined 2% year-over-year (YoY) to $367 billion, with tax-exempt muni issuance up 5% YoY and taxable muni issuance down 36% YoY. Many market participants are forecasting a significant increase in new issuance in 2024, with expectations that issuers will be attracted by lower rates than observed in 2022 and 2023 to issue over $400 billion in 2024.

Since 2018, supply has trended lower due to the limited ability for municipalities to refinance debt, following the Tax Cuts and Jobs Act. Meanwhile, a still-elevated rate environment, along with the potential for major infrastructure initiatives to be delayed past the election year, could again lead supply to disappoint market participants to the downside. Lower supply levels would be supportive of market conditions, but also challenge the income opportunities offered, particularly if demand increases in 2024.

Exhibit 1: Annual Municipal Bond Supply
Annual Municipal Bond Supply
Source: Bloomberg, Western Asset. As of 31 Dec 23. Select the image to expand the view.

Demand: Following two consecutive years of outflows, will municipal mutual funds see an inflow cycle this year?

Since the Fed began its hiking cycle and municipal mutual funds recorded over $120 billion of net outflows since January 2022, municipals have competed with relatively high cash yields from CDs, money market funds and short-term Treasuries for the high-quality portion of asset allocations. Through December 2023, total money market fund assets reached $7 trillion, up $2.4 trillion from December 2019.

As economic conditions continue to tighten and move past post-pandemic volatility, and market pricing and the Fed suggest short-term rates and will move lower, we expect investors to look for solutions to lock up income for longer time horizons. As a result, we anticipate that high-quality municipals will offer increasing after-tax income opportunities versus if cash rates decline, and this could contribute to an inflow cycle.

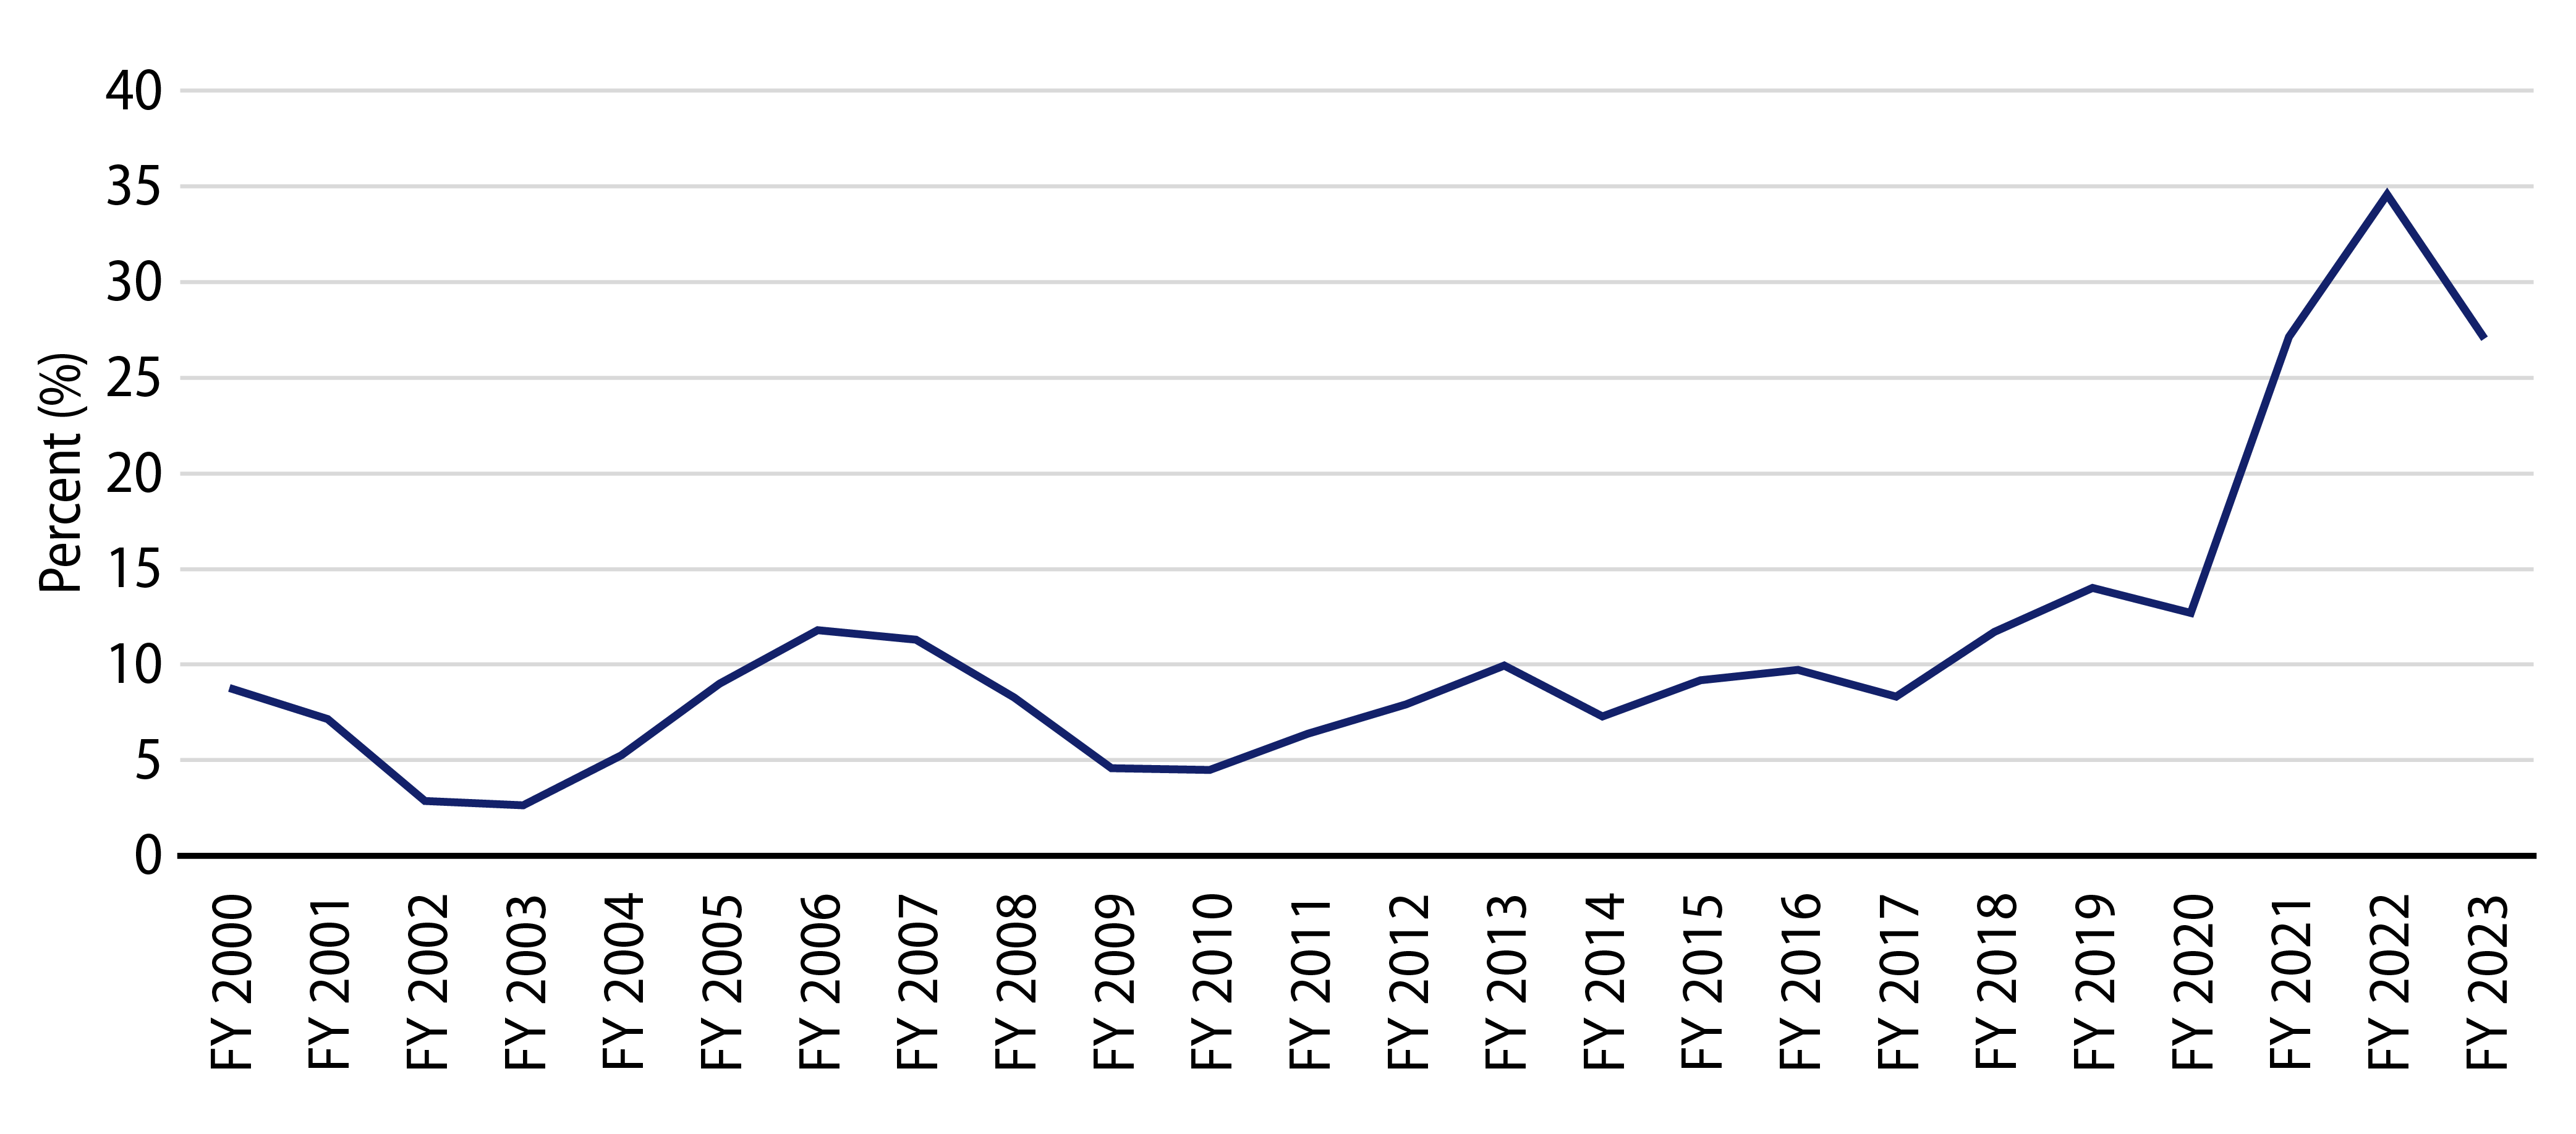
Fundamentals: Will strong muni credit fundamentals persist?

Quarterly state and local tax collections reached record levels at the end of 2022, supporting strong cash balances and upgrades that have outpaced downgrades for three consecutive years. While tax collections declined modestly through the first half of 2023, 12-month trailing collections remain just 2% off record highs, and cash balances remain elevated.

Considering tight monetary policy, slowing revenues and projected deficits, we expect the path of the muni credit cycle could slow but not break, and we anticipate downgrades could increase relative to recent years. We expect strong domestic labor and real estate markets to support tax collections throughout 2024, and that state cash balances will remain well above levels observed prior to the global financial crisis, which would be supportive of muni credit in an unexpected downturn.

Exhibit 2: State Reserve Balances Remain Near Record Levels—State Reserves as a % of General Fund Expenditures
State Reserve Balances Remain Near Record Levels—State Reserves as a % of General Fund Expenditures
Source: PEW. As of 30 Jun 23. Select the image to expand the view.

Valuations: Is it too late to get in following a strong end-of-year rally?

The Bloomberg Muni Bond Index yield-to-worst peaked at 4.50% in October, ahead of the index’s 8.3% total return observed in November and December which led the index yield lower to 3.22% by year-end 2023, pricing in Fed easing expectations in 2024. Moreover, highest quality AAA Muni/Treasury ratios within 10 years retraced near all-time low levels following the rally.

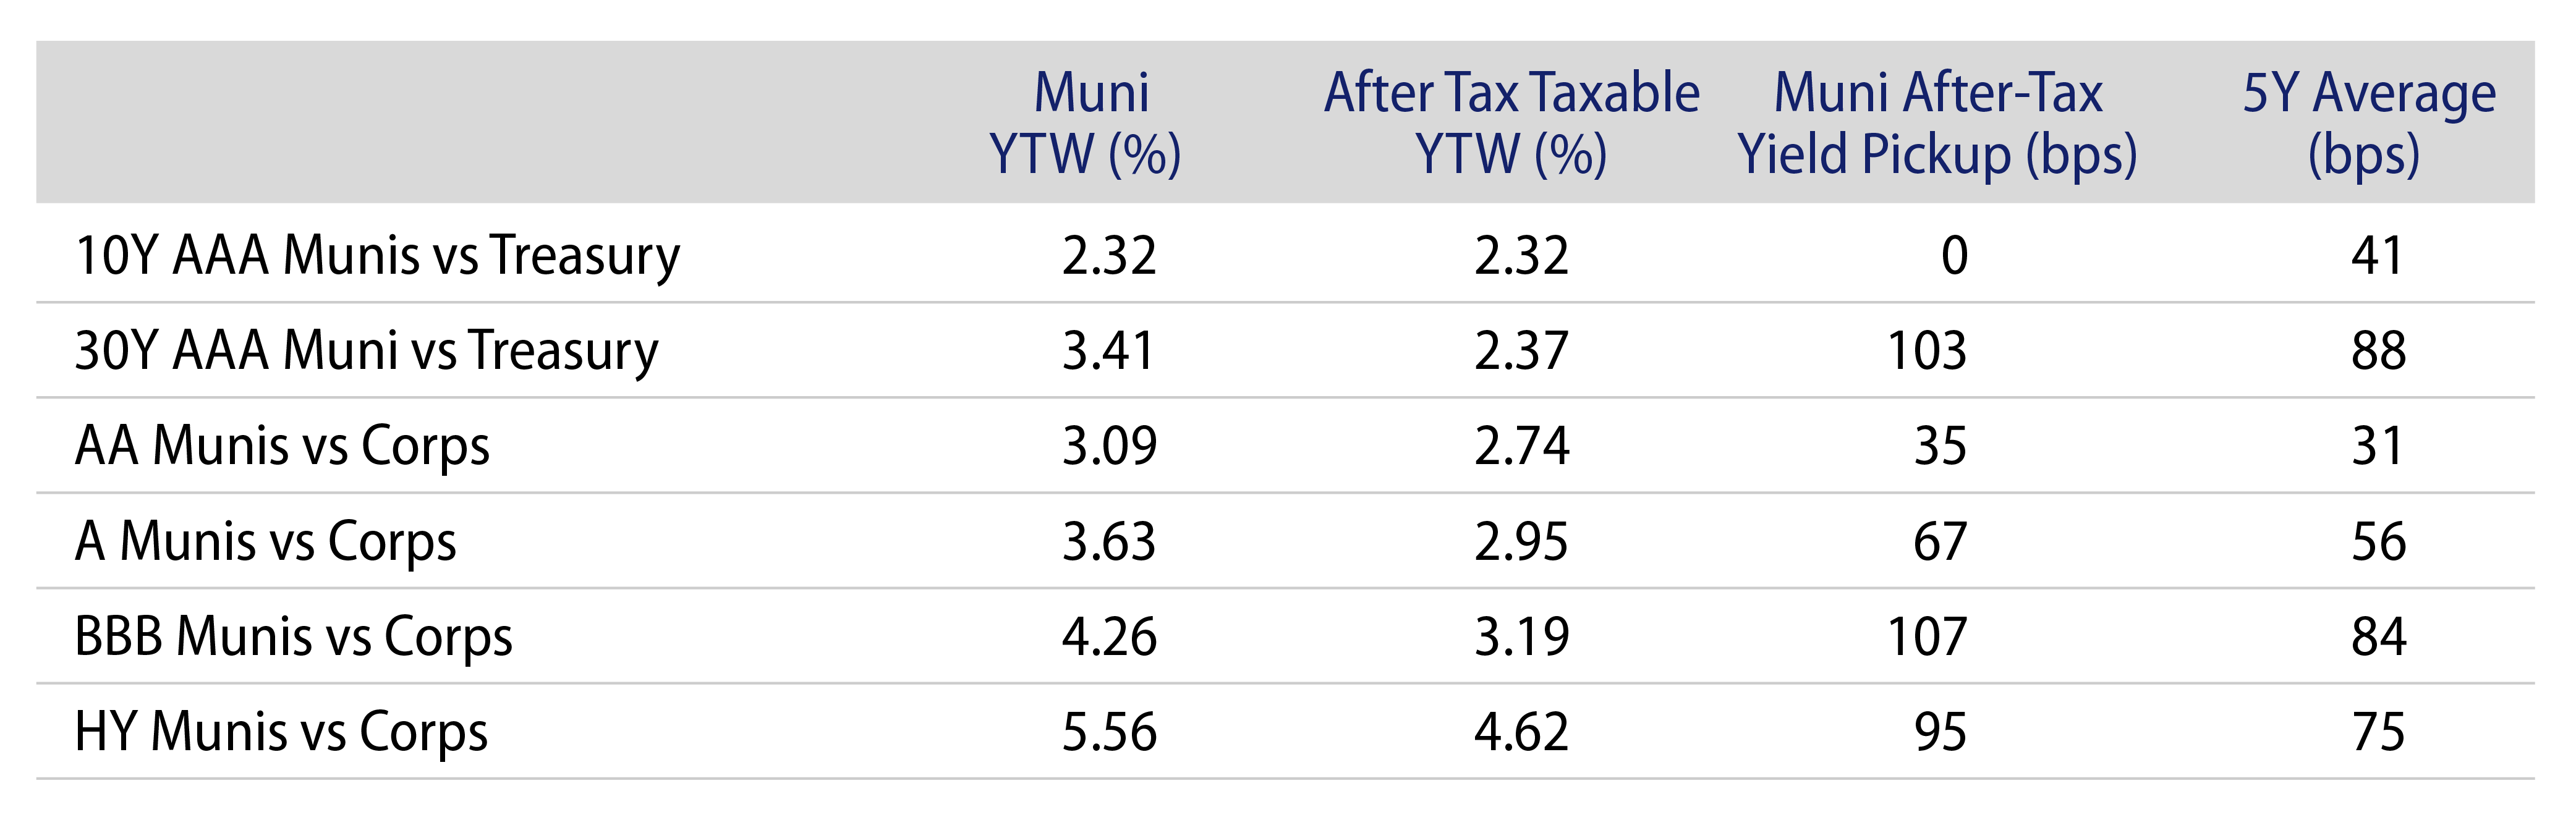
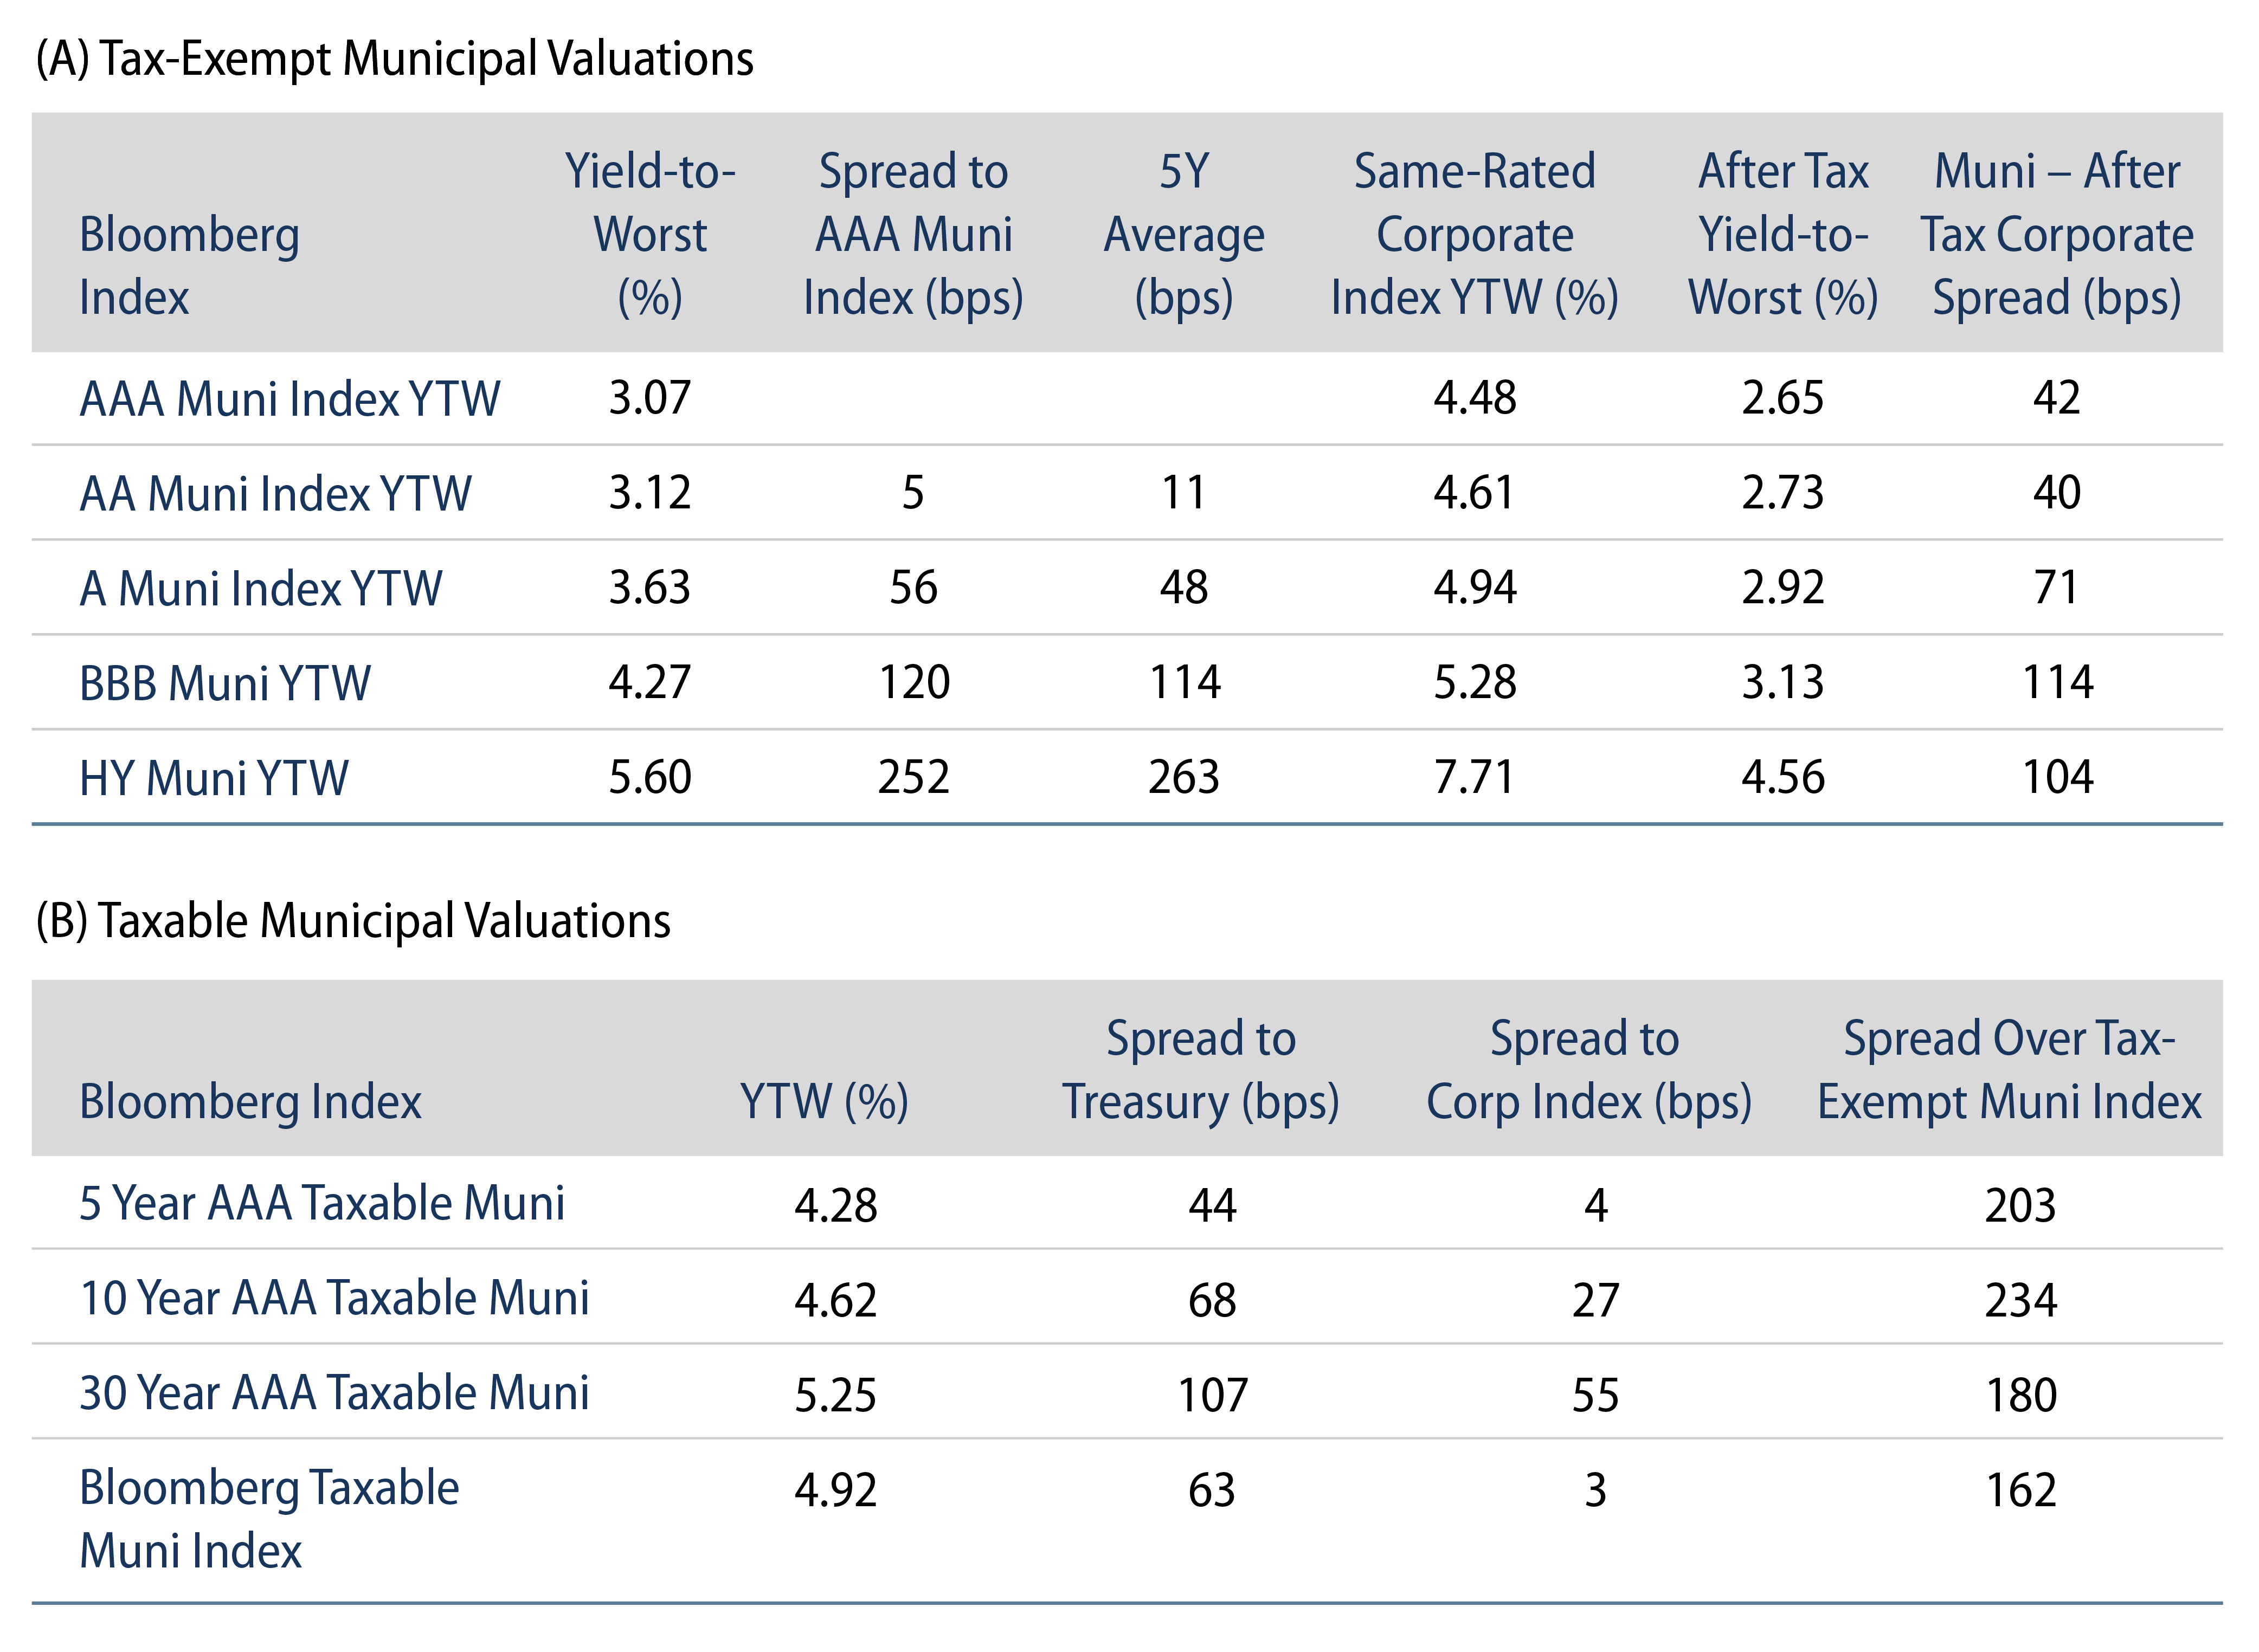
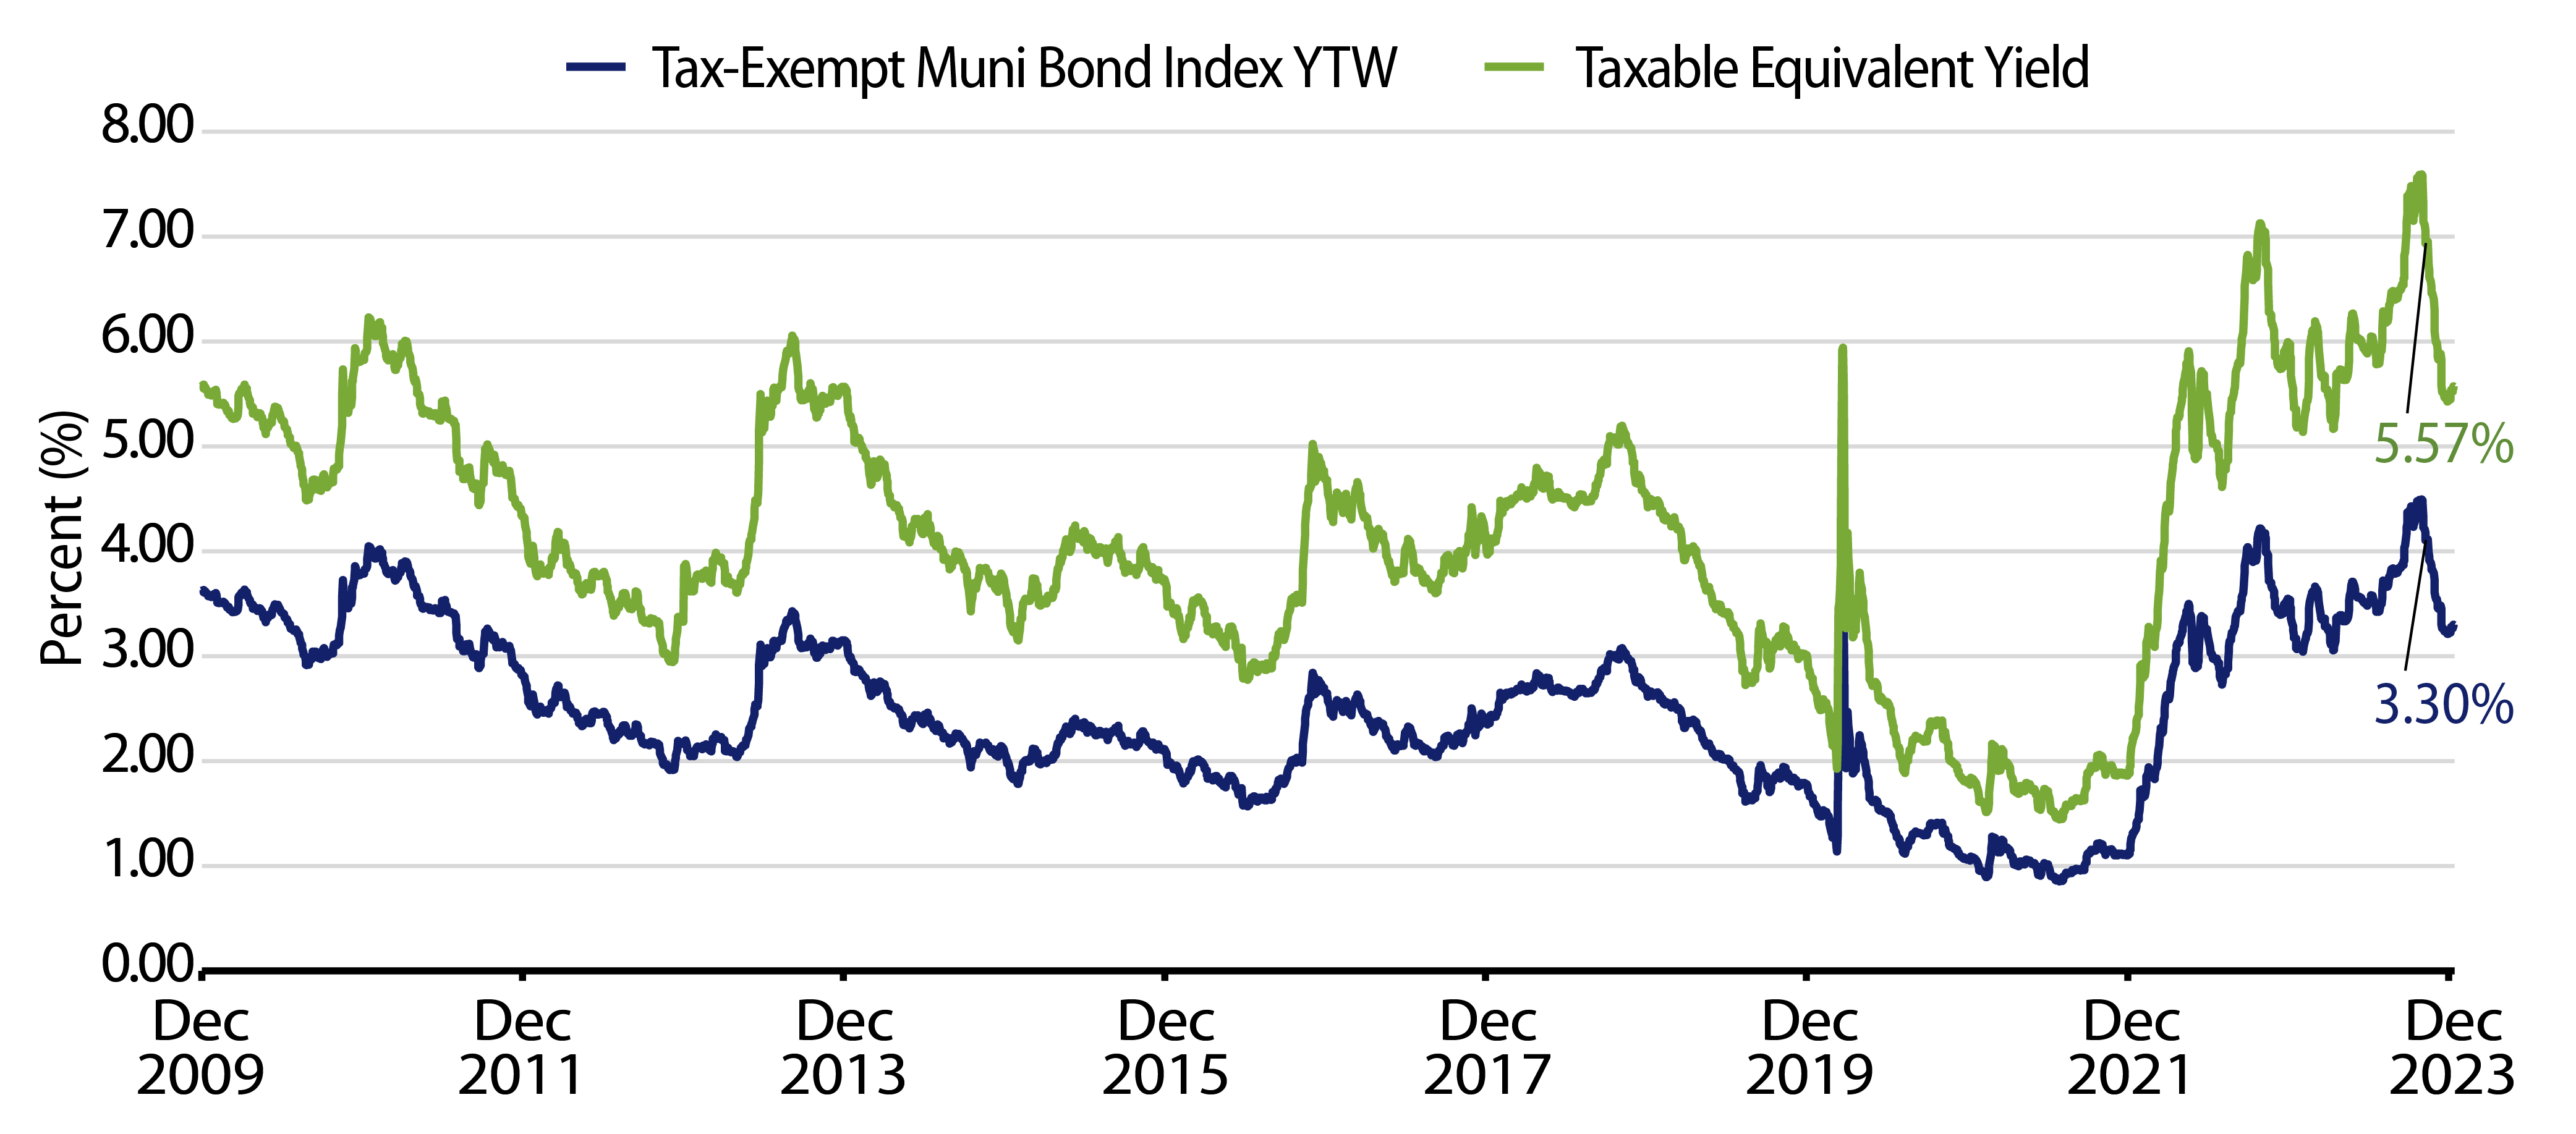
As of last week, the Bloomberg Muni Bond Index yield-to-worst of 3.30% (5.57% for taxable-equivalent) remains near the decade highs, and offers attractive after-tax yield pick-up versus other investment-grade credit counterparts. This tax-exempt carry can contribute to attractive long-term after-tax total return potential and we view the current entry point as favorable for long-term investors, considering the prospects of limited supply, higher demand and resilient credit fundamentals that could lead future income opportunities lower.

Exhibit 3: Average Muni Yield by Calendar Year
Average Muni Yield by Calendar Year
Source: Bloomberg Muni Bond Index. As of 12 Jan 24. Select the image to expand the view.
Exhibit 4: Tax-Exempt Muni Credit Curves
Tax-Exempt Muni Credit Curves
Source: Bloomberg, Western Asset. As of 12 Jan 24. Bloomberg BVAL Municipal Credit Indices (AAA, AA, A, BBB, respectively) and US Sovereign Curves. Taxable-Equivalent Muni Credit Curves consider the top marginal effective tax rate of 40.8%. Select the image to expand the view.
Exhibit 5: Taxable-Equivalent Muni Credit Curves
Taxable-Equivalent Muni Credit Curves
Source: Bloomberg, Western Asset. As of 12 Jan 24. Bloomberg BVAL Municipal Credit Indices (AAA, AA, A, BBB, respectively) and US Sovereign Curves. Taxable-Equivalent Muni Credit Curves consider the top marginal effective tax rate of 40.8%. Select the image to expand the view.
Exhibit 6: Municipal Bond Yields and Index Returns
Municipal Bond Yields and Index Returns
Source: Bloomberg. As of 12 Jan 24. Past performance is not a guarantee of future results. It is not possible to invest directly in an Index. Select the image to expand the view.
Exhibit 7: Tax-Exempt and Taxable Muni Valuations
Tax-Exempt and Taxable Muni Valuations
Source: Bloomberg. As of 12 Jan 24. Select the image to expand the view.

Western Asset Key Themes for Muni Investors

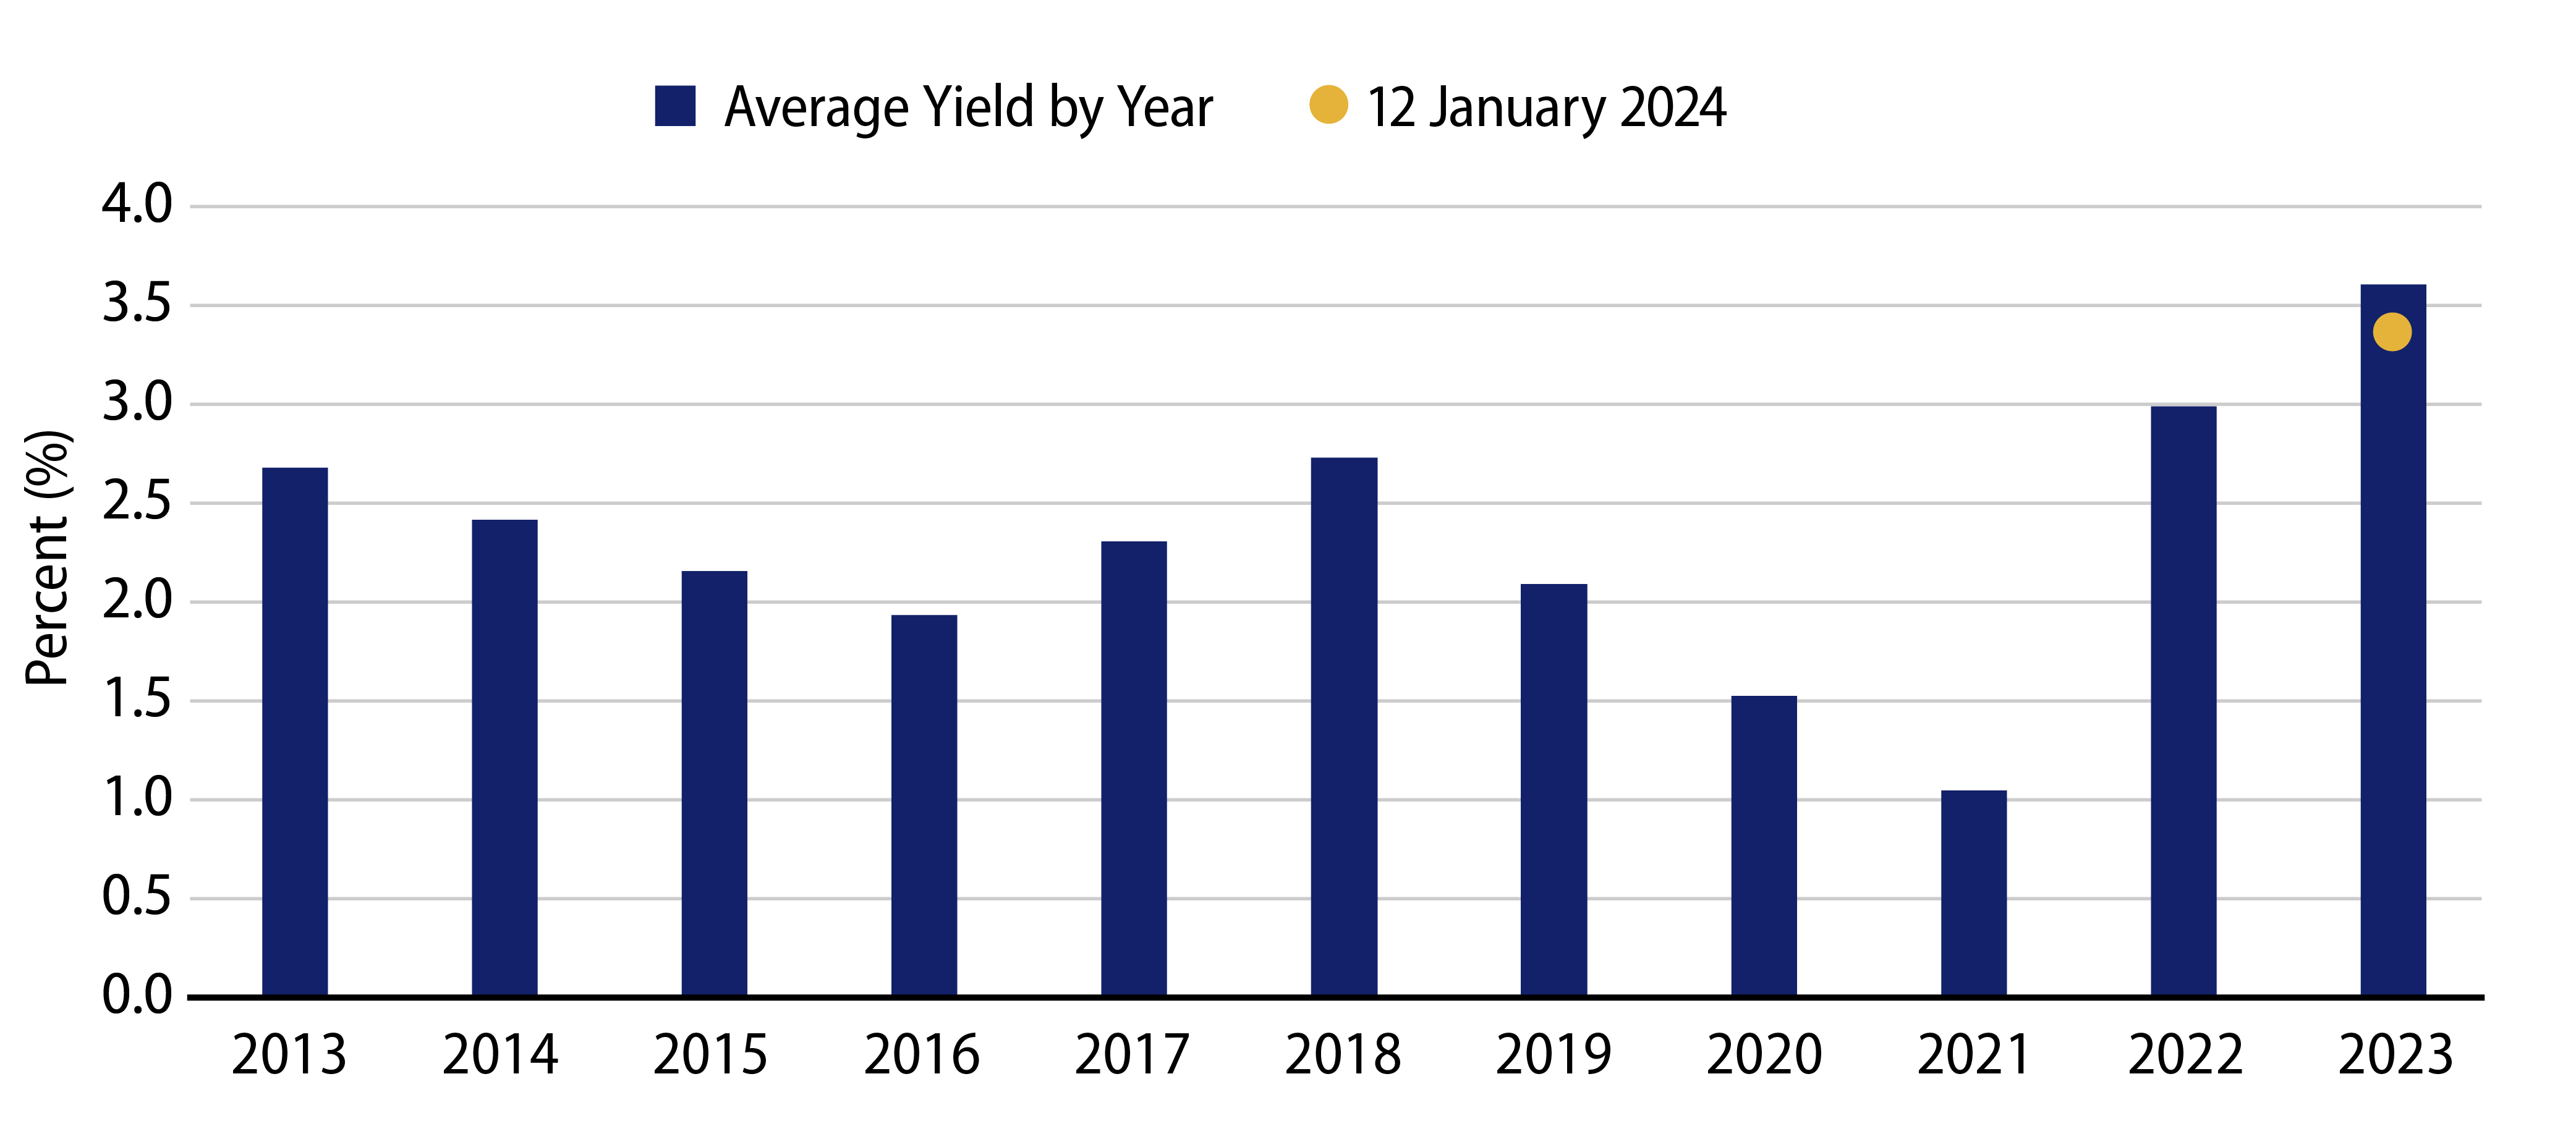
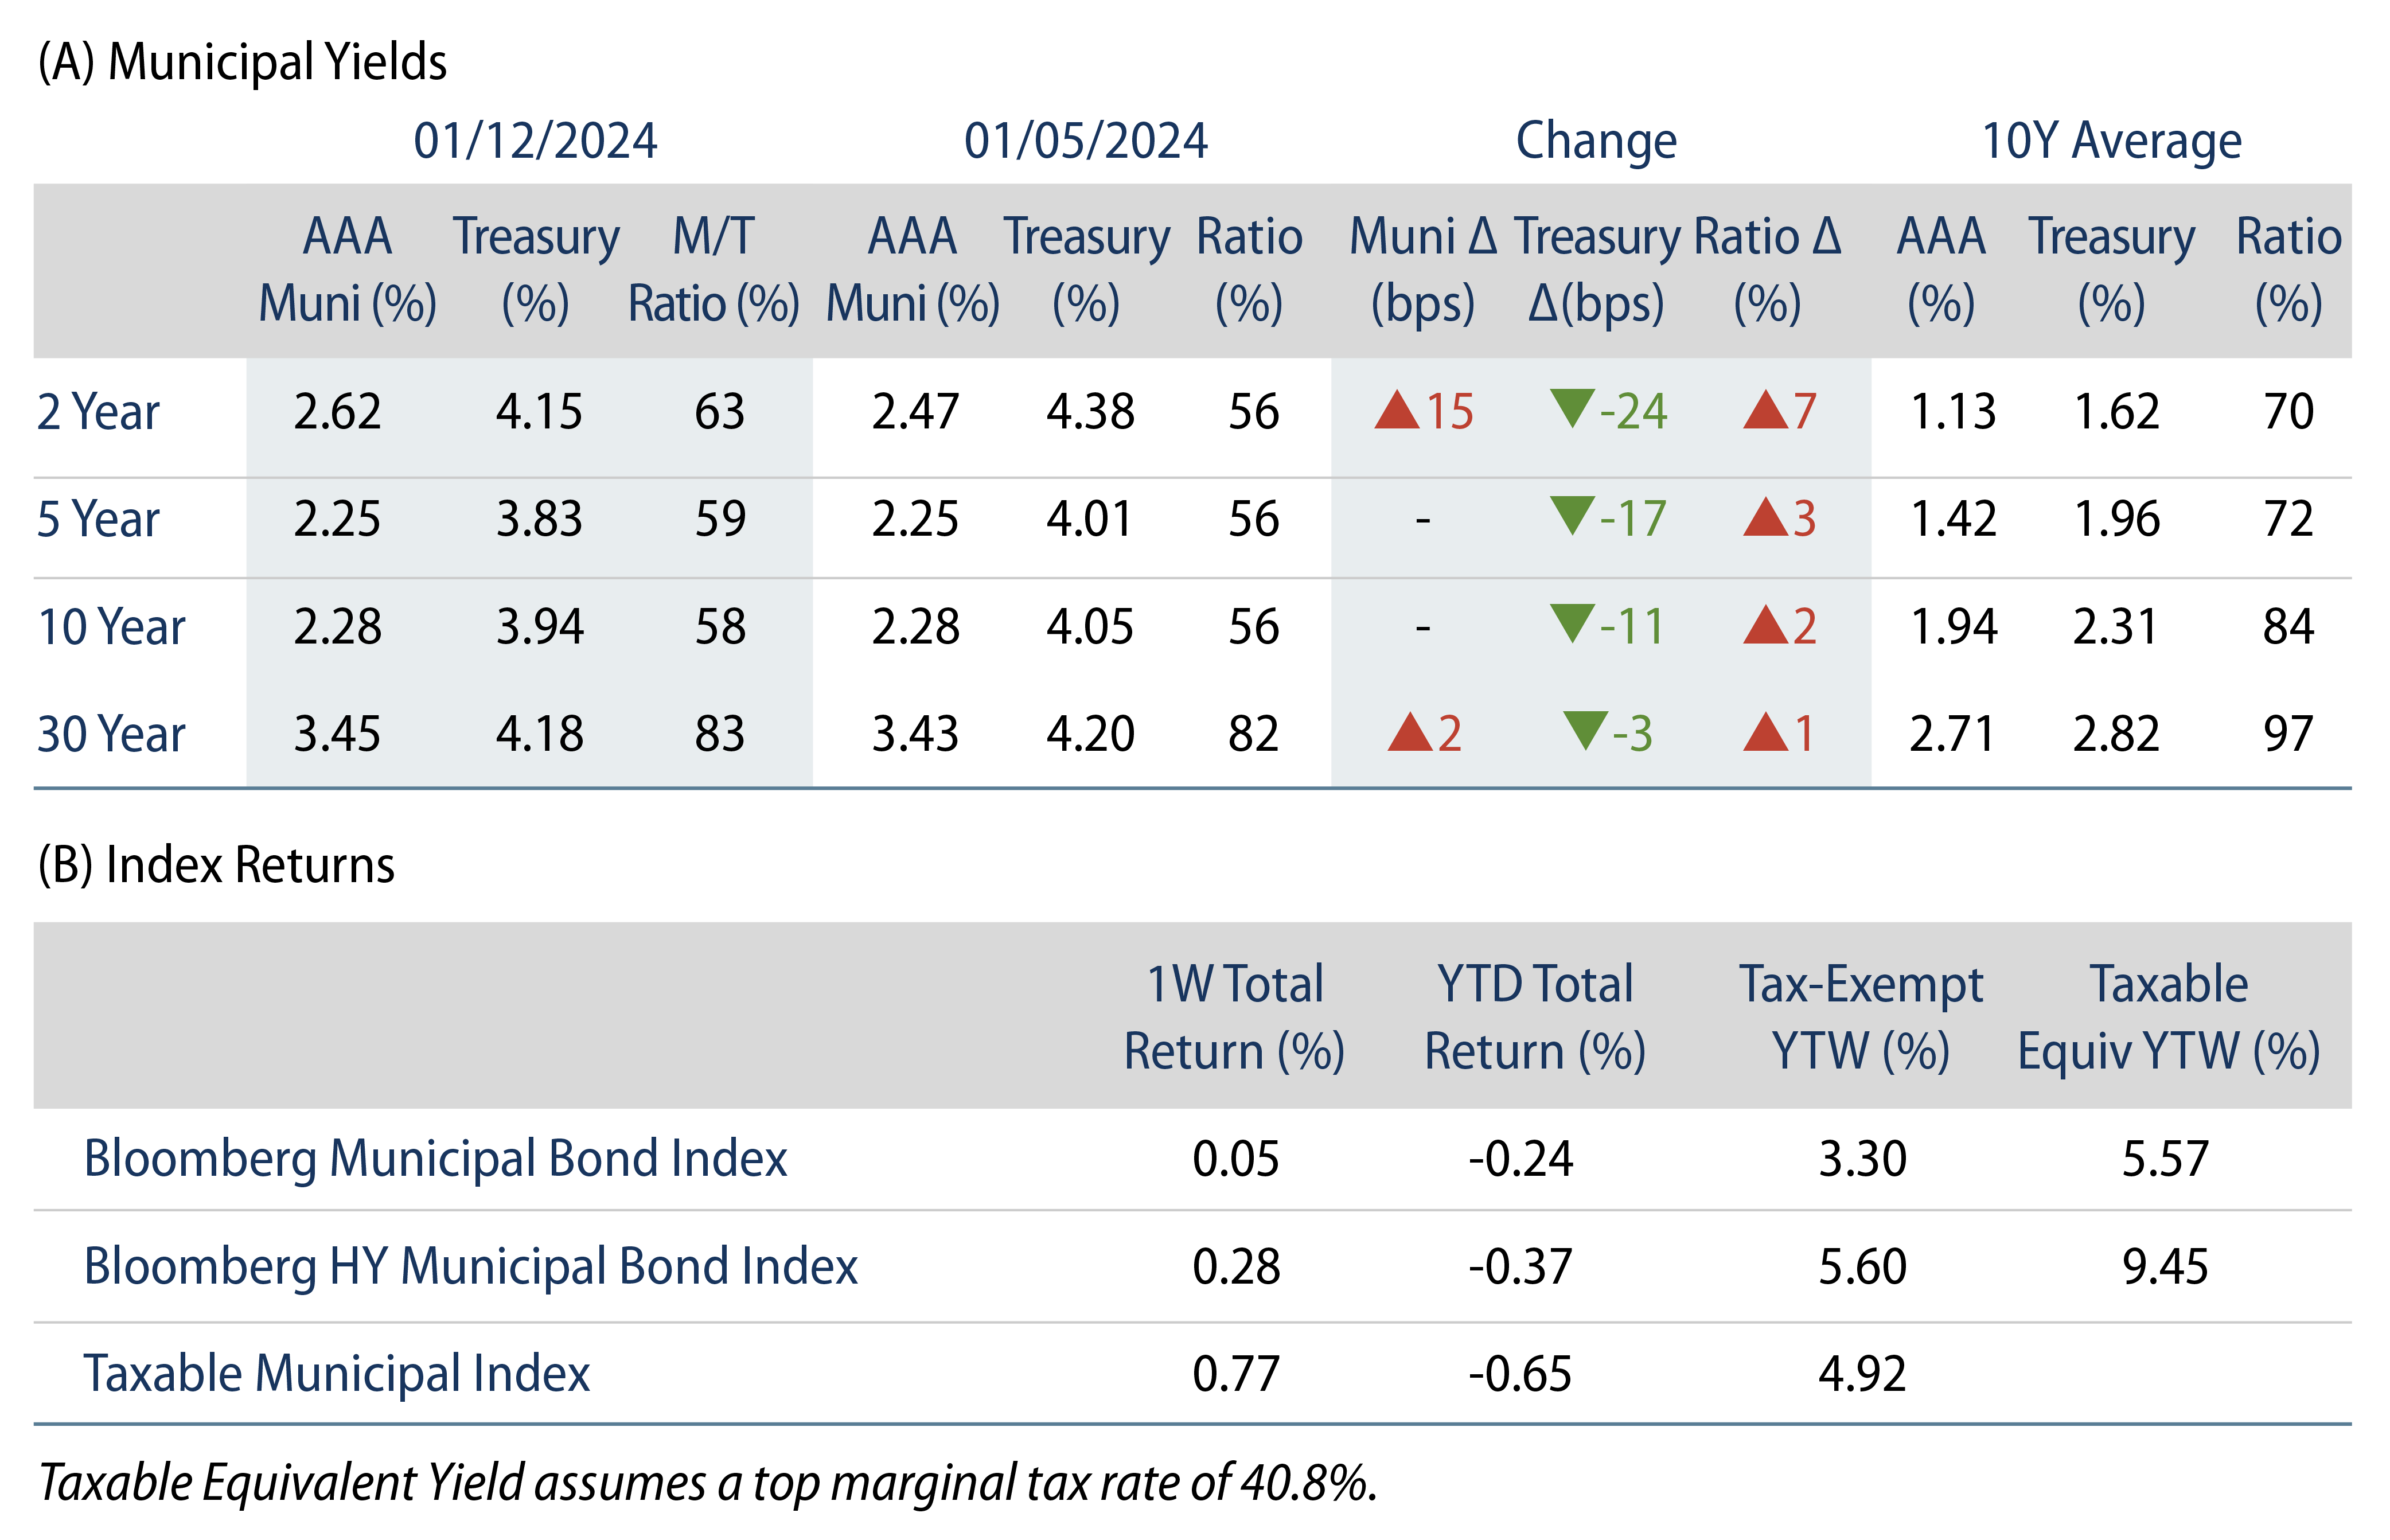
Theme #1: Municipal index yields and taxable-equivalent yields are above decade highs.

Exhibit 8: Muni and Taxable-Equivalent Muni Yield-to-Worst
Muni and Taxable-Equivalent Muni Yield-to-Worst
Source: Bloomberg, Western Asset. As of 12 Jan 24. Bloomberg Municipal Bond Index Yield Considering Highest Marginal Tax Rate. Select the image to expand the view.

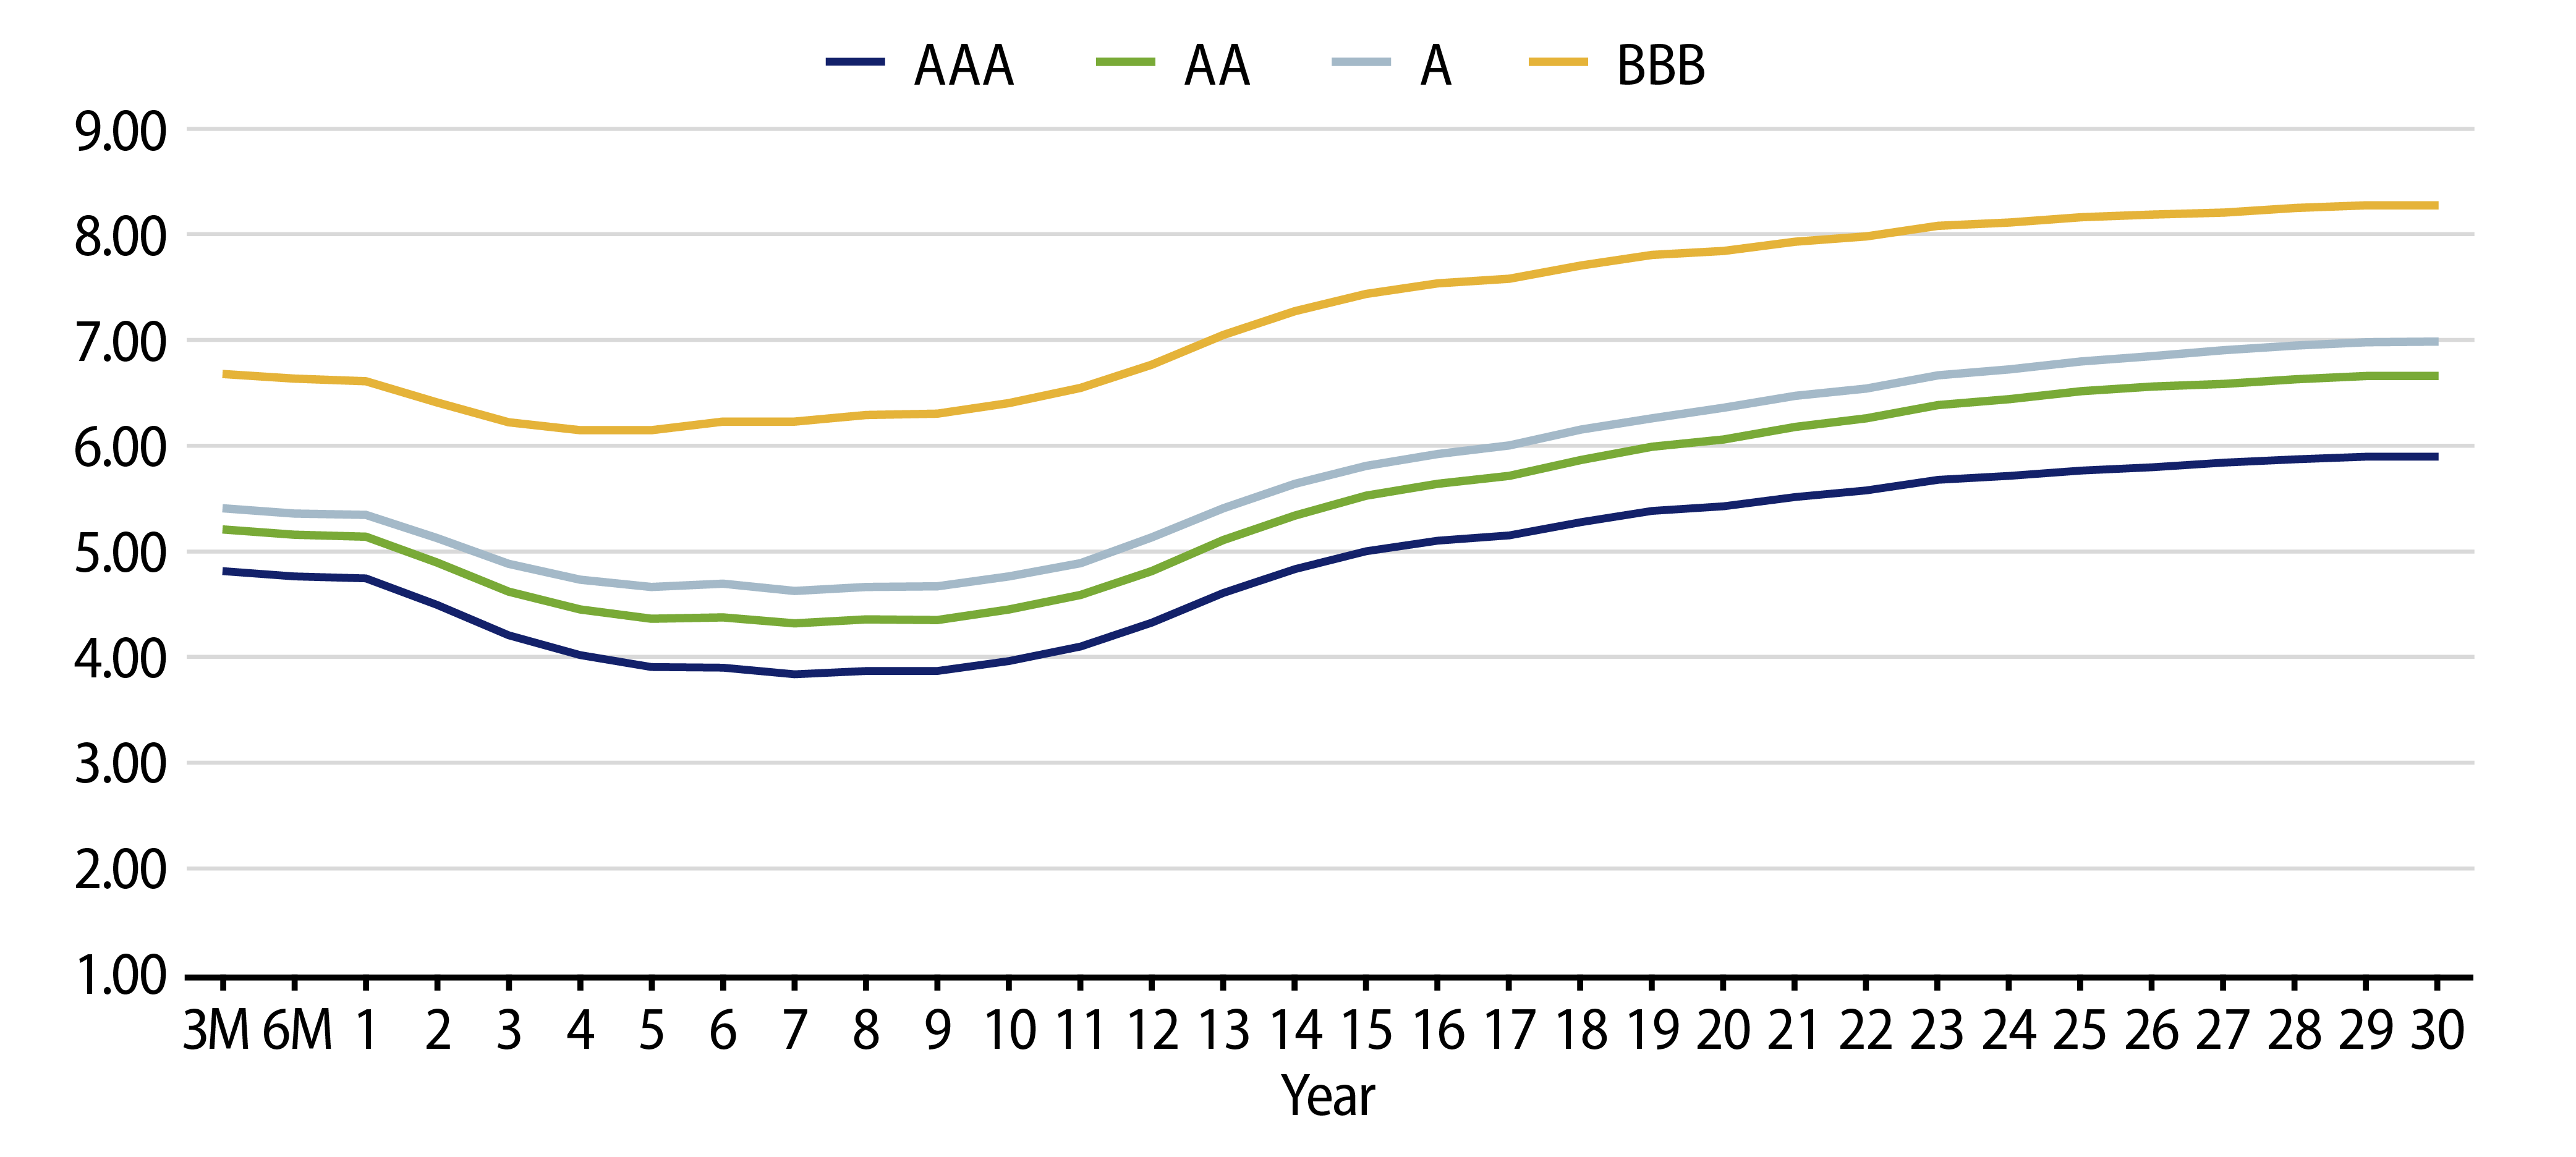
Theme #2: Recent steepening of muni yield curve highlights potential value in moving out to longer maturities.

Exhibit 9: AAA Municipal vs. Treasury Yield Curves
AAA Municipal vs. Treasury Yield Curves
Source: Bloomberg, Western Asset. As of 12 Jan 24. Bloomberg BVAL AAA Muni Curve and US On-/Off-the-Run Sovereign Curve. Select the image to expand the view.

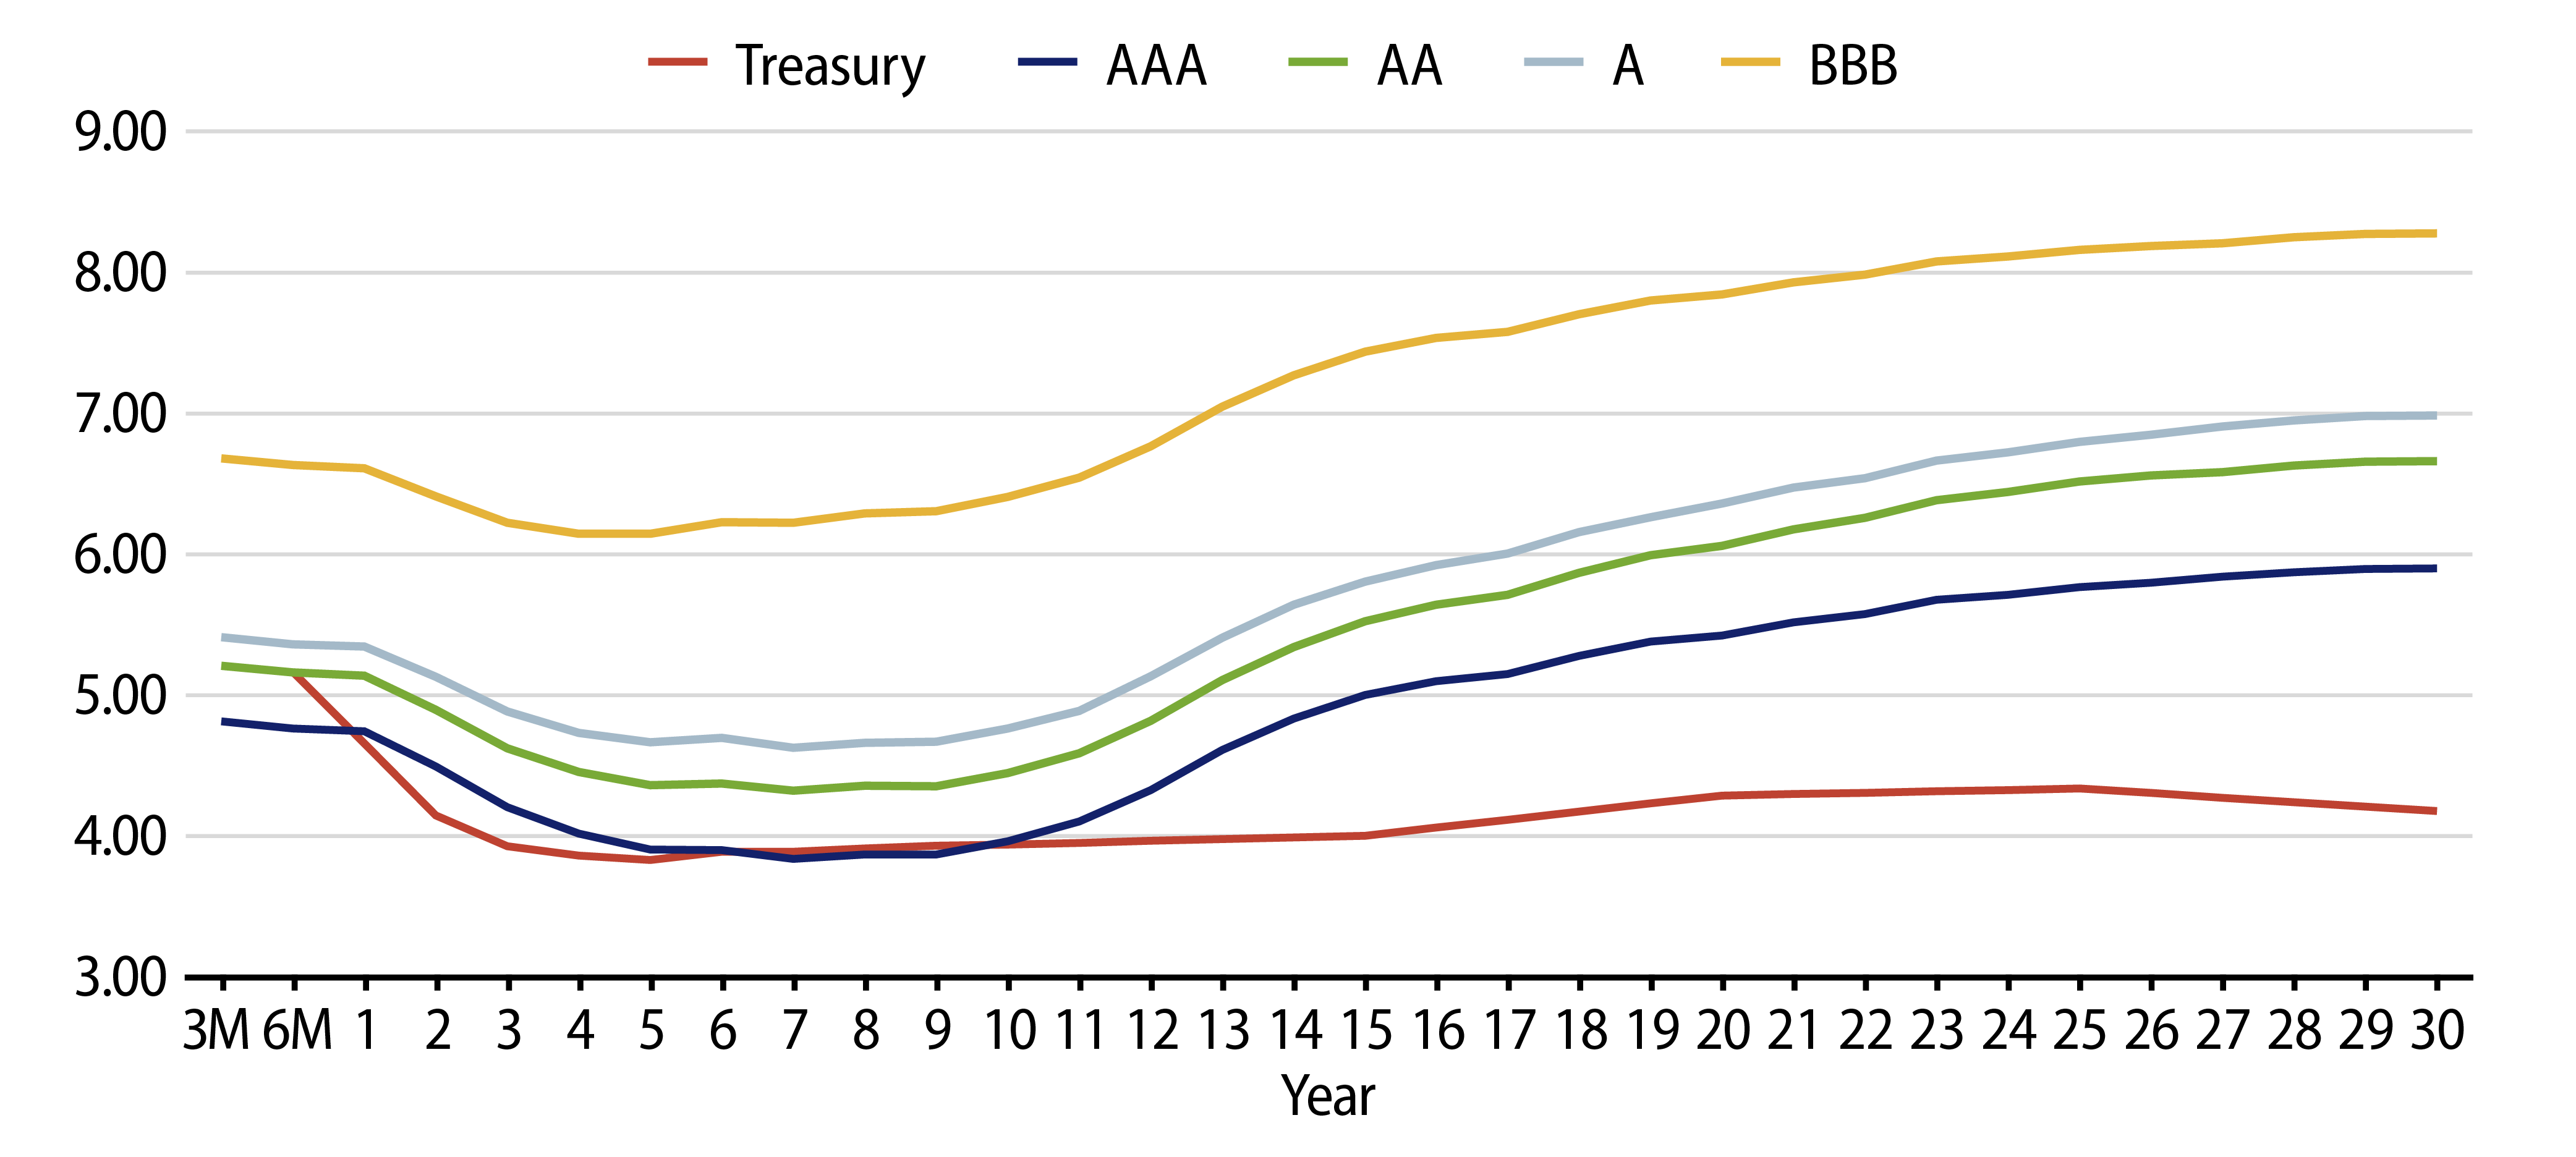
Theme #3: Munis offer attractive after-tax yield pickup versus long Treasuries and corporate credit.

Exhibit 10: Municipal vs. Taxable Fixed-Income Yields by Quality
Municipal vs. Taxable Fixed-Income Yields by Quality
Source: Western Asset, Bloomberg. As 12 Jan 24. Bloomberg BVAL AAA Muni Curve and US On-/Off-the-Run Sovereign Curve. After-tax yield considers top marginal tax rate of 40.8%. Select the image to expand the view.

投資一任契約および金融商品に係る投資顧問料(消費税を含む):
投資一任の場合は運用財産の額に対して、年率1.10%(税抜き1.00%)を上限とする運用手数料を、運用戦略ごとに定めております。 また、別途運用成果に応じてお支払いいただく手数料(成功報酬)を設定する場合があります。その料率は、運用成果の評価方法や固定報酬率の設定方法により変動しますので、手数料の金額や計算方法をこの書面に記載することはできません。
投資信託の場合は投資信託ごとに信託報酬が定められておりますので、目論見書または投資信託約款でご確認ください。

有価証券の売買又はデリバティブ取引の売買手数料を運用財産の中からお支払い頂きます。投資信託に投資する場合は信託報酬、管理報酬等の手数料が必要となります。これらの手数料には多様な料率が設定されているためこの書面に記載することはできません。デリバティブ取引を利用する場合、運用財産から委託証拠金その他の保証金を預託する場合がありますが、デリバティブ取引の額がそれらの額を上回る可能性があります。その額や計算方法はこの書面に記載することはできません。投資一任契約に基づき運用財産の運用を行った結果、金利、通貨の価格、金融商品市場における相場その他の指標に係る変動により、損失が生ずるおそれがあります。損失の額が、運用財産から預託された委託証拠金その他の保証金の額を上回る恐れがあります。個別交渉により、一部のお客様とより低い料率で投資一任契約を締結する場合があります。

©Western Asset Management Company Ltd 2024. 本資料の著作権は、ウエスタン・アセット・マネジメント株式会社およびその関連会社(以下「ウエスタン・アセット」という)に帰属するものであり、意図した受取人のみを対象として作成されたものです。本資料に記載の内容は、秘密情報及び専有情報としてお取り扱いください。ウエスタン・アセットの書面による事前の承諾なしに、全部又は一部を無断で複写、複製することや転載することを堅くお断りいたします。

過去の運用実績は将来の運用実績を示すものではありません。また、本資料は、将来の実績を予測または予想するものではありません。

本資料は、適格機関投資家、特定投資家、企業年金基金、公的年金等、豊富な投資経験と高度な専門知識とを備えたプロフェッショナルのお客様のみにご提供するものです。


本資料は情報の提供のみを目的としています。資料作成時点のウエスタン・アセットの見解を掲載したものであり、将来予告なしに変更する場合があります。また、リアルタイムの市場動向や運用に関する見解ではありません。

本資料で第三者のデータが使用されている場合、ウエスタン・アセットはそのデータが公表時点で正確であると信じていますが、それを保証するものではありません。ウエスタン・アセットの戦略・商品の受賞またはランキングが含まれている場合、これらは独立した第三者または業界出版物により公平な定量・定性情報に基づき決定されたものです。ウエスタン・アセットは、これらの第三者の標準的な業界サービスを利用したり、出版物を購読したりする場合がありますが、それらは、すべてのアセット・マネージャーが利用可能なものであり、ランキングや受賞に影響を与えるものではありません。

本資料に記載の戦略・商品には、元本の一部または全部の損失を含む大きなリスクが伴う場合があります。また、当該戦略や商品に投資することは大きな変動を伴なう可能性があり、投資家にはそのようなリスクを受け入れる経済力および意思を持つことが求められます。

特段の注記がない限り、本資料に記載の戦略のパフォーマンスはコンポジットのデータです。コンポジットではないその他のデータについては、当戦略の運用方針に最も近いと考えられる口座を、コンポジットの代表口座として掲載しています。つまり、代表口座は運用結果により選択されるものではありません。代表口座のポートフォリオ特性は、コンポジットやその他のコンポジット構成口座と異なる場合があります。これらの口座についての情報はご依頼に応じてご提供いたします。

本資料に記載している内容は、ウエスタン・アセットの投資家に対する投資助言ではありません。個別銘柄・発行体に関する一般的または具体的に言及する内容は、例としてご提示したものであり、購入または売却を推奨するものでもありません。また、ウエスタン・アセットの役職員及びお客様は、本資料に記載の有価証券を保有している可能性があります。 本資料は、会計、法務、税務、投資またはその他の助言の提供を意図したものではなく、またそれらに依存すべきではありません。お客様は、ウエスタン・アセットが提供する戦略・商品への投資を行うにあたり、経済的リスクやメリットなどについて助言が必要である場合は、ご自身の弁護士、会計士、投資家、税理士、その他のアドバイザーに相談して下さい。お客様は、居住国で適用される法令を遵守する責任を負います。

ウエスタン・アセットは世界有数の運用専門会社です。1971年の設立以来、債券運用に特化したアクティブ運用機関として最大規模の運用資産と運用チームを有しています。拠点は米国カリフォルニア州パサデナ、ニューヨーク、英国ロンドン、シンガポール、東京、豪メルボルン、ブラジル・サンパウロ、香港、スイス・チューリッヒにあり、フランクリン・リソーシズIncの完全子会社ですが、経営全般に独立性を保っており、次の6法人で構成されています。米国:ウエスタン・アセット・マネジメント・カンパニーLLC(米証券取引委員会(SEC)登録の投資顧問会社)。ブラジル・サンパウロ:ウエスタン・アセット・マネジメント・カンパニーDTVM Limitada(ブラジル証券取引委員会とブラジル中央銀行が認可・規制)。メルボルン:ウエスタン・アセット・マネジメント・カンパニーPty Ltd(事業者番号ABN 41 117 767 923、AFSライセンス303160)。シンガポール:ウエスタン・アセット・マネジメント・カンパニーPte. Ltd.(CMSライセンスCo. Reg. No. 200007692R、シンガポール通貨監督庁が監督)。日本:ウエスタン・アセット・マネジメント株式会社(金融商品取引業者、金融庁が規制)。英国:ウエスタン・アセット・マネジメント・カンパニーLimited(英金融行動監視機構(FCA)が認可(FRN145930)、規制)。本資料は英国ではFCAが定義する「プロフェッショナルな顧客」のみを対象とした宣伝目的に使用されます。許可された欧州経済領域 (EEA)加盟国へ配信する場合もあります。最新の承認済みEEA加盟国のリストは、ウエスタン・アセット(電話:+44 (0)20 7422 3000)までお問い合わせください。

詳細は当社ウエブサイトwww.westernasset.co.jpをご参照ください。
ウエスタン・アセット・マネジメント株式会社について
業務の種類: 金融商品取引業者(投資運用業、投資助言・代理業、第二種金融商品取引業)
登録番号: 関東財務局長(金商)第427号
加入協会: 一般社団法人日本投資顧問業協会(会員番号 011-01319)
一般社団法人投資信託協会