マーケット・ブログ
MARKETS
09 January 2024

Weekly Municipal Monitor—Year in Review

By Sam Weitzman

Municipals Began 2024 with Negative Returns Last Week

Munis shrugged off the Treasury selloff last week and posted positive total returns, following stronger than anticipated payroll data and just $400 million of new-issue supply. The high-grade muni curve steepened, declining 5 bps in 2-years and increasing 1 bp in 30-years. The Bloomberg Municipal Index returned -0.29% during the week, the High Yield Muni Index returned -0.64% and the Taxable Muni Index returned -1.41%. This week we recap 2023 muni performance and market trends.

2023 Performance: Municipals Stage a Comeback

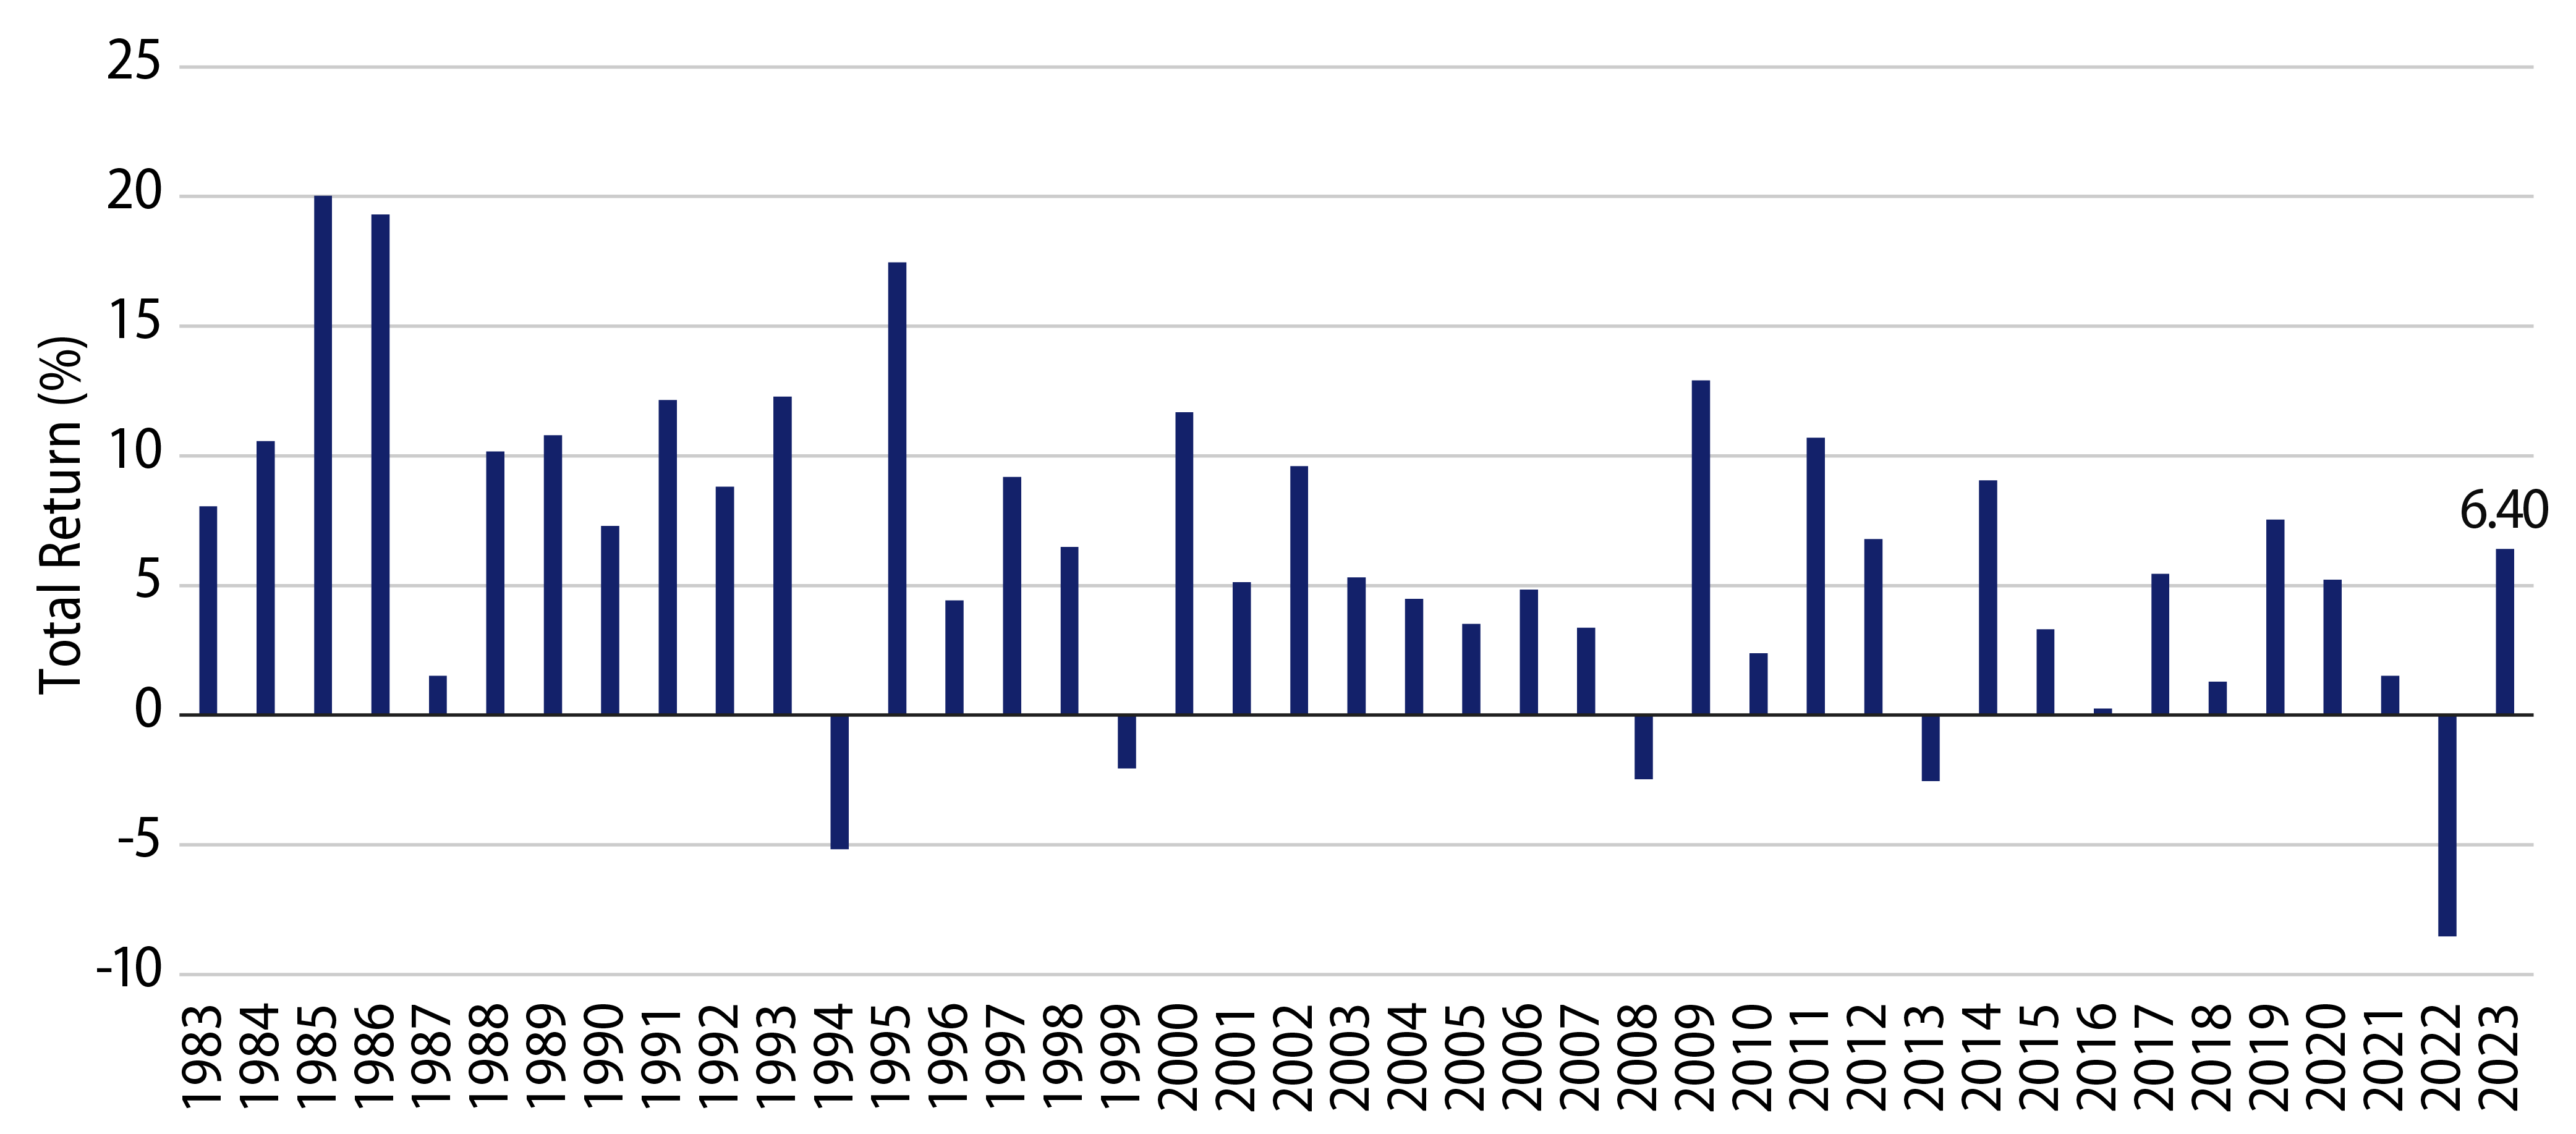
Following the worst calendar year return in 40 years in 2022, the Bloomberg Municipal Bond Index returned an above-average 6.40% in 2023. The majority of the year’s positive performance arrived during the final two months of the year, as the index returned 8.82% in November and December.

Longer-term and lower credit quality municipals outperformed during the year, as the Bloomberg Long Muni Index returned 9.35% and the Bloomberg High Yield Muni Index returned 9.21%. Longer-duration taxable municipals also posted strong performance, considering the Bloomberg Taxable Muni Index returned 8.84%.

Exhibit 1: Bloomberg Municipal Bond Index Returns Over Time
Bloomberg Municipal Bond Index Returns Over Time
Source: Bloomberg. As of 31 Dec 23. Select the image to expand the view.

Weak Supply and Demand Technicals Weighed on the Market for Much of the Year

Market technicals were generally weak throughout the year, considering mutual fund outflows and higher tax-exempt supply.

From a demand perspective and following the record $116 billion municipal mutual fund outflow cycle observed in 2022, according to ICI, muni mutual funds recorded an additional $6 billion of outflows in 2023. Muni open-end funds recorded $15 billion of net outflows and municipal ETFs recorded $16 billion of net inflows. While overall fund demand has been lackluster over the year, continued SMA demand has kept high-quality munis at the front end of the curve well supported.

From a supply perspective, total municipal issuance of $367 billion was down 2% from 2022 levels. Tax-exempt muni supply reached $328 billion in 2023, 5% higher than the prior year’s level, but still nearly 17% below pre-2018 levels when the Tax Cuts and Jobs Act limited tax-exempt refinancing activity. Taxable issuance remained lackluster in the higher rate environment, falling 36% year-over-year to $38 billion, or 12% of total issuance, which is more aligned with longer-term averages.

State and Local Credit Remained Resilient

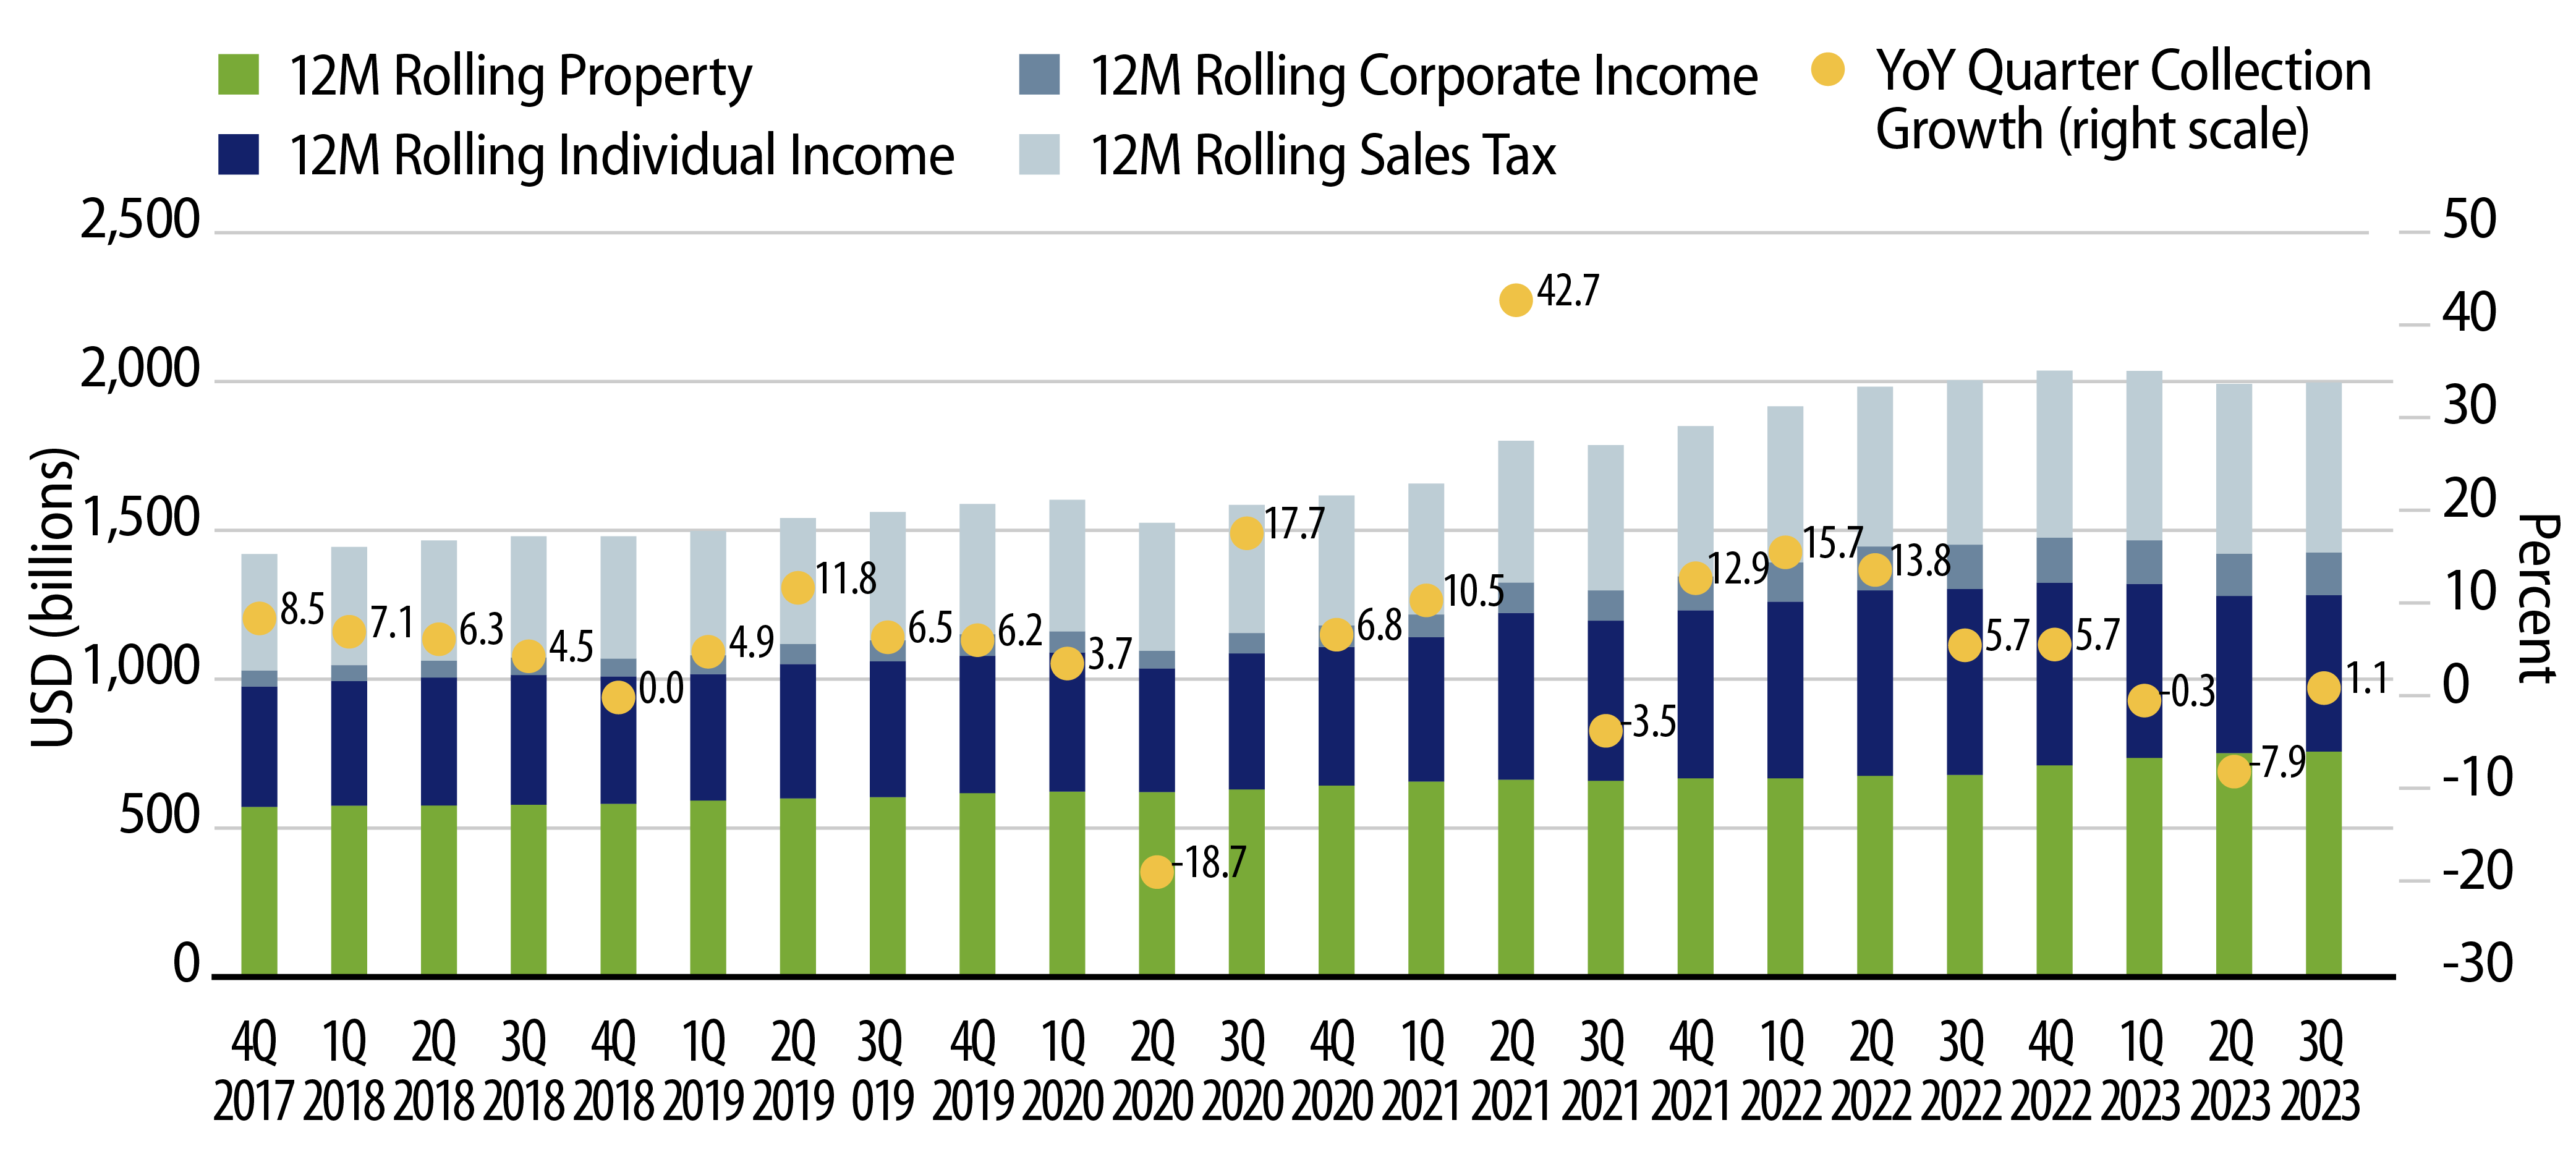
State and local revenues trended lower with tightening economic conditions through the first half of the year before rebounding marginally in the third quarter, according to Census estimates. Twelve-month trailing state and local revenues as of September were unchanged from the prior year at $2.0 trillion, just 2% shy of record levels set in the fourth quarter of 2022. While slowing tax collections are expected to contribute to headline deficits in 2024, strong labor and real estate markets should continue to support historically high state and local revenues, elevated cash balances, and favorable budgetary flexibility.

Exhibit 2: 12-Month Trailing State and Local Revenue Collections
12-Month Trailing State and Local Revenue Collections
Source: U.S. Census Bureau, Western Asset. As of 14 Dec 23. Select the image to expand the view.

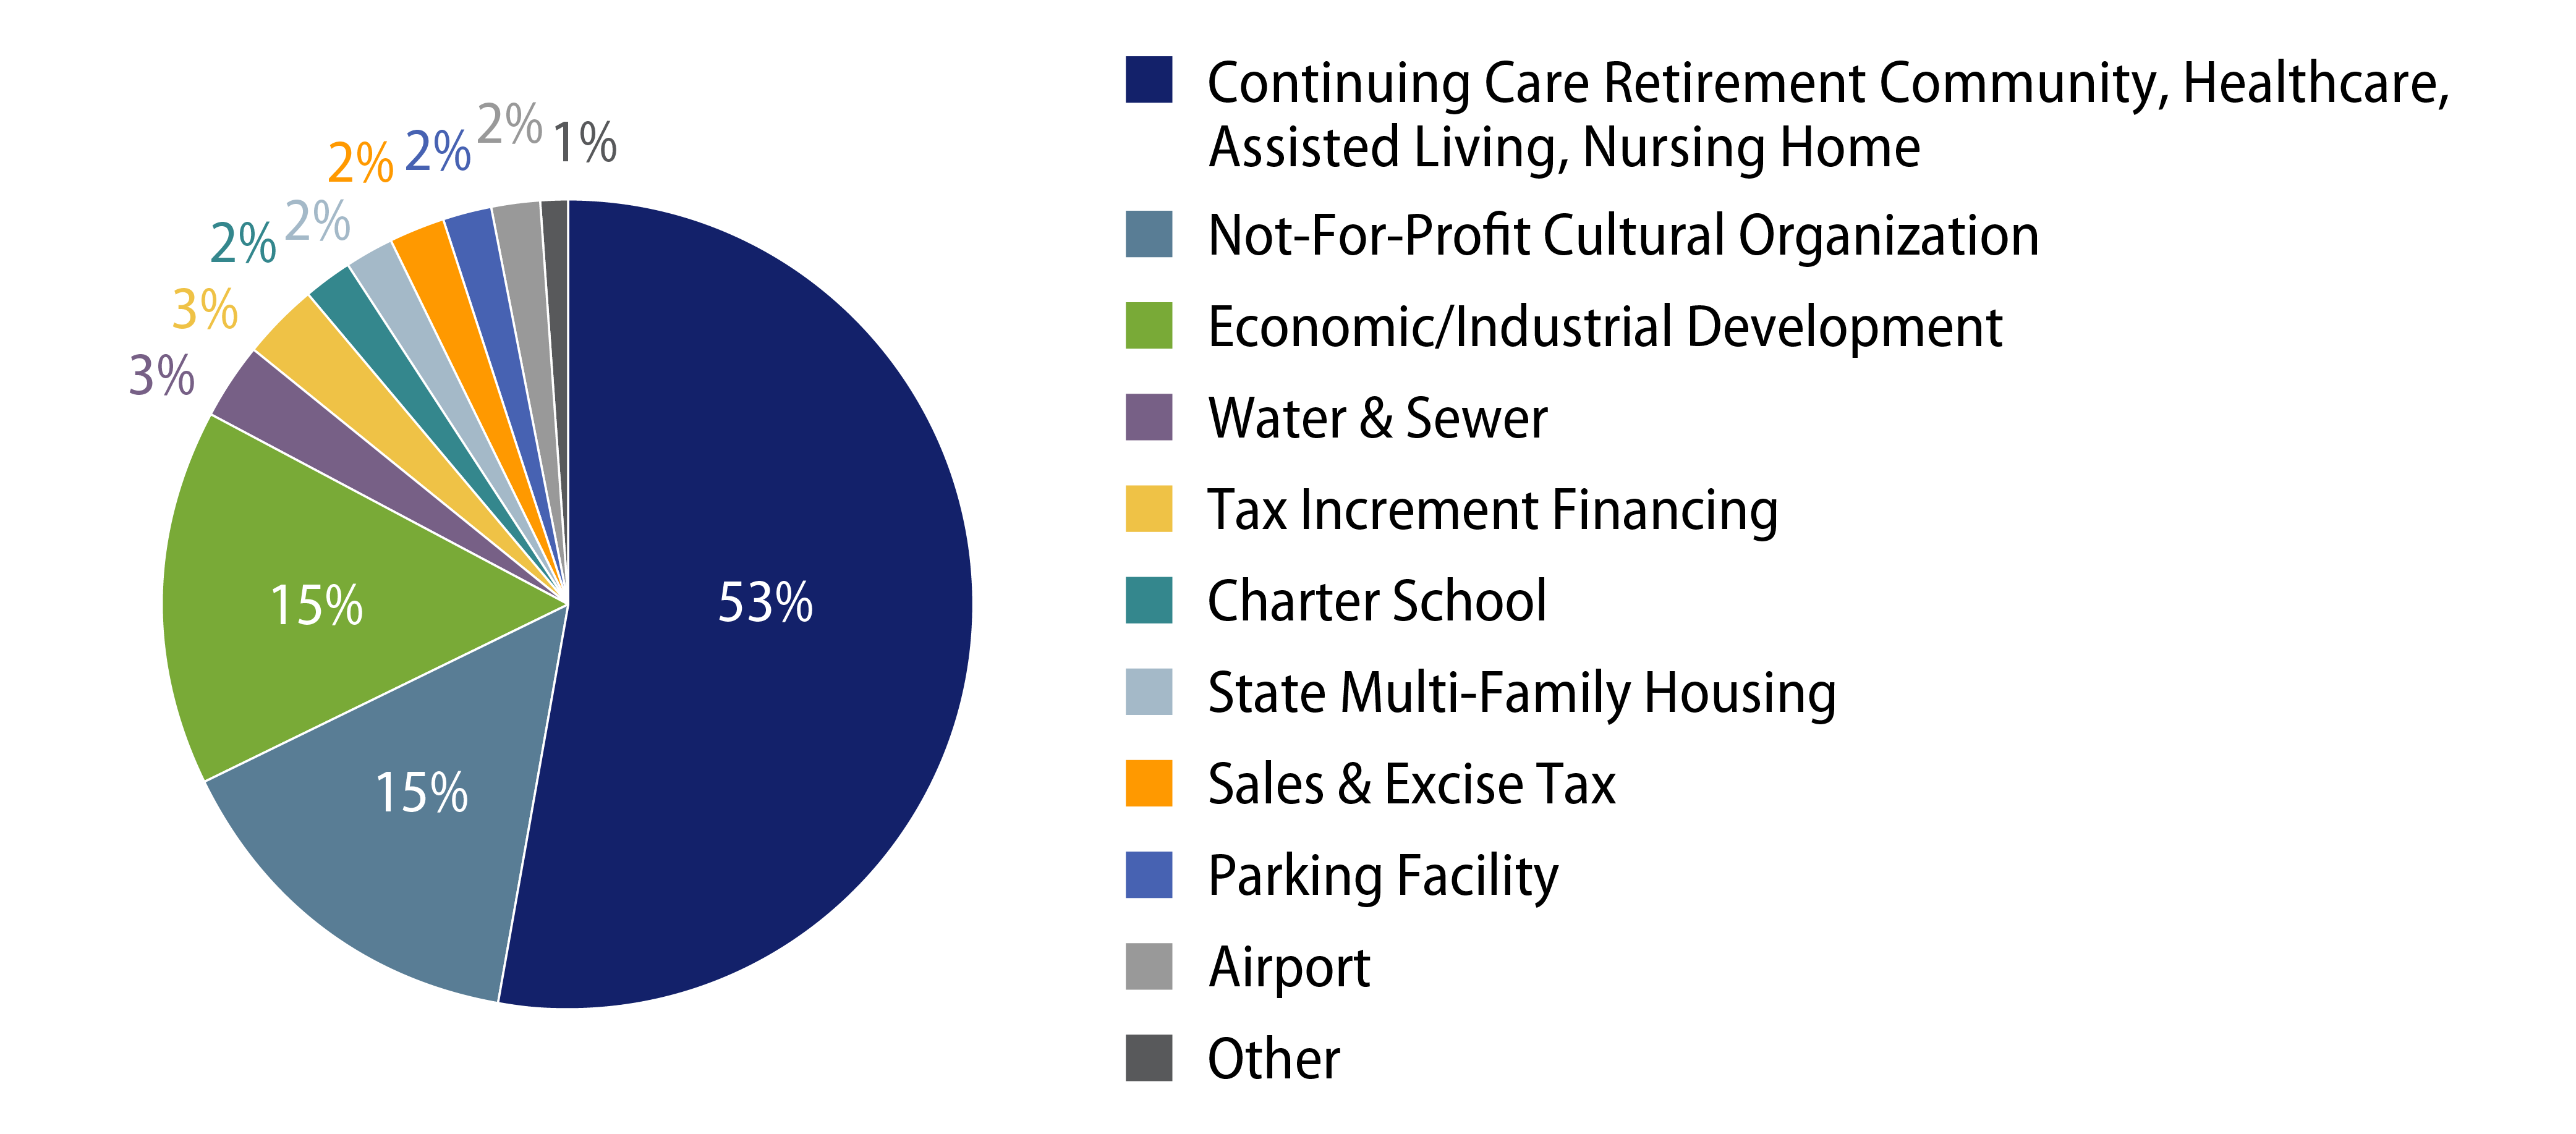
Municipal defaults remained limited and contained to select high-yield sectors in 2023. According to Bloomberg data through December 19, the municipal market recorded 53 first-time debt service payment defaults totaling $1.9 billion, up from the 47 defaults that totaled $1.3 billion in 2022. Similar to recent years, over 50% of outstanding defaulted par was driven by high-yield Continuing Care and Retirement Community (CCRC), Assisted Living, and Health Care sectors still affected by labor cost pressures.

Exhibit 3: 2023 Municipal Defaults by % Par Value ($1.9 Billion Total)
2023 Municipal Defaults by % Par Value ($1.9 Billion Total)
Source: Bloomberg, Western Asset. As of 19 Dec 23. Select the image to expand the view.

Overall, the muni credit improvement observed over the last three years continued to contribute to significant upgrade trends. According to Bloomberg data through December 19, Moody’s, S&P and Fitch upgrades surpassed downgrades 7:1 by par value in 2023.

Valuations: Tax-Exempt Income Opportunities Remain Attractive

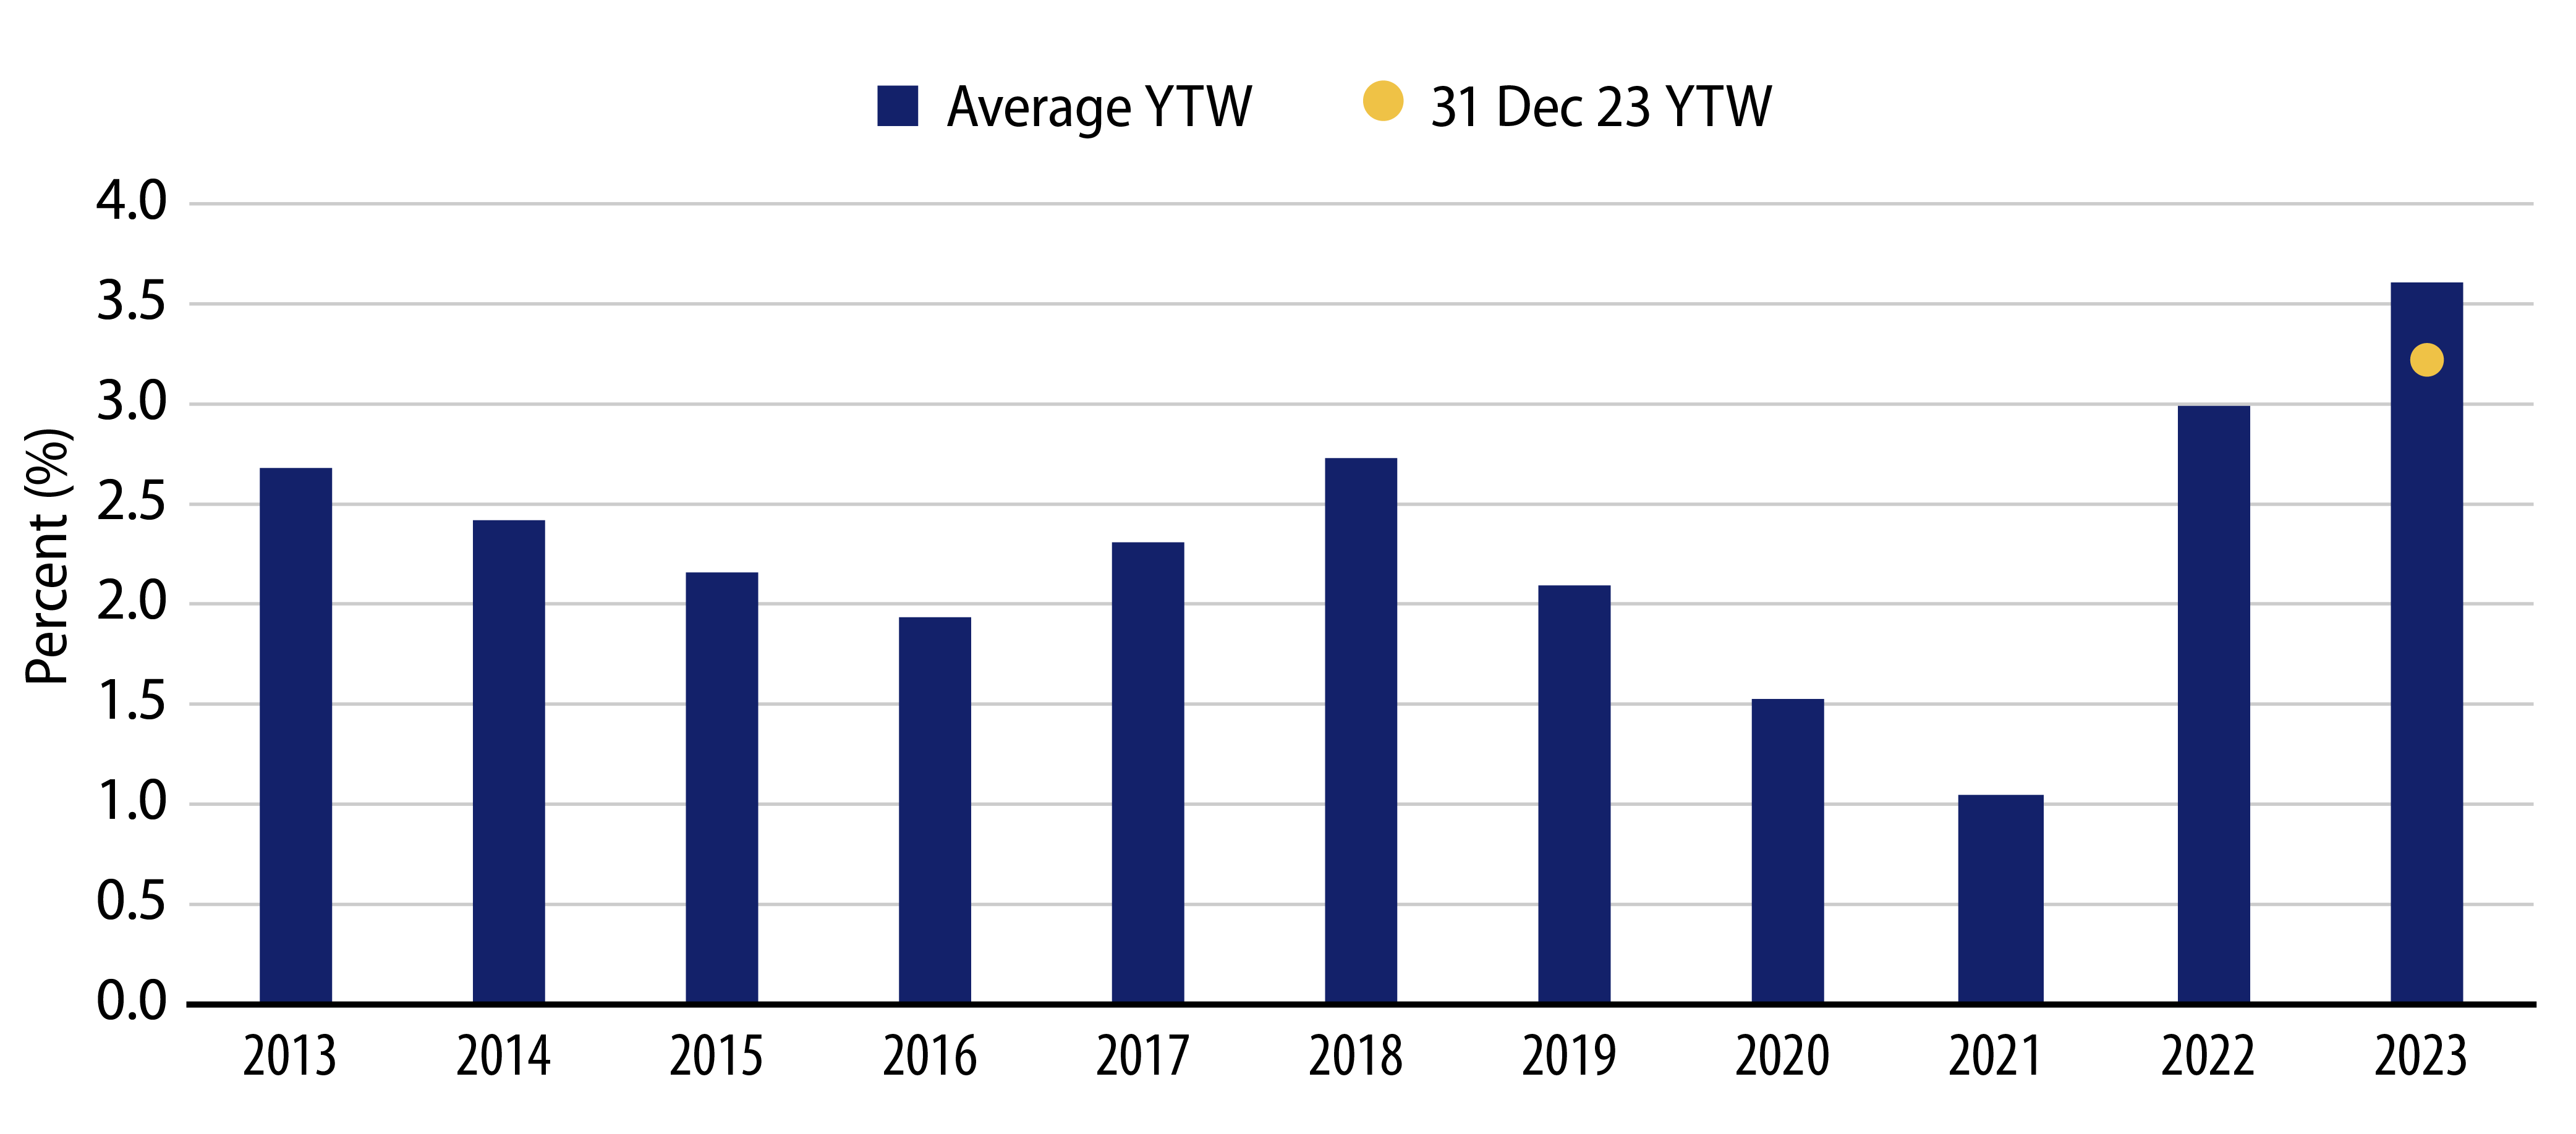
Despite strong performance of 6.40% during the year, the average Bloomberg Municipal Bond Index yield-to-worst (YTW) was down just 0.33% to 3.22%, or 5.43% on a taxable-equivalent basis. The elevated nominal yields and income opportunity offered by the muni market remains above the levels seen much of the past decade.

Exhibit 4: Average Muni YTW (%) by Calendar Year
Average Muni YTW (%) by Calendar Year
Source: Bloomberg Municipal Bond Index Yield-to-Worst (YTW). As of 31 Dec 23. Yield-to-worst (YTW) is the lowest potential yield that can be received on a bond without the issuer actually defaulting. Select the image to expand the view.

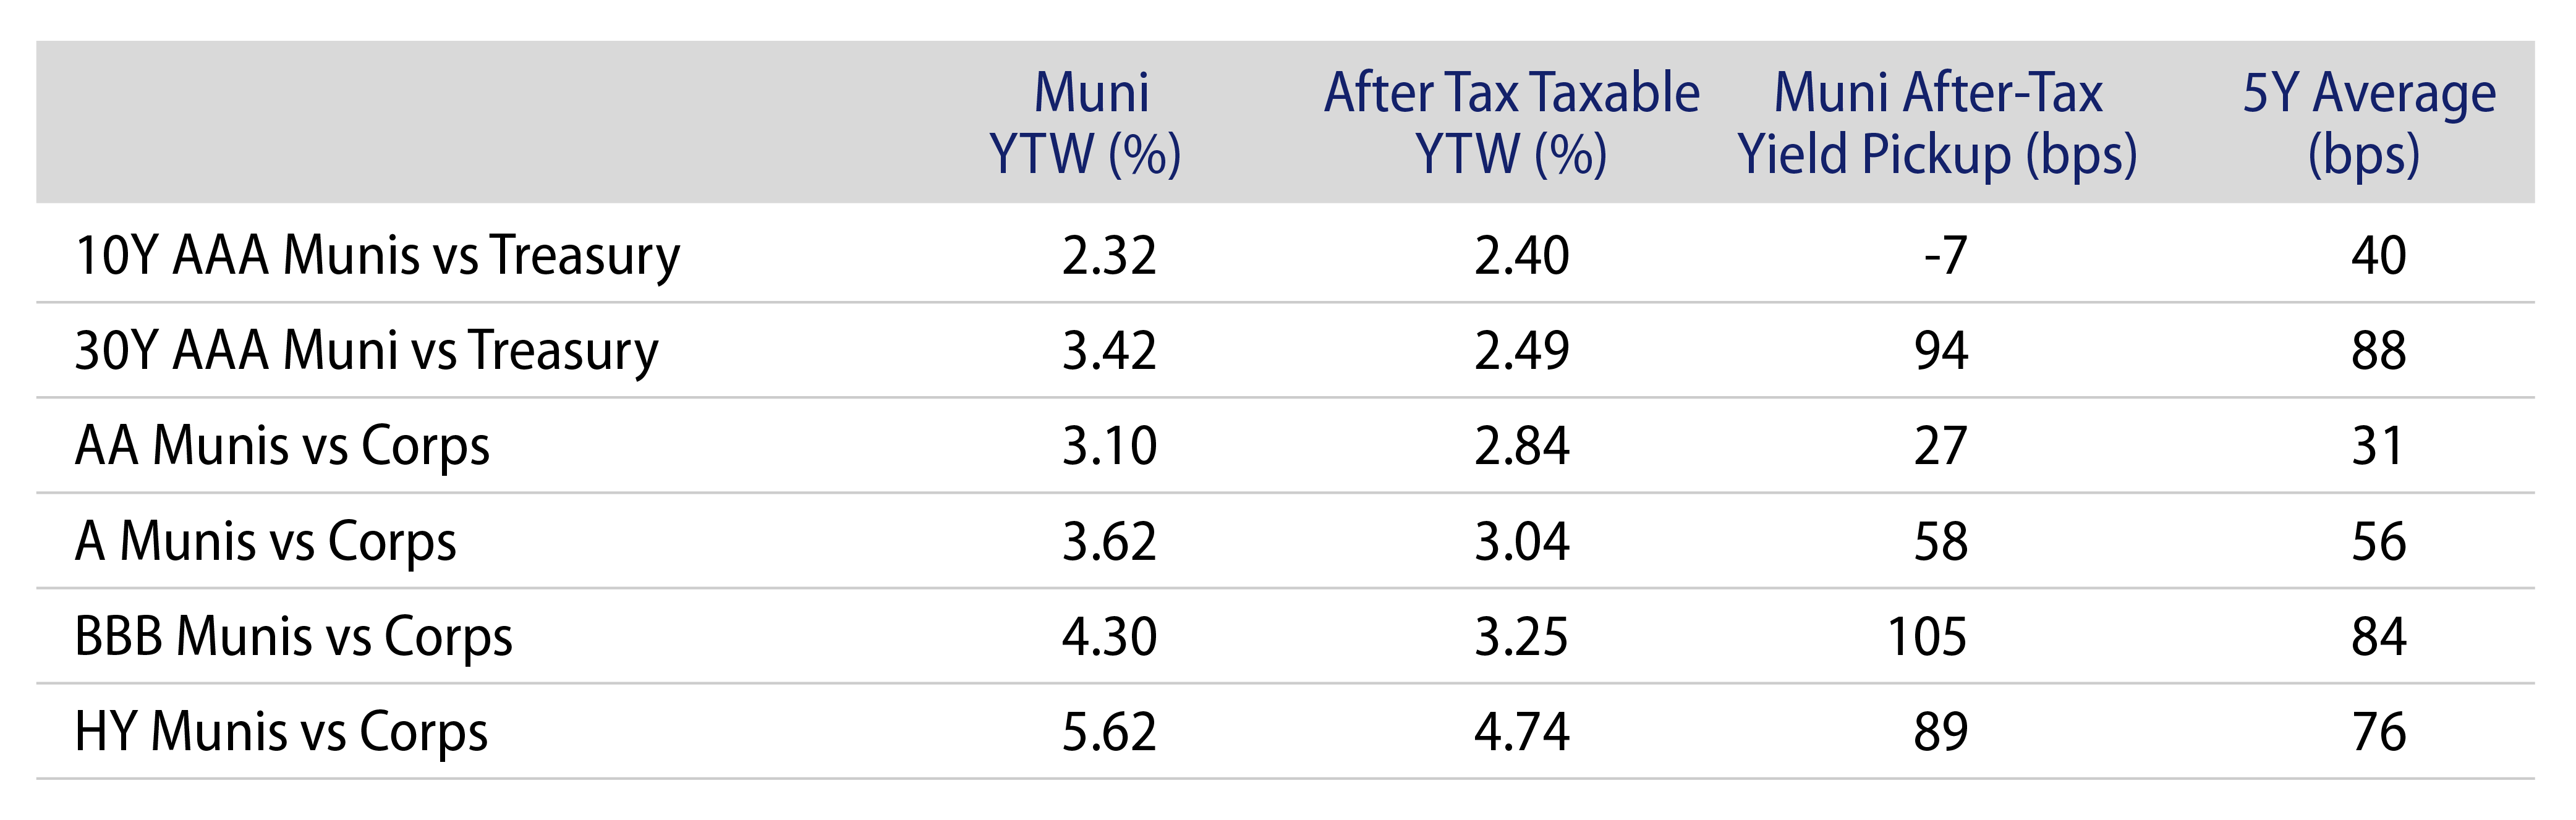
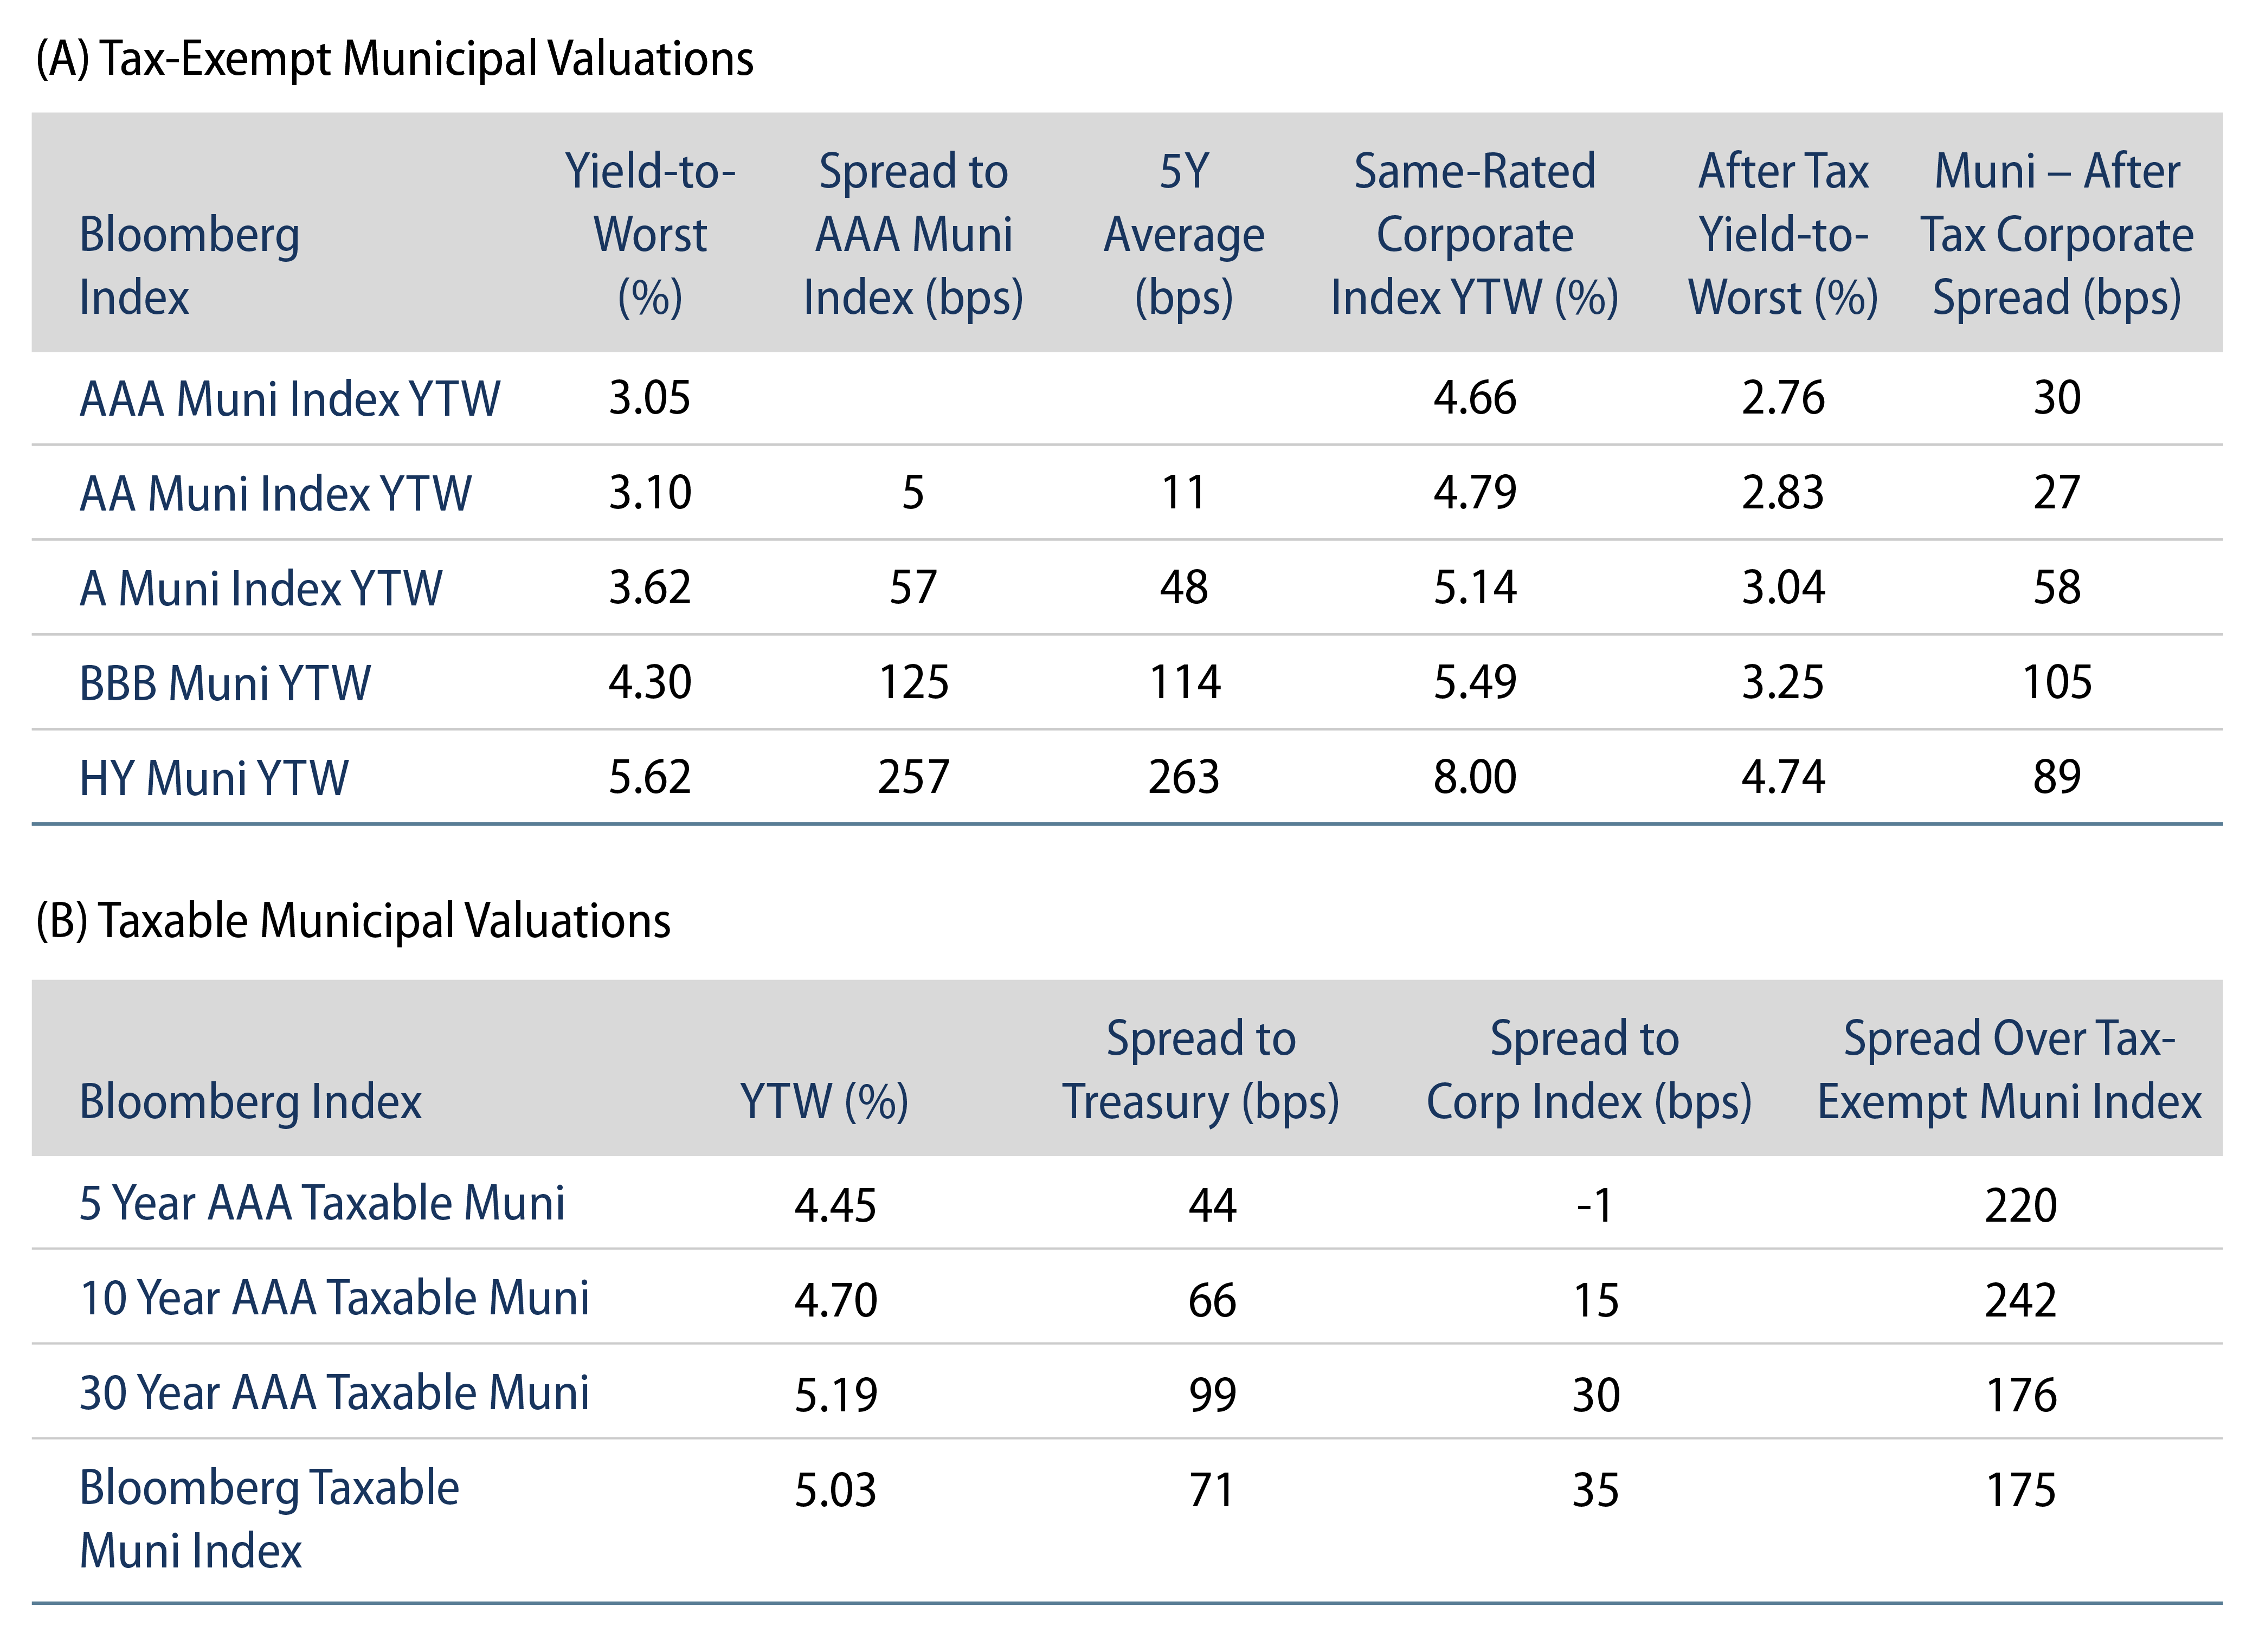
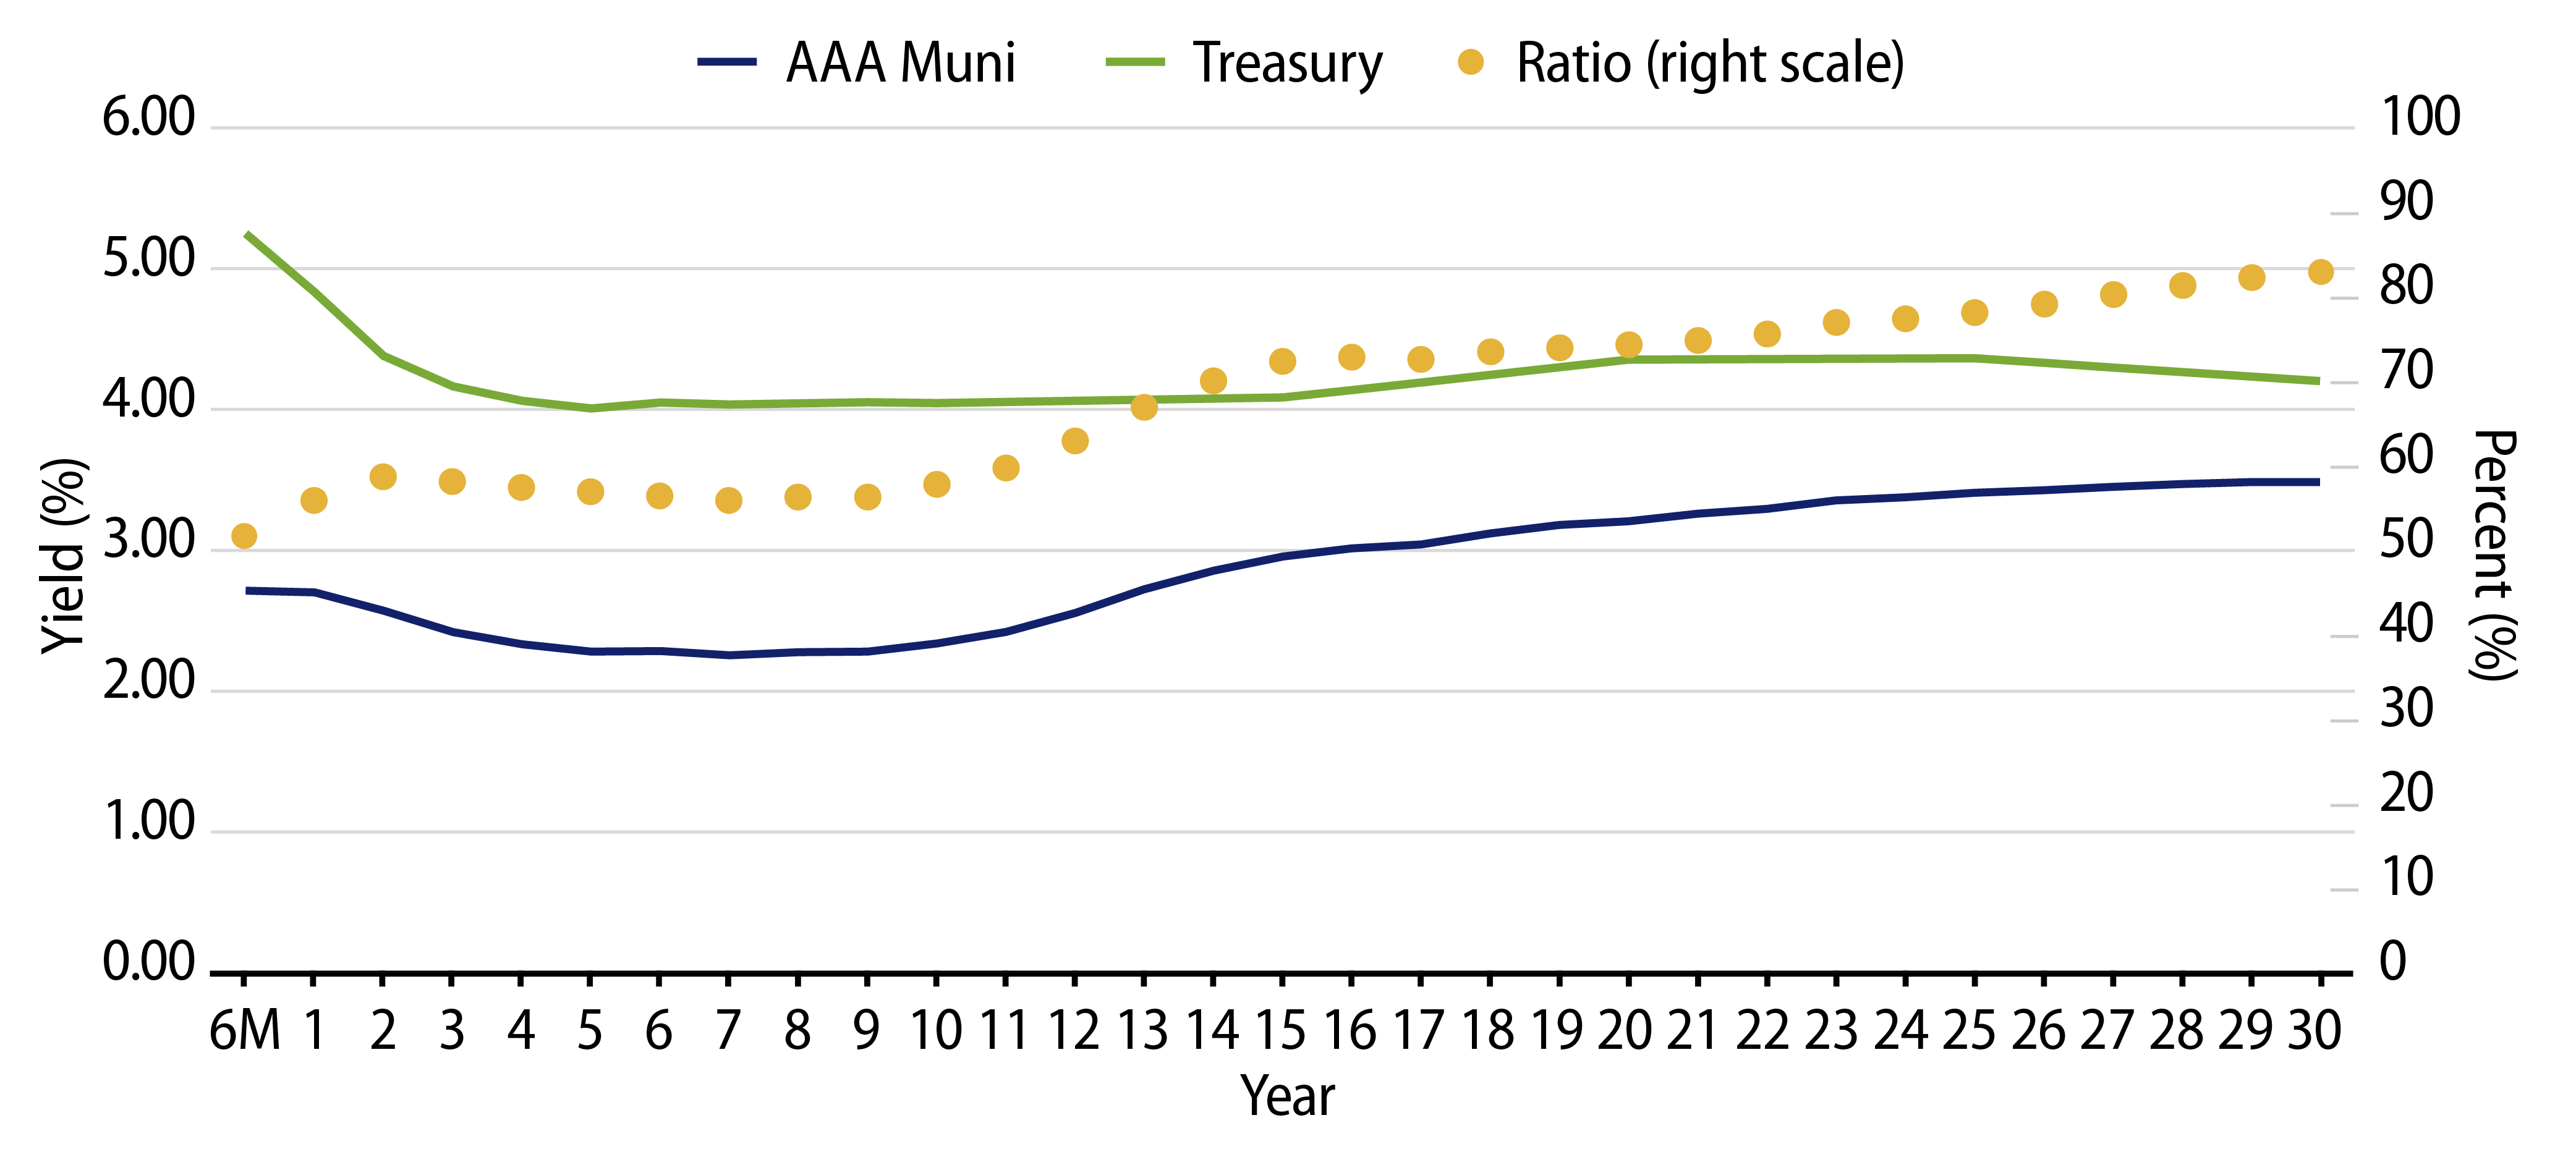
Considering the end-of-year outperformance, certain segments of the muni market do look less attractive, as top rated AAA muni/Treasury ratios declined to a below-average 56%. However, more value can be achieved down the credit spectrum as AA, A and BBB municipals offer more attractive after-tax yield pickup versus like-quality corporate counterparts.

Exhibit 5: Muni After-Tax Investment-Grade Fixed-Income Spreads
Muni After-Tax Investment-Grade Fixed-Income Spreads
Source: Bloomberg, Western Asset. As of 05 Jan 24. AAA Muni vs. Treasury Bloomberg BVAL Curves as of 6/30/23; Muni vs. After-Tax Credit Spreads: AA, A and BBB Bloomberg BVAL Indices, Bloomberg Muni Index YTW—Bloomberg Corporate Index YTW (After Consideration of the Top 40.8% Income Tax Rate). Select the image to expand the view.
Exhibit 6: Tax-Exempt Muni Credit Curves
Tax-Exempt Muni Credit Curves
Source: Bloomberg, Western Asset. As of 05 Jan 24. Bloomberg BVAL Municipal Credit Indices (AAA, AA, A, BBB, respectively) and US Sovereign Curves. Taxable-Equivalent Muni Credit Curves consider the top marginal effective tax rate of 40.8%. Select the image to expand the view.
Exhibit 7: Taxable-Equivalent Muni Credit Curves
Taxable-Equivalent Muni Credit Curves
Source: Bloomberg, Western Asset. As of 05 Jan 24. Bloomberg BVAL Municipal Credit Indices (AAA, AA, A, BBB, respectively) and US Sovereign Curves. Taxable-Equivalent Muni Credit Curves consider the top marginal effective tax rate of 40.8%. Select the image to expand the view.
Exhibit 8: Municipal Bond Yields and Index Returns
Municipal Bond Yields and Index Returns
Source: Bloomberg. As of 05 Jan 24. Past performance is not a guarantee of future results. It is not possible to invest directly in an Index. Select the image to expand the view.
Exhibit 9: Tax-Exempt and Taxable Muni Valuations
Tax-Exempt and Taxable Muni Valuations
Source: Bloomberg. As of 05 Jan 24. Select the image to expand the view.

Western Asset Key Themes for Muni Investors

Theme #1: Municipal index yields and taxable-equivalent yields are above decade averages.

Exhibit 10: Muni and Taxable-Equivalent Muni Yield-to-Worst
Muni and Taxable-Equivalent Muni Yield-to-Worst
Source: Bloomberg, Western Asset. As of 15 Dec 23. Bloomberg Municipal Bond Index Yield Considering Highest Marginal Tax Rate. Select the image to expand the view.

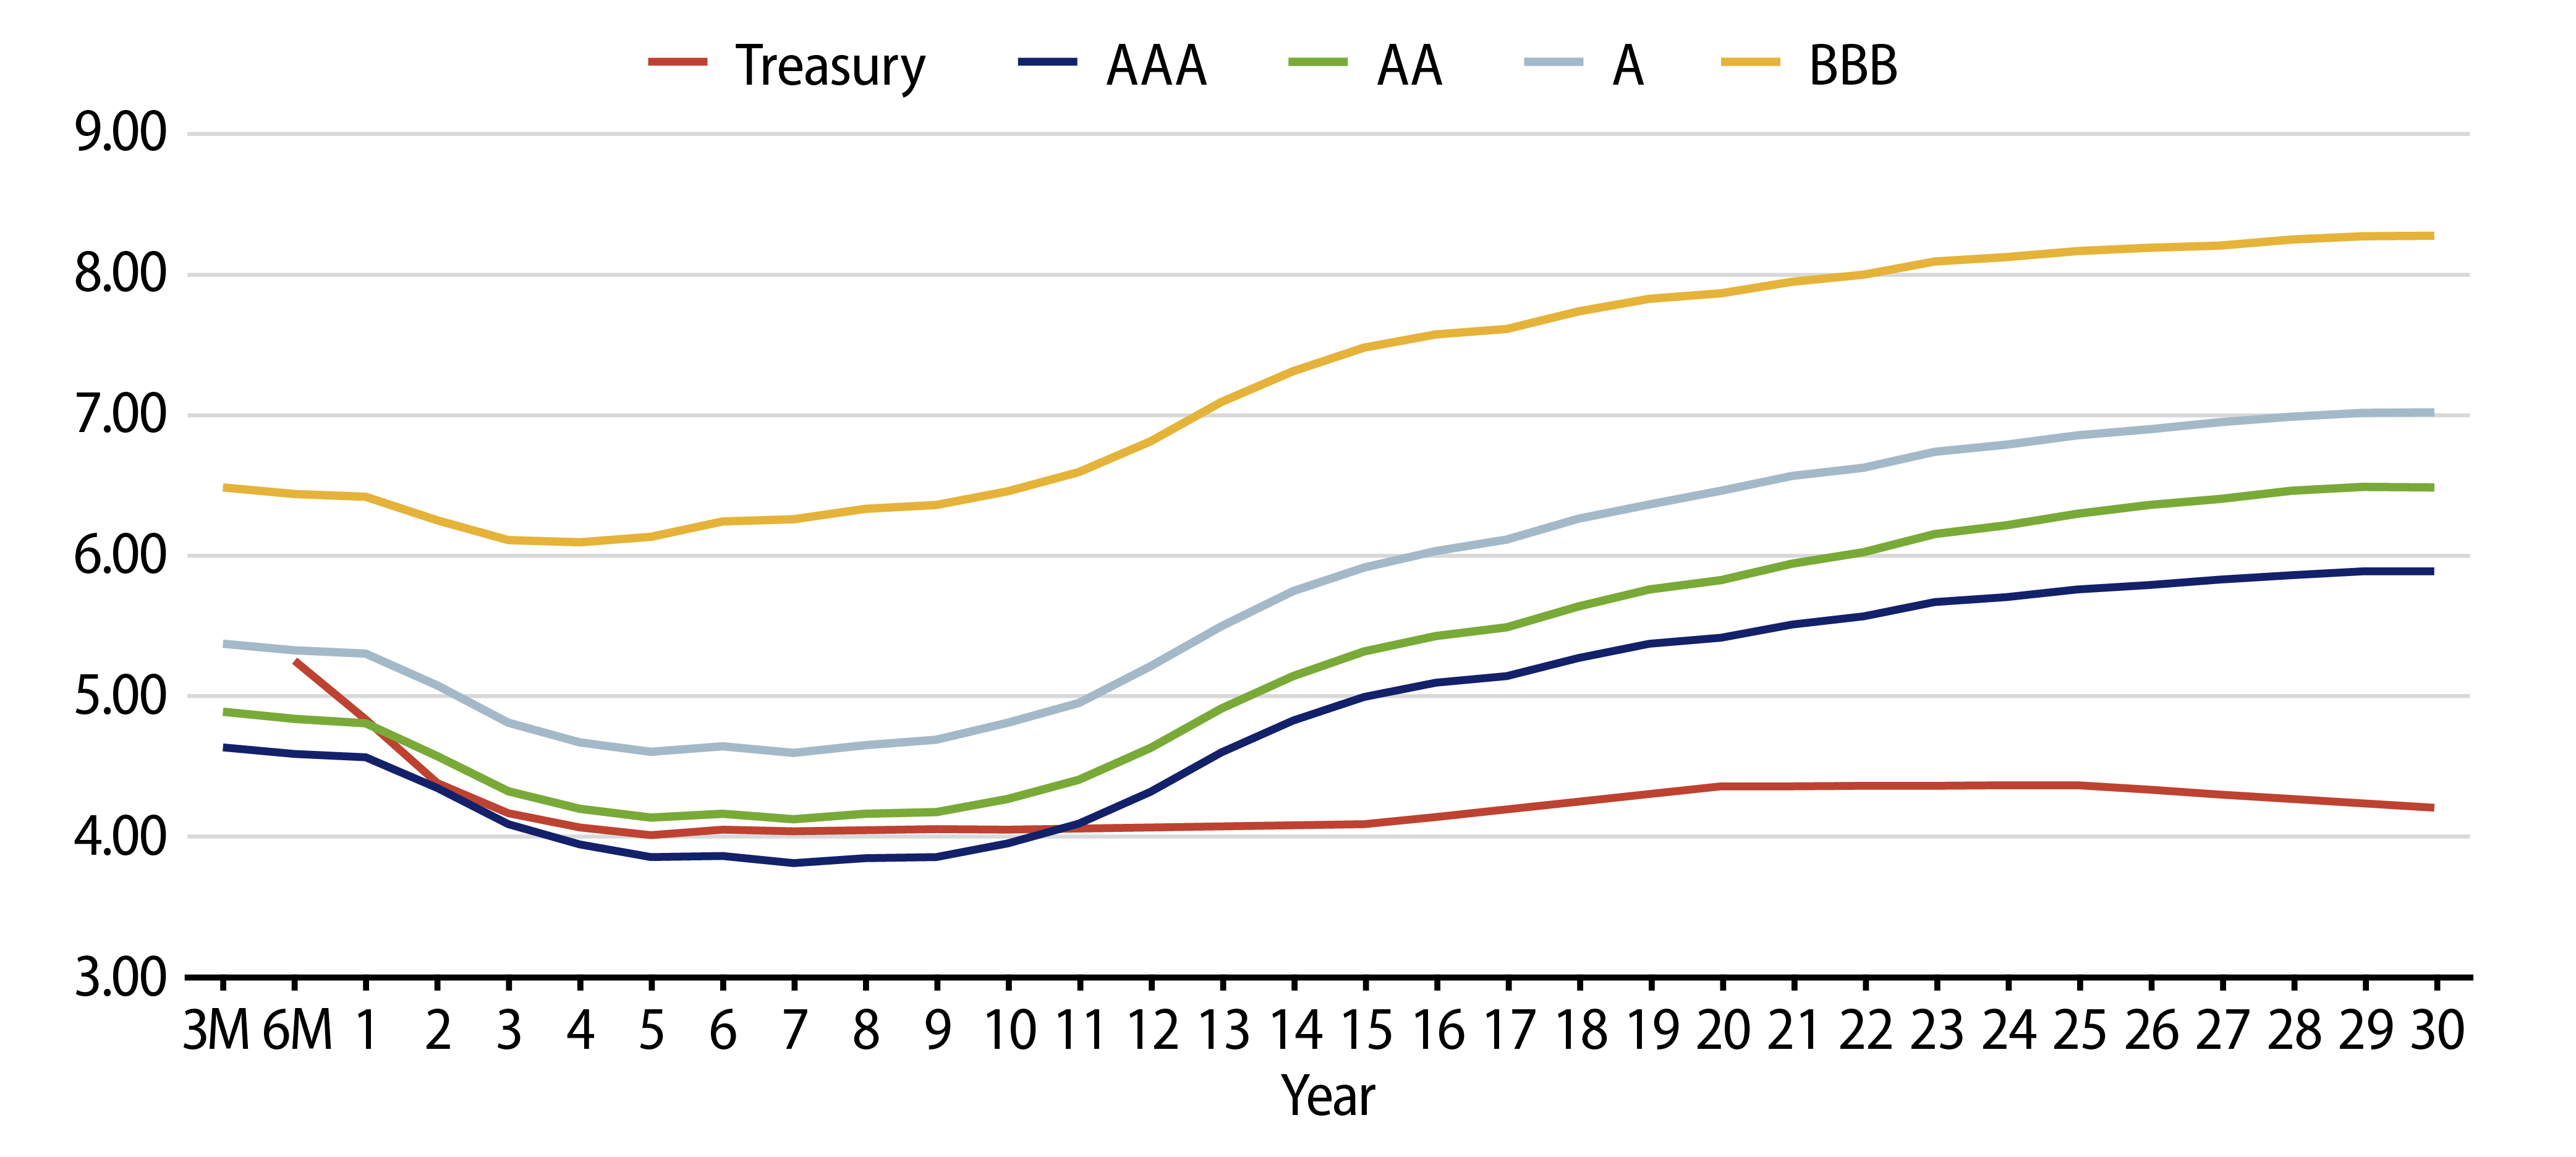
Theme #2: Recent steepening of muni yield curve highlights value in moving out to longer maturities.

Exhibit 11: AAA Municipal vs. Treasury Yield Curves
AAA Municipal vs. Treasury Yield Curves
Source: Bloomberg, Western Asset. As of 15 Dec 23. Bloomberg BVAL AAA Muni Curve and US On-/Off-the-Run Sovereign Curve. Select the image to expand the view.

Theme #3: Munis offer attractive after-tax yield pickup versus long Treasuries and corporate credit.

Exhibit 12: Municipal vs. Taxable Fixed-Income Yields by Quality
Municipal vs. Taxable Fixed-Income Yields by Quality
Source: Western Asset, Bloomberg. As 05 Jan 24. Bloomberg BVAL AAA Muni Curve and US On-/Off-the-Run Sovereign Curve. After-tax yield considers top marginal tax rate of 40.8%. Select the image to expand the view.

投資一任契約および金融商品に係る投資顧問料(消費税を含む):
投資一任の場合は運用財産の額に対して、年率1.10%(税抜き1.00%)を上限とする運用手数料を、運用戦略ごとに定めております。 また、別途運用成果に応じてお支払いいただく手数料(成功報酬)を設定する場合があります。その料率は、運用成果の評価方法や固定報酬率の設定方法により変動しますので、手数料の金額や計算方法をこの書面に記載することはできません。
投資信託の場合は投資信託ごとに信託報酬が定められておりますので、目論見書または投資信託約款でご確認ください。

有価証券の売買又はデリバティブ取引の売買手数料を運用財産の中からお支払い頂きます。投資信託に投資する場合は信託報酬、管理報酬等の手数料が必要となります。これらの手数料には多様な料率が設定されているためこの書面に記載することはできません。デリバティブ取引を利用する場合、運用財産から委託証拠金その他の保証金を預託する場合がありますが、デリバティブ取引の額がそれらの額を上回る可能性があります。その額や計算方法はこの書面に記載することはできません。投資一任契約に基づき運用財産の運用を行った結果、金利、通貨の価格、金融商品市場における相場その他の指標に係る変動により、損失が生ずるおそれがあります。損失の額が、運用財産から預託された委託証拠金その他の保証金の額を上回る恐れがあります。個別交渉により、一部のお客様とより低い料率で投資一任契約を締結する場合があります。

©Western Asset Management Company Ltd 2024. 本資料の著作権は、ウエスタン・アセット・マネジメント株式会社およびその関連会社(以下「ウエスタン・アセット」という)に帰属するものであり、意図した受取人のみを対象として作成されたものです。本資料に記載の内容は、秘密情報及び専有情報としてお取り扱いください。ウエスタン・アセットの書面による事前の承諾なしに、全部又は一部を無断で複写、複製することや転載することを堅くお断りいたします。

過去の運用実績は将来の運用実績を示すものではありません。また、本資料は、将来の実績を予測または予想するものではありません。

本資料は、適格機関投資家、特定投資家、企業年金基金、公的年金等、豊富な投資経験と高度な専門知識とを備えたプロフェッショナルのお客様のみにご提供するものです。


本資料は情報の提供のみを目的としています。資料作成時点のウエスタン・アセットの見解を掲載したものであり、将来予告なしに変更する場合があります。また、リアルタイムの市場動向や運用に関する見解ではありません。

本資料で第三者のデータが使用されている場合、ウエスタン・アセットはそのデータが公表時点で正確であると信じていますが、それを保証するものではありません。ウエスタン・アセットの戦略・商品の受賞またはランキングが含まれている場合、これらは独立した第三者または業界出版物により公平な定量・定性情報に基づき決定されたものです。ウエスタン・アセットは、これらの第三者の標準的な業界サービスを利用したり、出版物を購読したりする場合がありますが、それらは、すべてのアセット・マネージャーが利用可能なものであり、ランキングや受賞に影響を与えるものではありません。

本資料に記載の戦略・商品には、元本の一部または全部の損失を含む大きなリスクが伴う場合があります。また、当該戦略や商品に投資することは大きな変動を伴なう可能性があり、投資家にはそのようなリスクを受け入れる経済力および意思を持つことが求められます。

特段の注記がない限り、本資料に記載の戦略のパフォーマンスはコンポジットのデータです。コンポジットではないその他のデータについては、当戦略の運用方針に最も近いと考えられる口座を、コンポジットの代表口座として掲載しています。つまり、代表口座は運用結果により選択されるものではありません。代表口座のポートフォリオ特性は、コンポジットやその他のコンポジット構成口座と異なる場合があります。これらの口座についての情報はご依頼に応じてご提供いたします。

本資料に記載している内容は、ウエスタン・アセットの投資家に対する投資助言ではありません。個別銘柄・発行体に関する一般的または具体的に言及する内容は、例としてご提示したものであり、購入または売却を推奨するものでもありません。また、ウエスタン・アセットの役職員及びお客様は、本資料に記載の有価証券を保有している可能性があります。 本資料は、会計、法務、税務、投資またはその他の助言の提供を意図したものではなく、またそれらに依存すべきではありません。お客様は、ウエスタン・アセットが提供する戦略・商品への投資を行うにあたり、経済的リスクやメリットなどについて助言が必要である場合は、ご自身の弁護士、会計士、投資家、税理士、その他のアドバイザーに相談して下さい。お客様は、居住国で適用される法令を遵守する責任を負います。

ウエスタン・アセットは世界有数の運用専門会社です。1971年の設立以来、債券運用に特化したアクティブ運用機関として最大規模の運用資産と運用チームを有しています。拠点は米国カリフォルニア州パサデナ、ニューヨーク、英国ロンドン、シンガポール、東京、豪メルボルン、ブラジル・サンパウロ、香港、スイス・チューリッヒにあり、フランクリン・リソーシズIncの完全子会社ですが、経営全般に独立性を保っており、次の6法人で構成されています。米国:ウエスタン・アセット・マネジメント・カンパニーLLC(米証券取引委員会(SEC)登録の投資顧問会社)。ブラジル・サンパウロ:ウエスタン・アセット・マネジメント・カンパニーDTVM Limitada(ブラジル証券取引委員会とブラジル中央銀行が認可・規制)。メルボルン:ウエスタン・アセット・マネジメント・カンパニーPty Ltd(事業者番号ABN 41 117 767 923、AFSライセンス303160)。シンガポール:ウエスタン・アセット・マネジメント・カンパニーPte. Ltd.(CMSライセンスCo. Reg. No. 200007692R、シンガポール通貨監督庁が監督)。日本:ウエスタン・アセット・マネジメント株式会社(金融商品取引業者、金融庁が規制)。英国:ウエスタン・アセット・マネジメント・カンパニーLimited(英金融行動監視機構(FCA)が認可(FRN145930)、規制)。本資料は英国ではFCAが定義する「プロフェッショナルな顧客」のみを対象とした宣伝目的に使用されます。許可された欧州経済領域 (EEA)加盟国へ配信する場合もあります。最新の承認済みEEA加盟国のリストは、ウエスタン・アセット(電話:+44 (0)20 7422 3000)までお問い合わせください。

詳細は当社ウエブサイトwww.westernasset.co.jpをご参照ください。
ウエスタン・アセット・マネジメント株式会社について
業務の種類: 金融商品取引業者(投資運用業、投資助言・代理業、第二種金融商品取引業)
登録番号: 関東財務局長(金商)第427号
加入協会: 一般社団法人日本投資顧問業協会(会員番号 011-01319)
一般社団法人投資信託協会