Macros, Markets and Munis
Munis posted positive returns to start the year as yields moved lower in line with Treasuries, generally outperforming fixed-income amid light supply conditions. Fixed-income yields also moved lower last week during a quiet holiday period and light economic calendar. This week we provide a comprehensive 2024 municipal market review.
This Week in Munis: Year in Review
Fixed-income markets were volatile in 2024 as market participants contended with inflation continuing a downward (albeit uneven) trend, the start of the Federal Reserve’s (Fed) telegraphed cutting cycle and Presidential election implications. Treasury yields trended higher through the first half of 2024 before moving sharply lower in the third quarter as markets coalesced around the Fed’s commitment to cut interest rates. That third-quarter strength quickly reversed following the Presidential election, as markets looked forward to the potential for pro-growth policies that could lead to longer-term rates remaining higher for longer. All told, front-end Treasury yields moved over 100 basis points (bps) lower, while maturities beyond five years moved up to 84 bps higher.
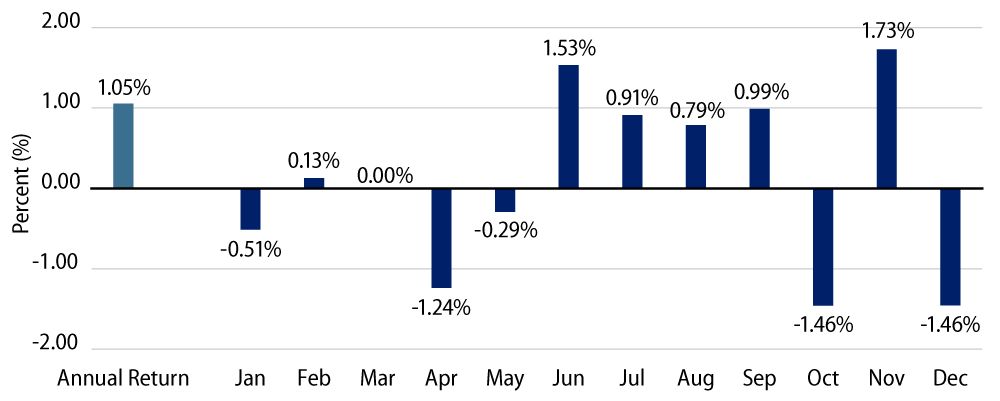
High-grade municipal yields moved higher across the curve in 2024. The Bloomberg Municipal Bond Index returned 1.05%, while Treasury and Corporate indices returned 0.58% and 2.13%, respectively. Within municipal cohorts, the highest-grade AAA index underperformed, posting a total return of 0.33%, while lower-grade A, BBB and High Yield indices outperformed by posting returns of 1.78%, 2.87% and 6.32%, respectively, as credit spreads tightened. Returns across the curve were more mixed, with the shortest maturities (<6 years) and maturities beyond 17 years outperforming the broader market.
Soft Supply and Demand Technicals Were Driven by Record New-Issue Supply
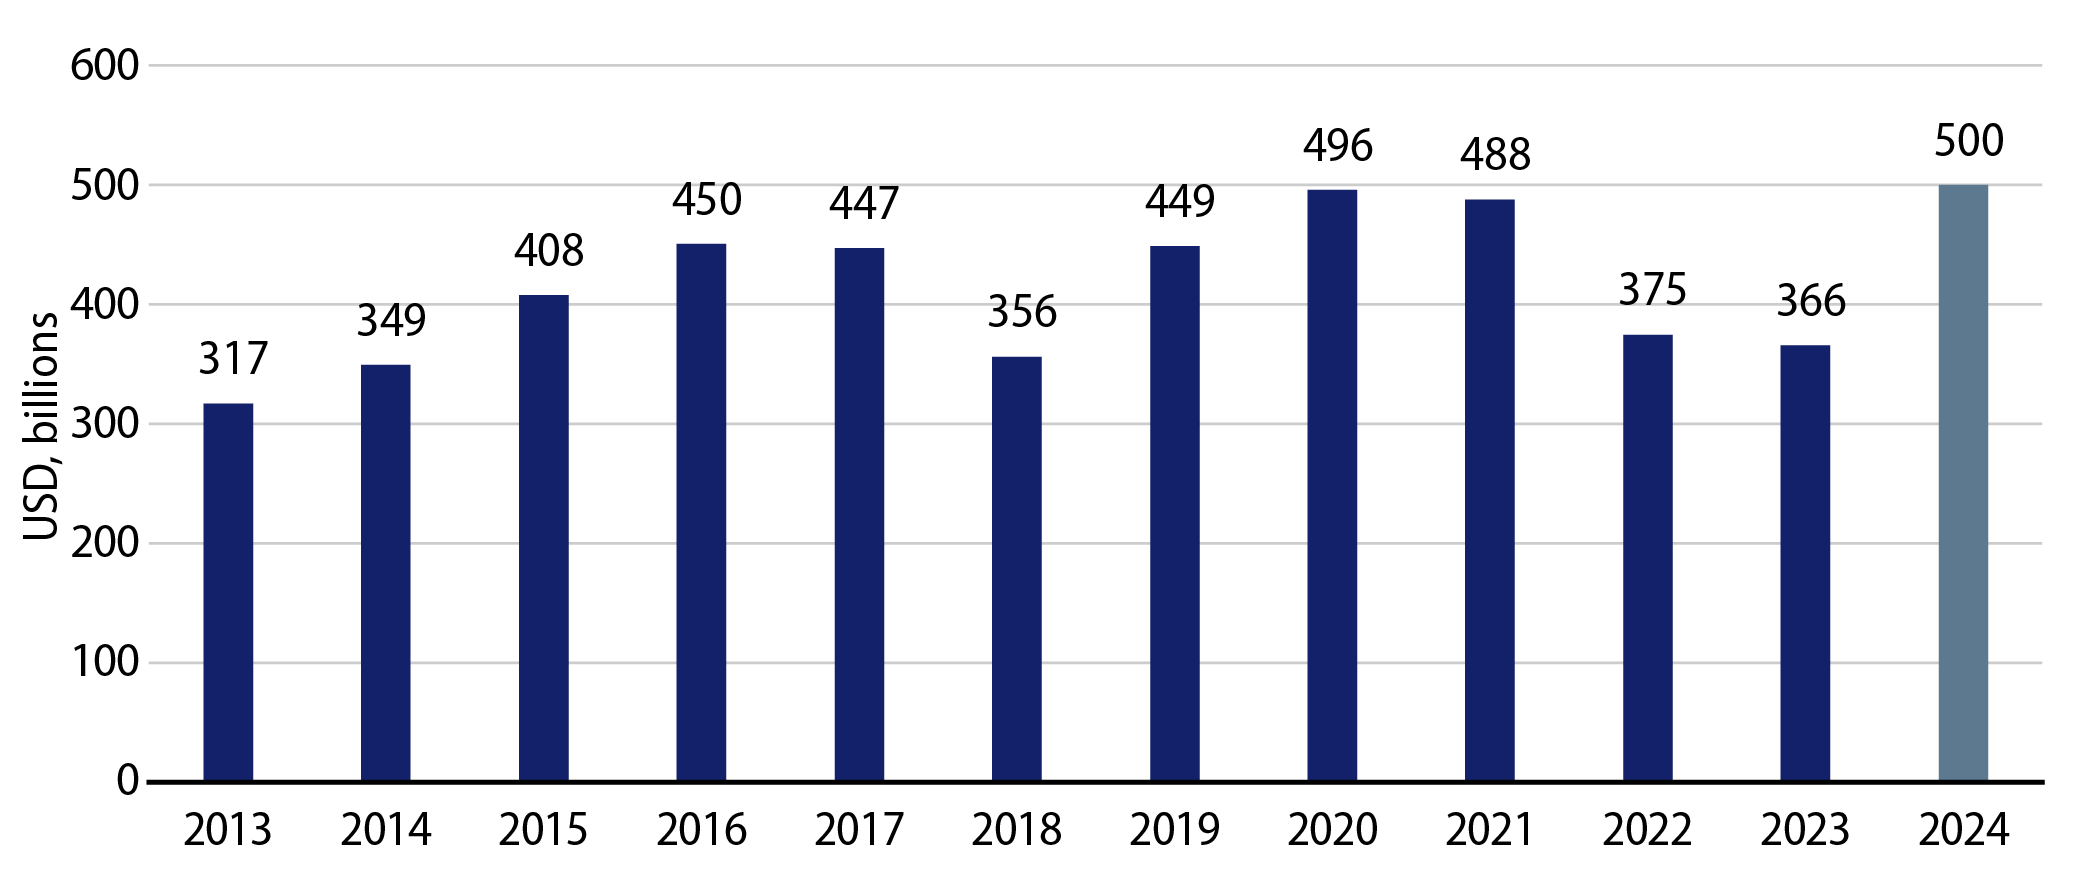
Relative municipal underperformance versus taxable fixed-income was driven, in part, by record supply conditions. Total municipal supply in 2024 reached $500 billion, 36% above 2023 levels and 24% above the prior 10-year average. Tax-exempt supply of $460 billion comprised 92% of total issuance and was 40% higher year-over-year (YoY) while taxable supply of $40 billion was just 6% higher than levels seen in prior years. This was still below recent averages as issuers sought better value in tax-exempt markets in the higher rate environment.
Higher tax-exempt income opportunities supported demand in 2024. Municipal mutual funds recorded $47 billion of net inflows during the year, partially reversing the greater than $120 billion of outflows observed over the prior two years. Long-term and high-yield fund categories recorded the most net inflows. Beyond municipal funds, individual separately managed account (SMA) allocations continued to grow, while bank and insurance company demand declined amid lower corporate tax rates.
State and Local Credit Remained Resilient
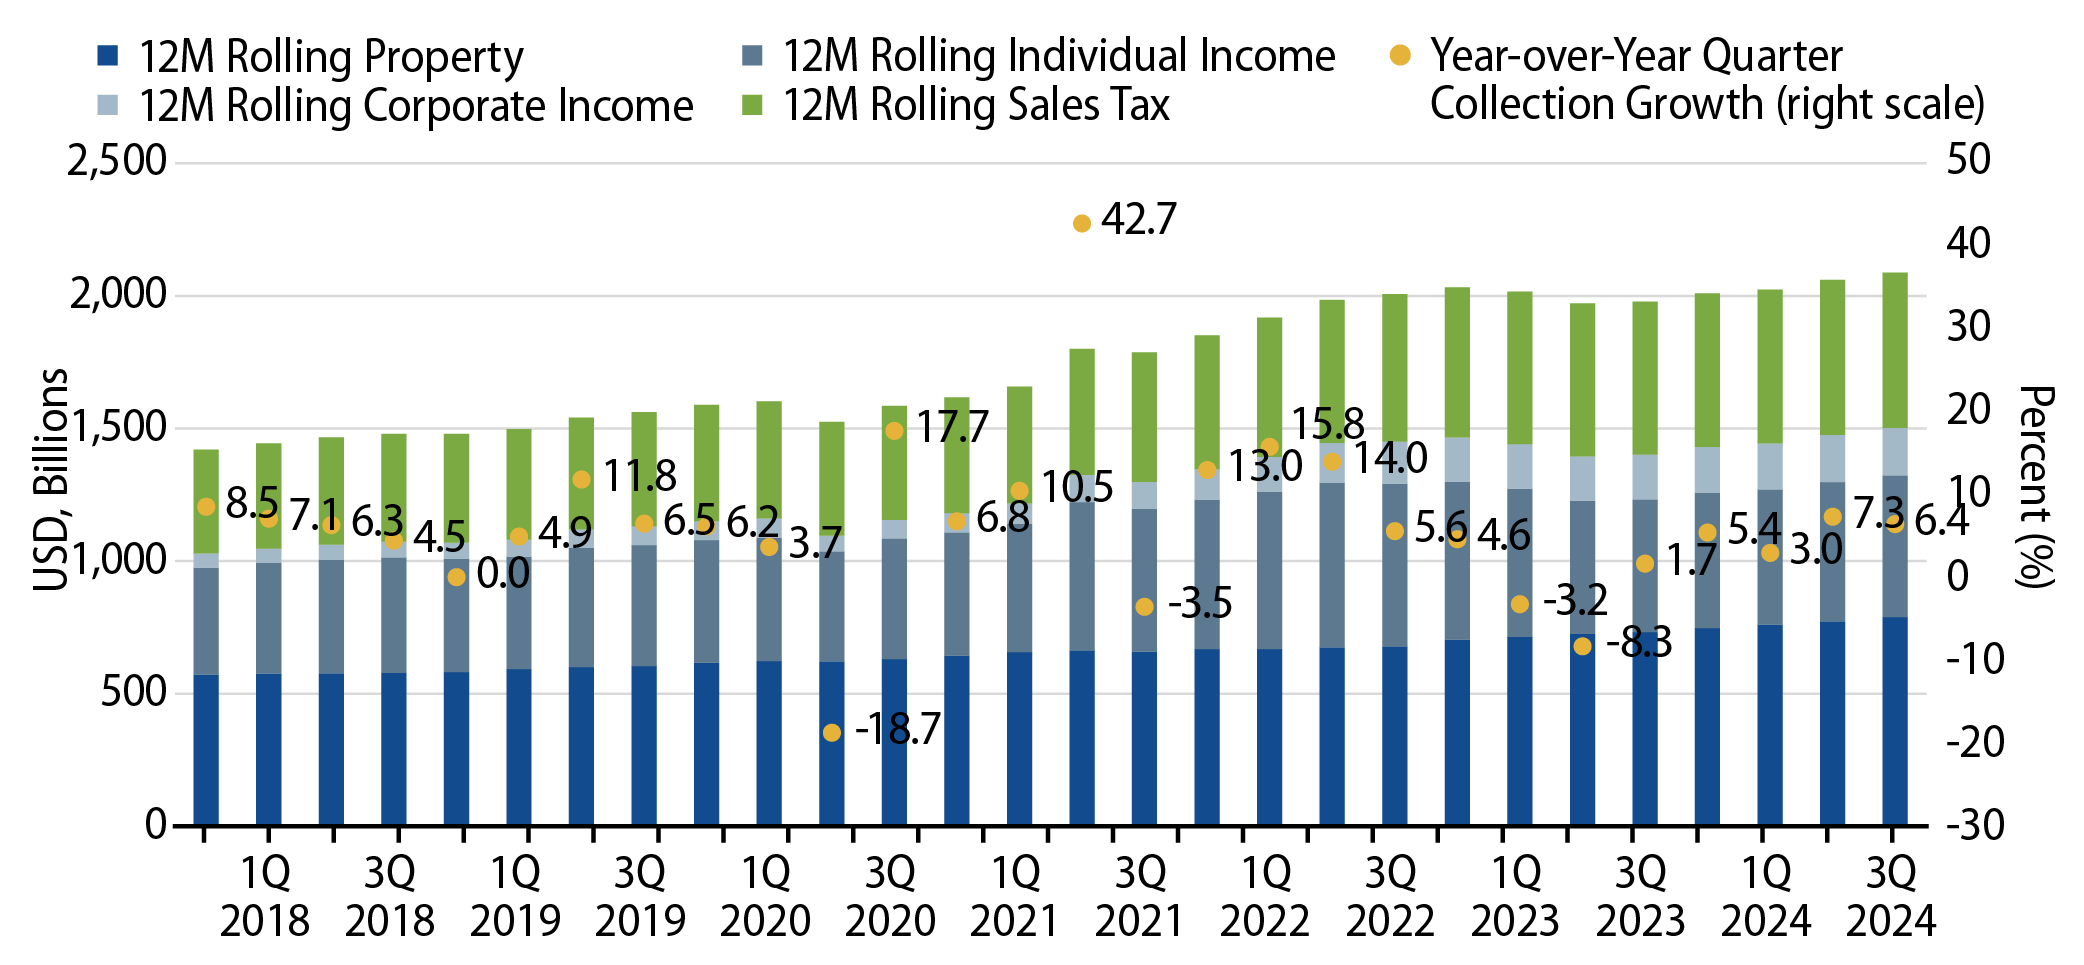
Municipal credit conditions remained well supported by elevated tax collections. Through the third quarter of 2024, 12-month trailing tax collections increased 6.4% YoY to $2.1 trillion, marking a record-high level, according to the Census data. On a 12-month trailing basis, individual income tax collections increased 6.6% YoY, corporate income tax collections increased 6.7% YoY and sales tax collections increased 1.5% YoY. 12-month rolling property tax collections, the primary source of revenue for local municipalities, also recorded a strong trend higher, growing 7.7% YoY.
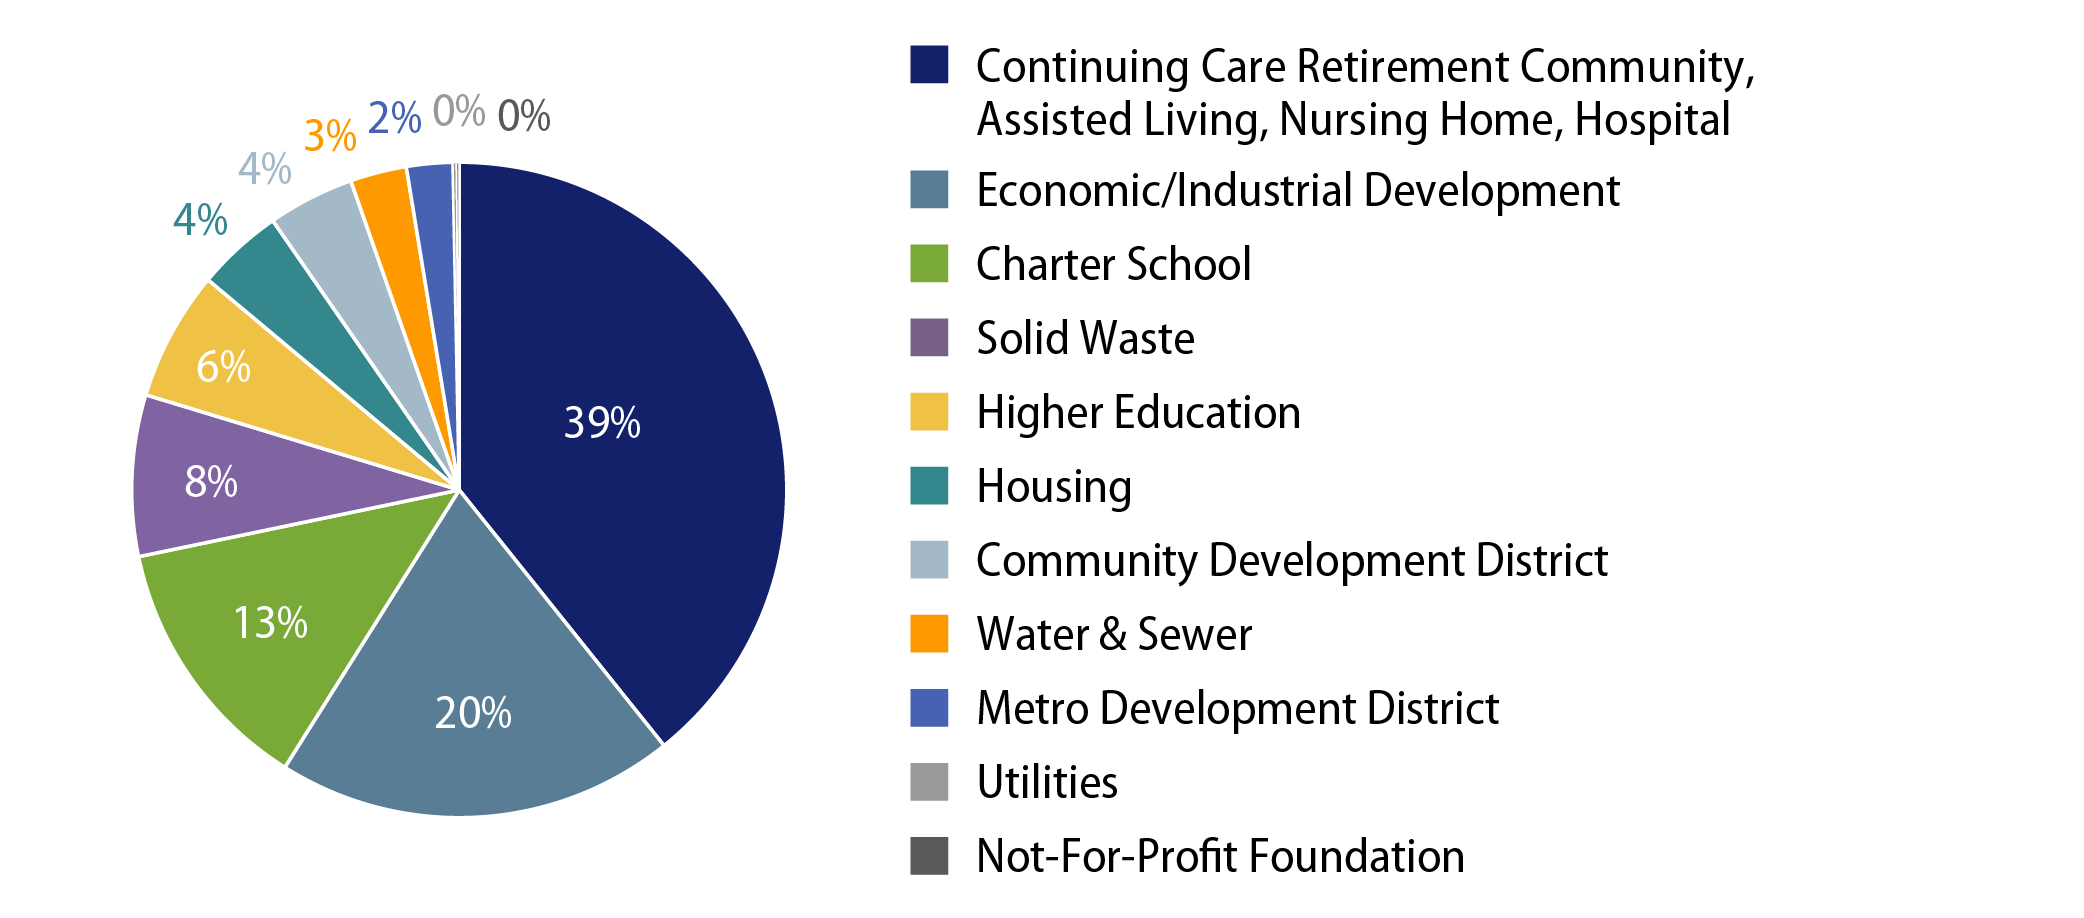
Favorable revenue collections supported positive rating actions as upgrades surpassed downgrades throughout the year. According to Bloomberg data through December 17, $379 billion of muni debt was upgraded while $102 billion of debt was downgraded. From a default perspective, municipal defaults remained limited and contained to select high-yield segments. The municipal market recorded 55 first-time payment defaults, up from 53 defaults the prior year, but in line with the total amount of par amount defaulted. Defaults continued to be led by the continuing care retirement community category and other health care segments. Notably, charter school defaults increased to $244 million in 2024, up from $48 million the prior year.
Valuations: Municipals Close the Year with Improved Income Opportunities, Relative Value
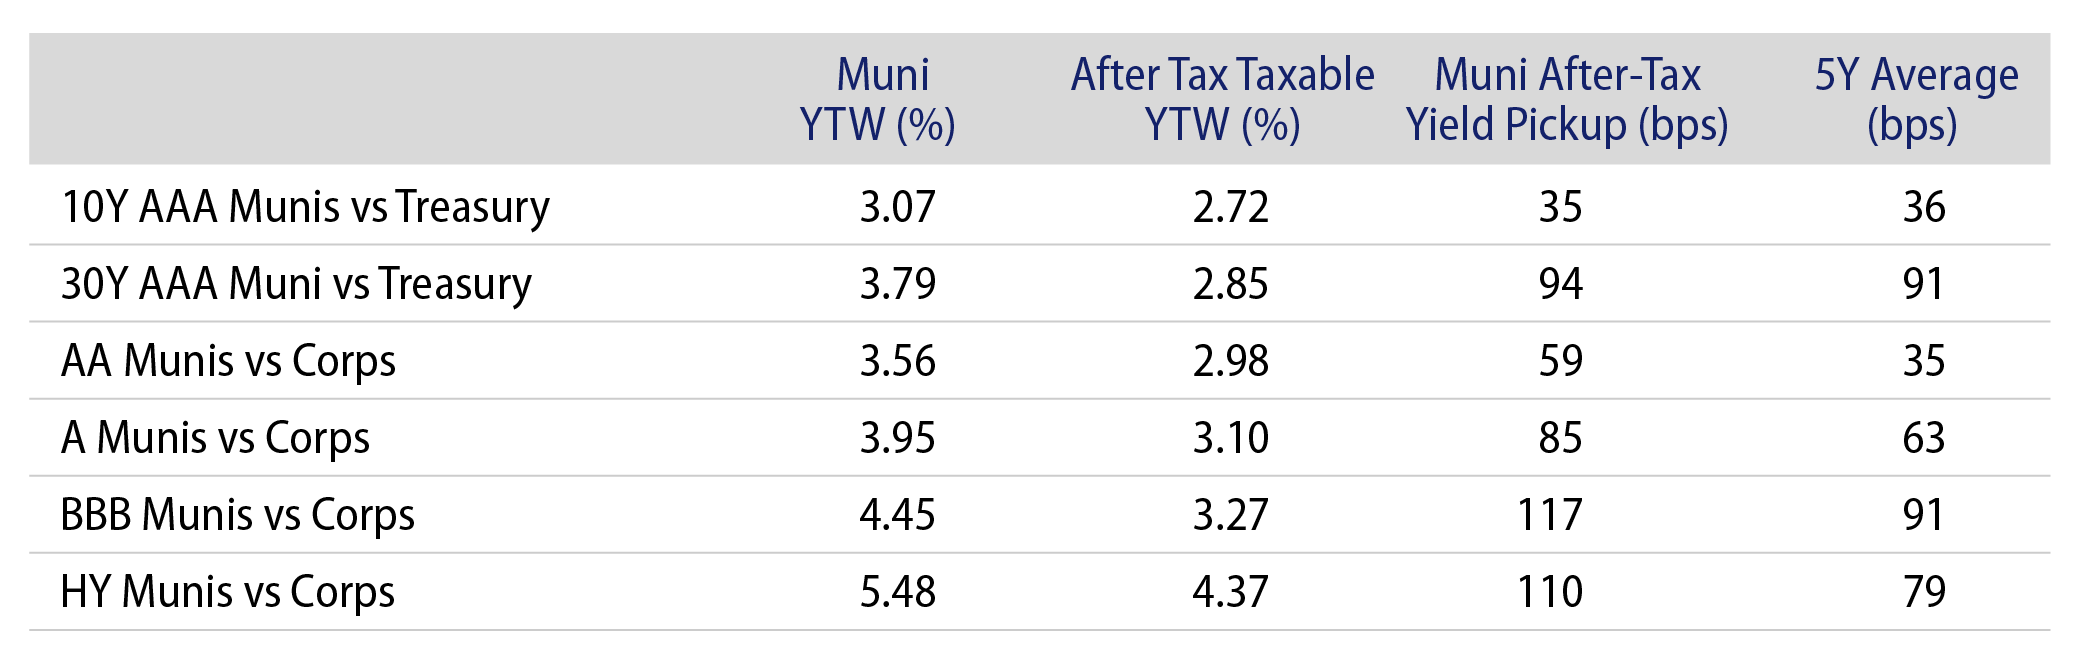
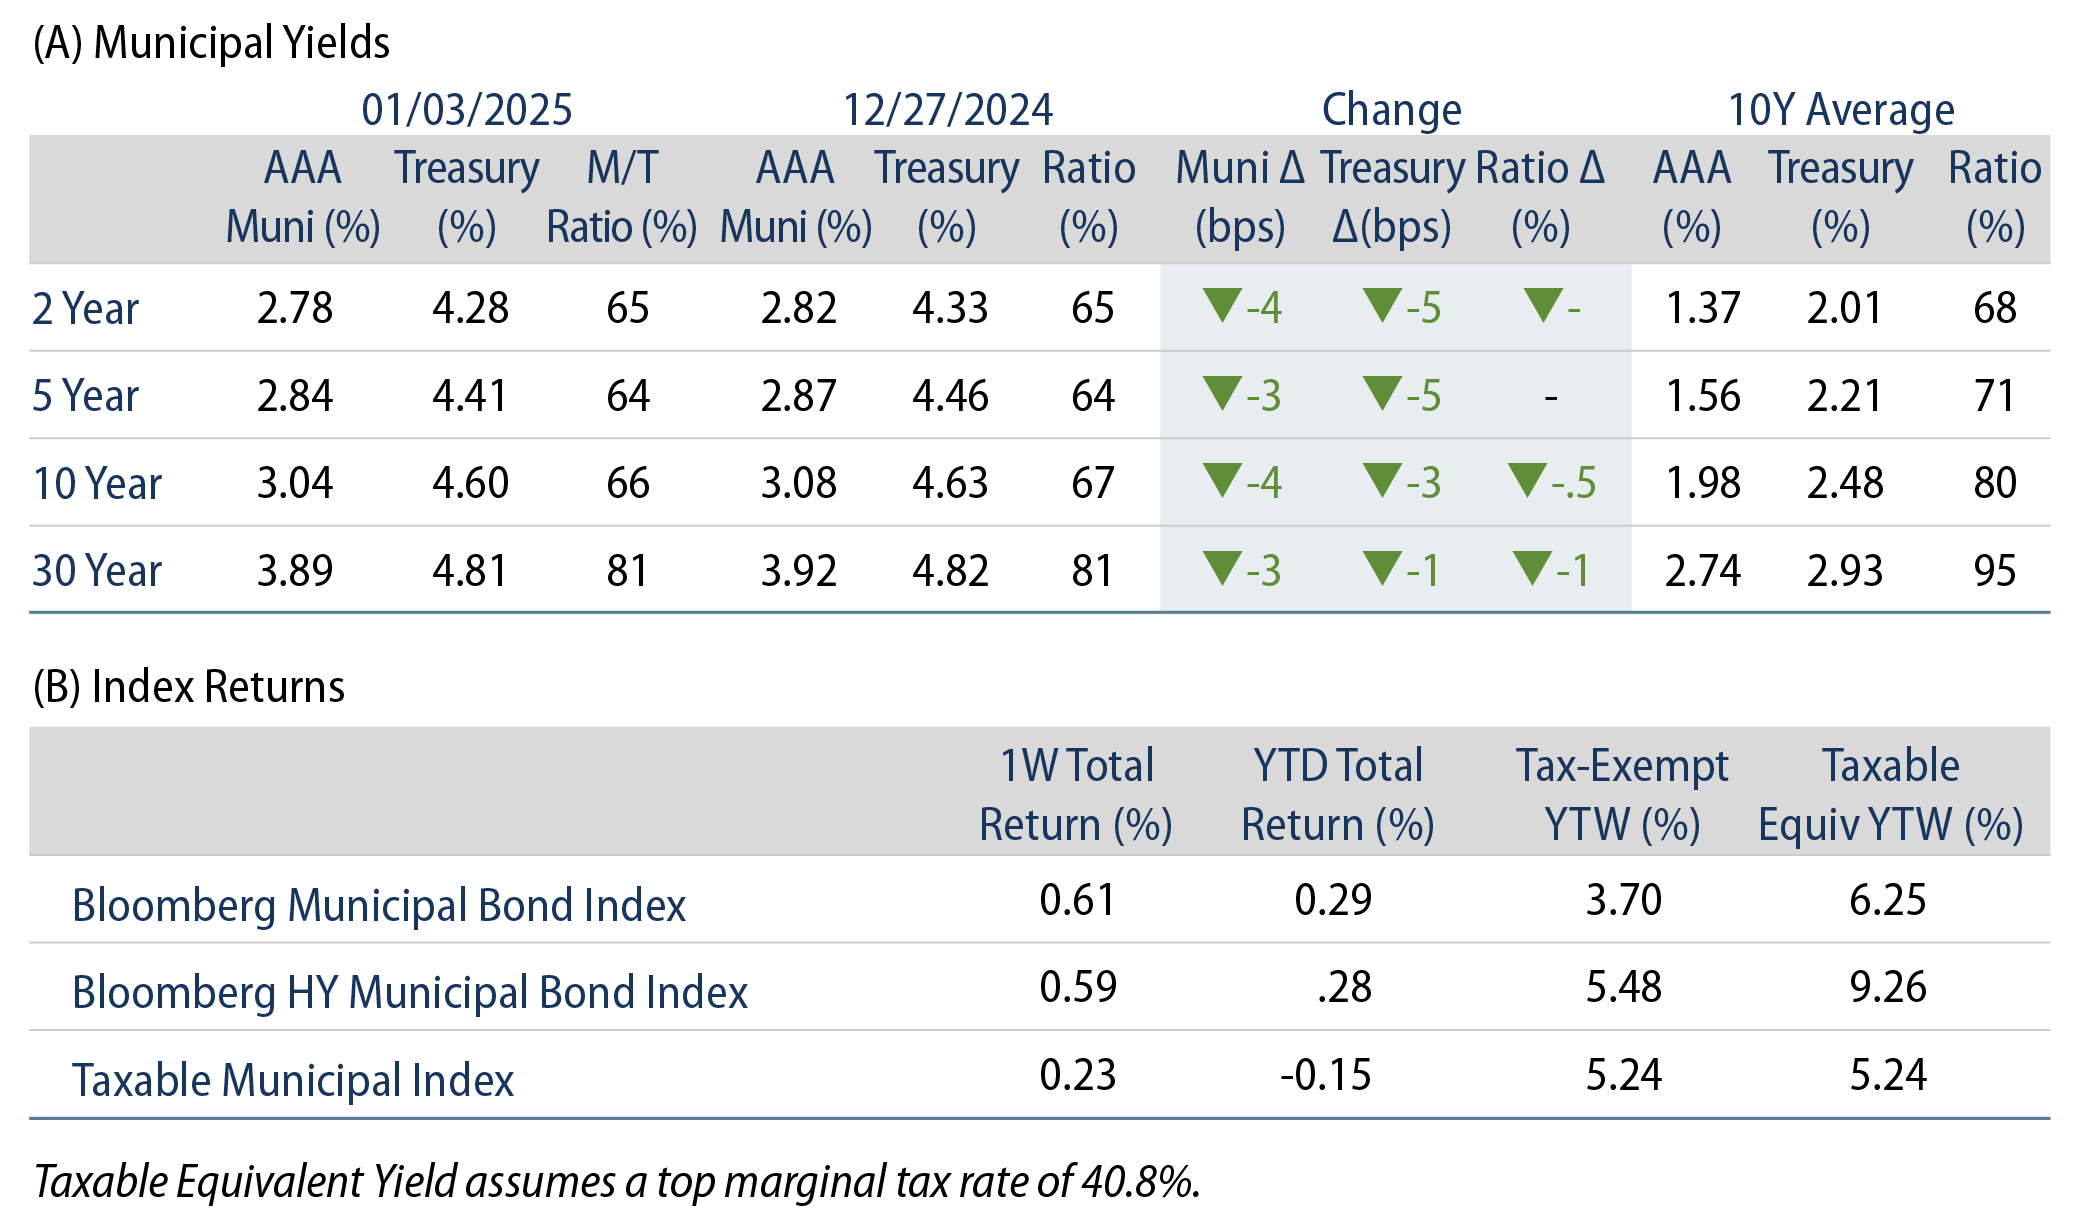
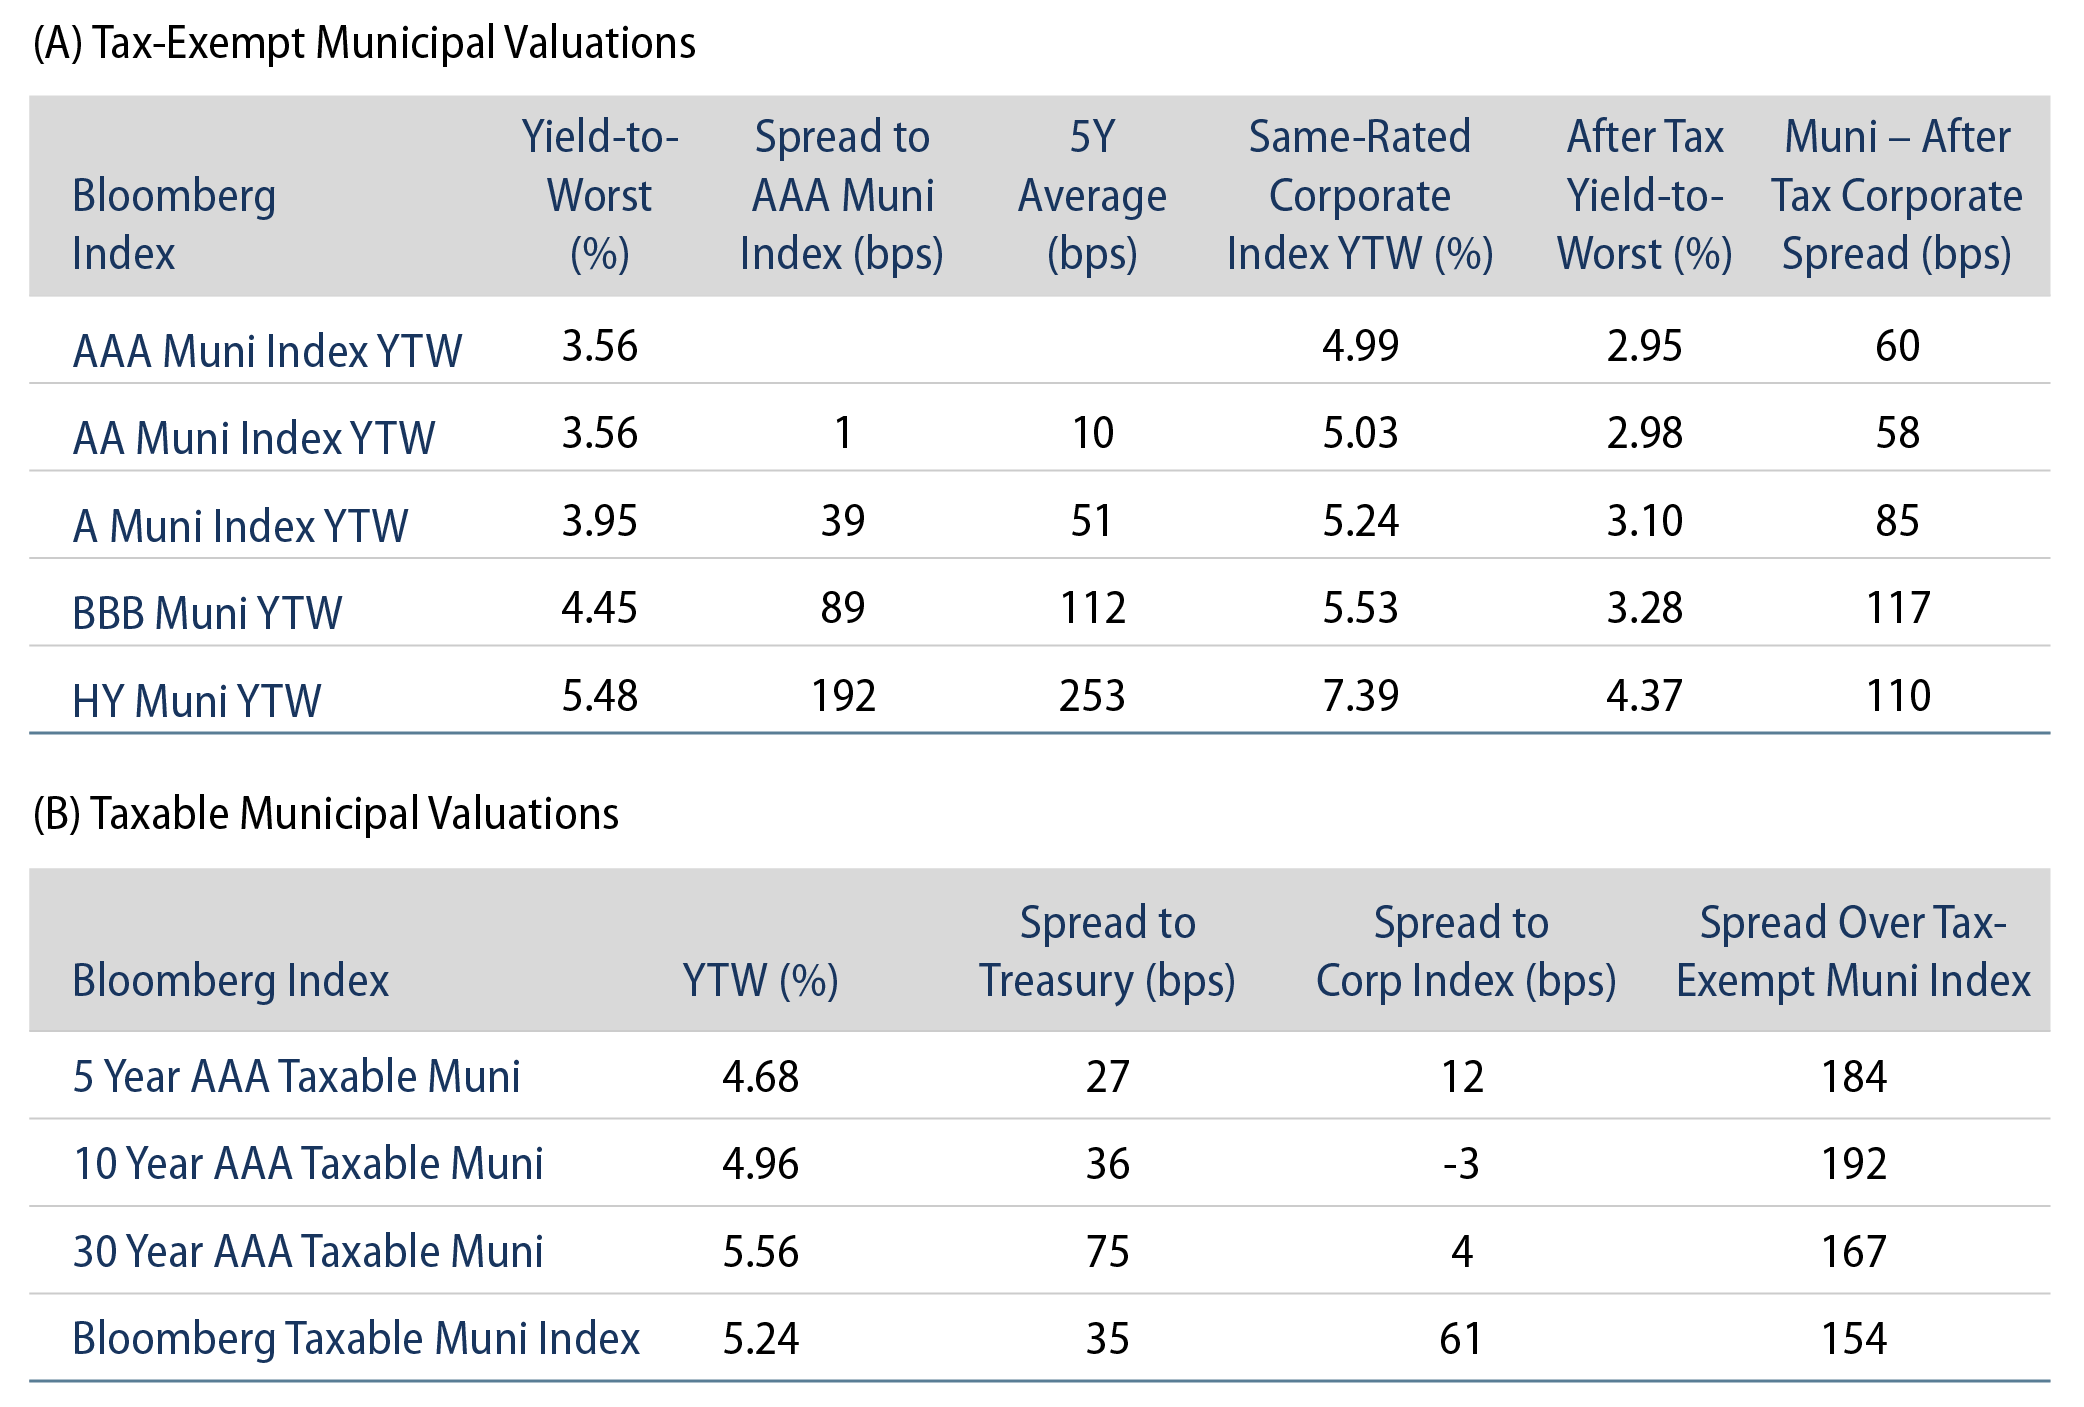
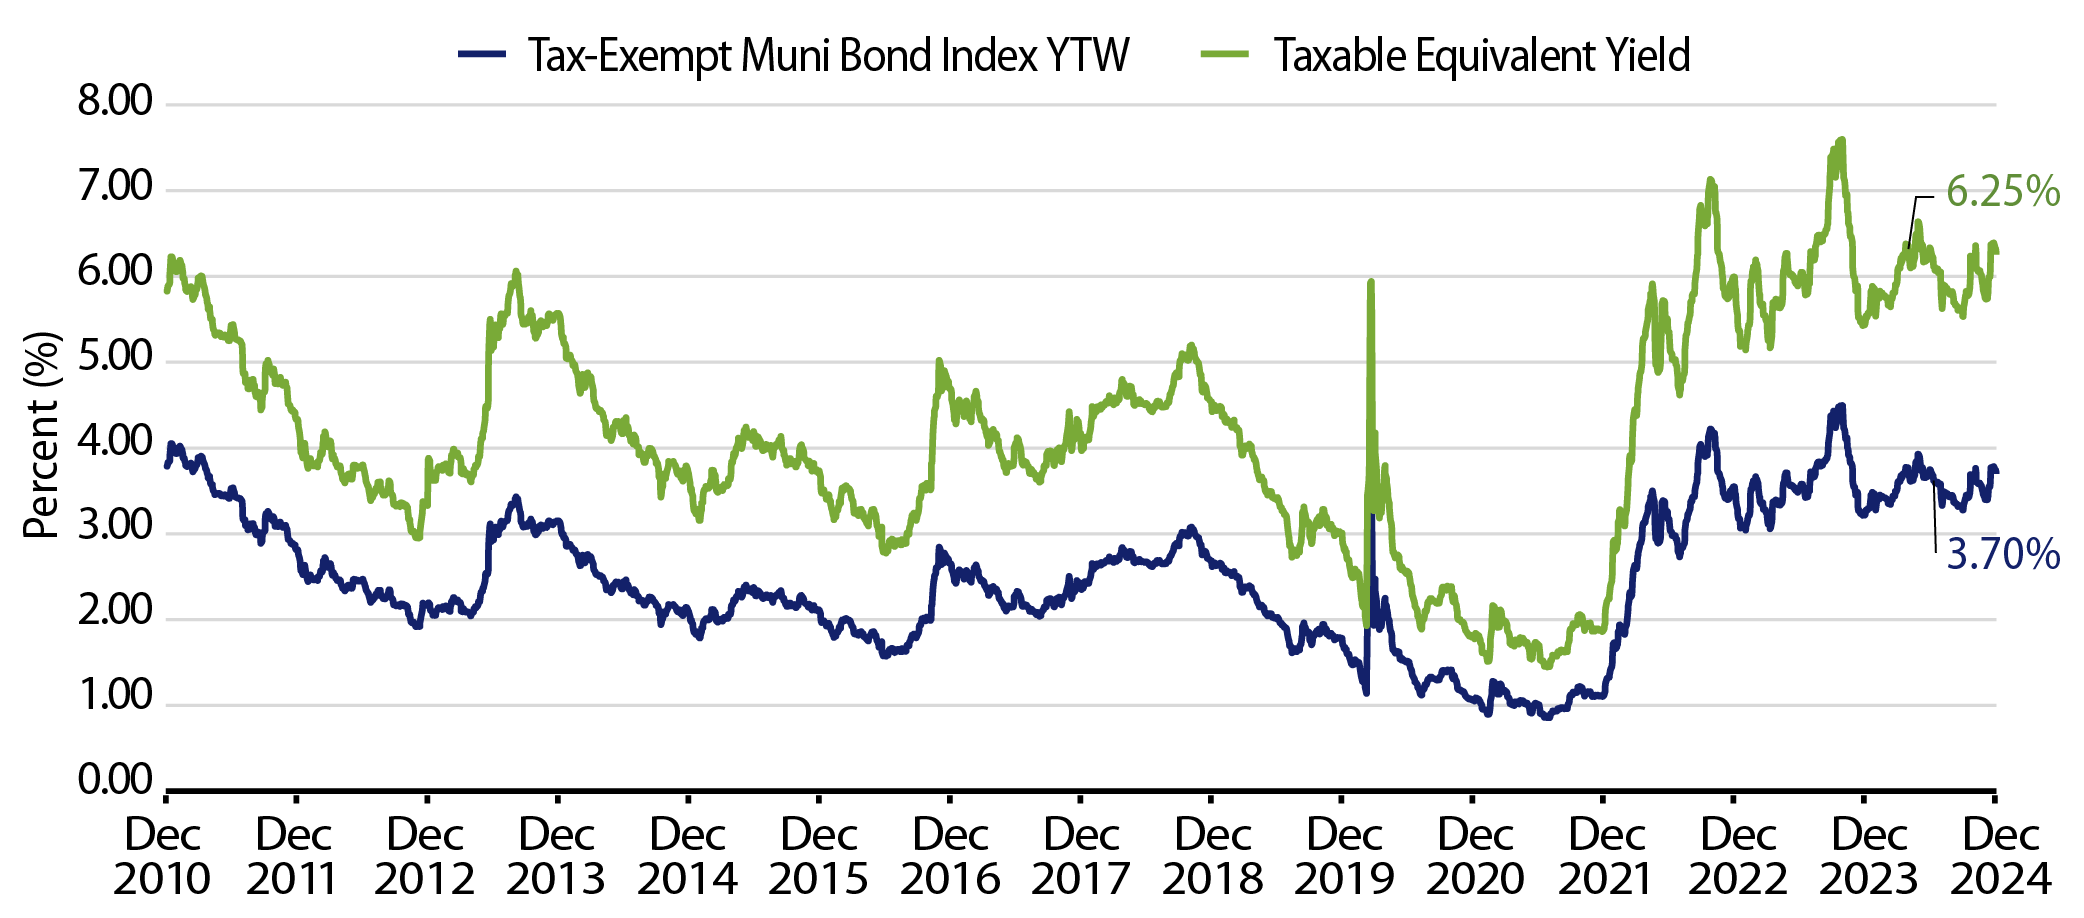
Elevated rate volatility and record municipal supply has contributed to higher tax-exempt income opportunities and relative value versus other fixed-income asset classes. In 2024, the average Bloomberg Municipal Bond Index tax-exempt yield-to-worst (YTW) increased over 52 bps to 3.74%, or 6.32% on a taxable-equivalent basis. Compared to Treasuries and investment-grade fixed-income, the after-tax relative yield pick-up remains above five-year averages. As the Fed is expected to continue its rate-cutting cycle into 2025, we anticipate the municipal investor base will expand as investors seek higher after-tax income opportunities as front-end, cash-equivalent rates move lower.
Municipal Credit Curves and Relative Value
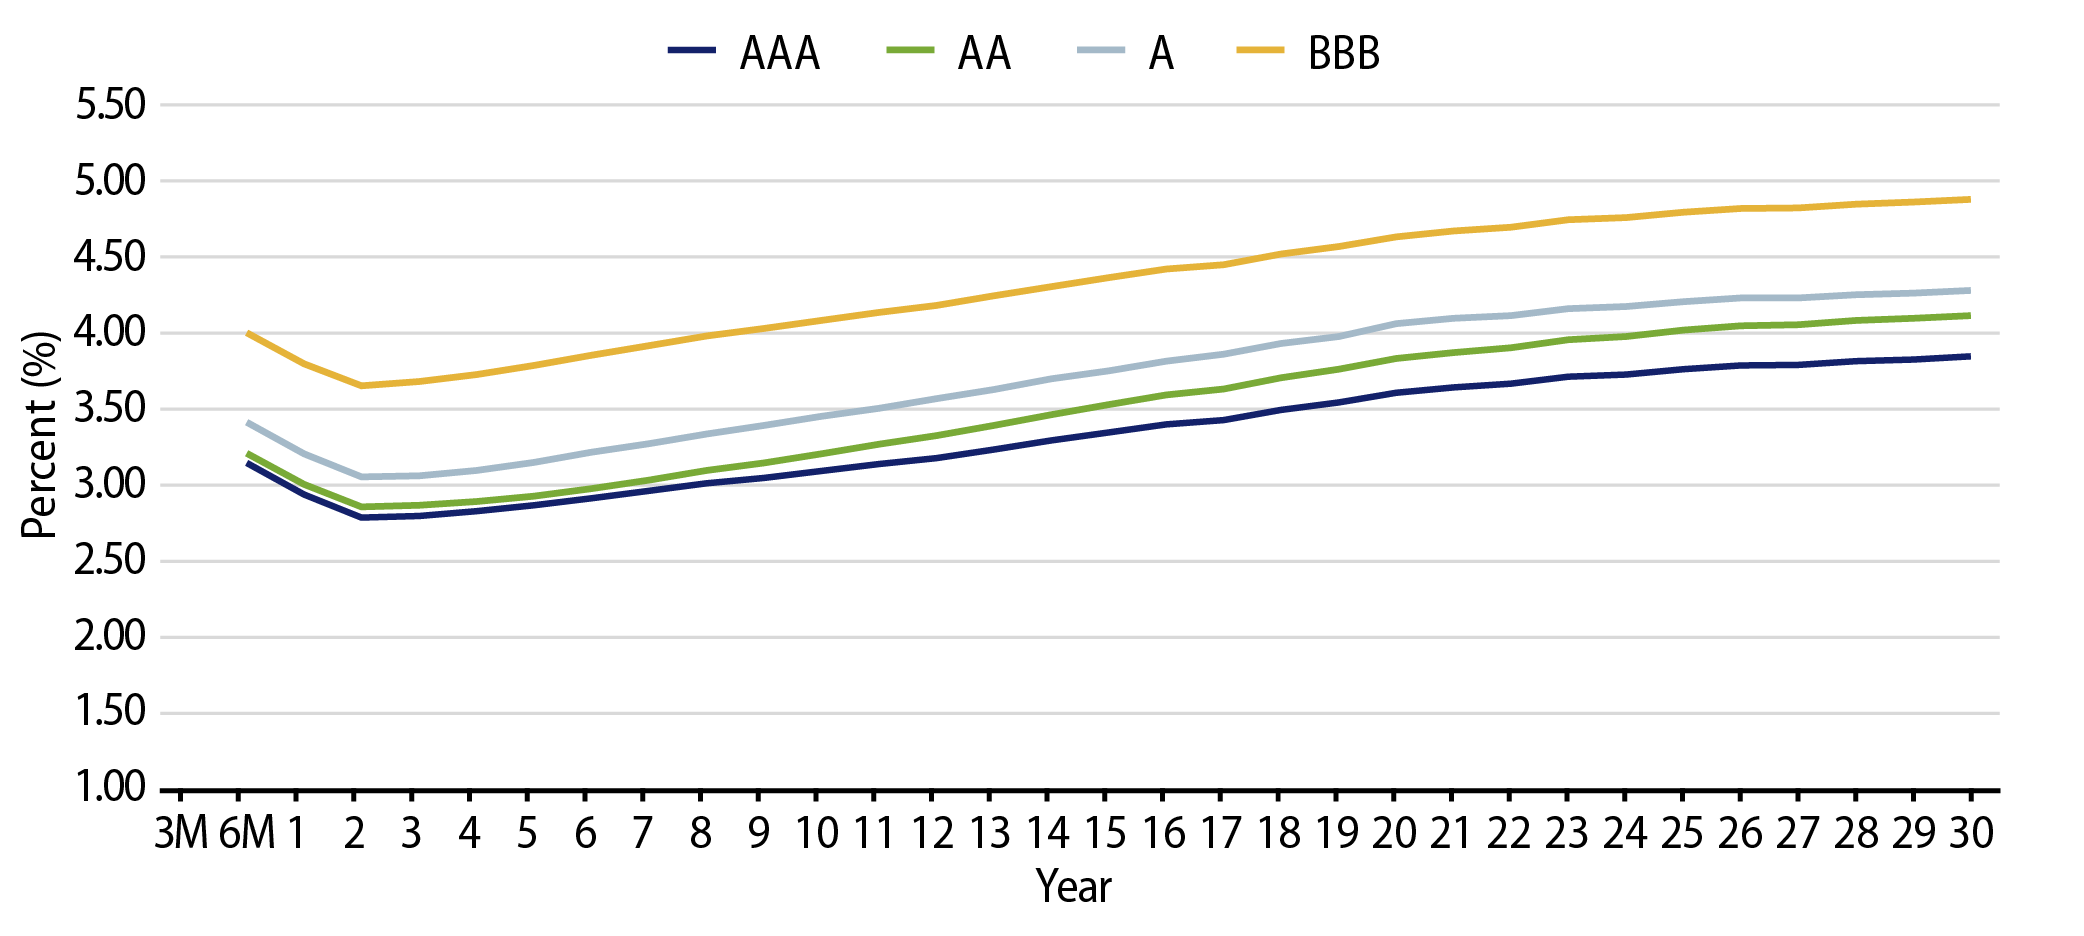
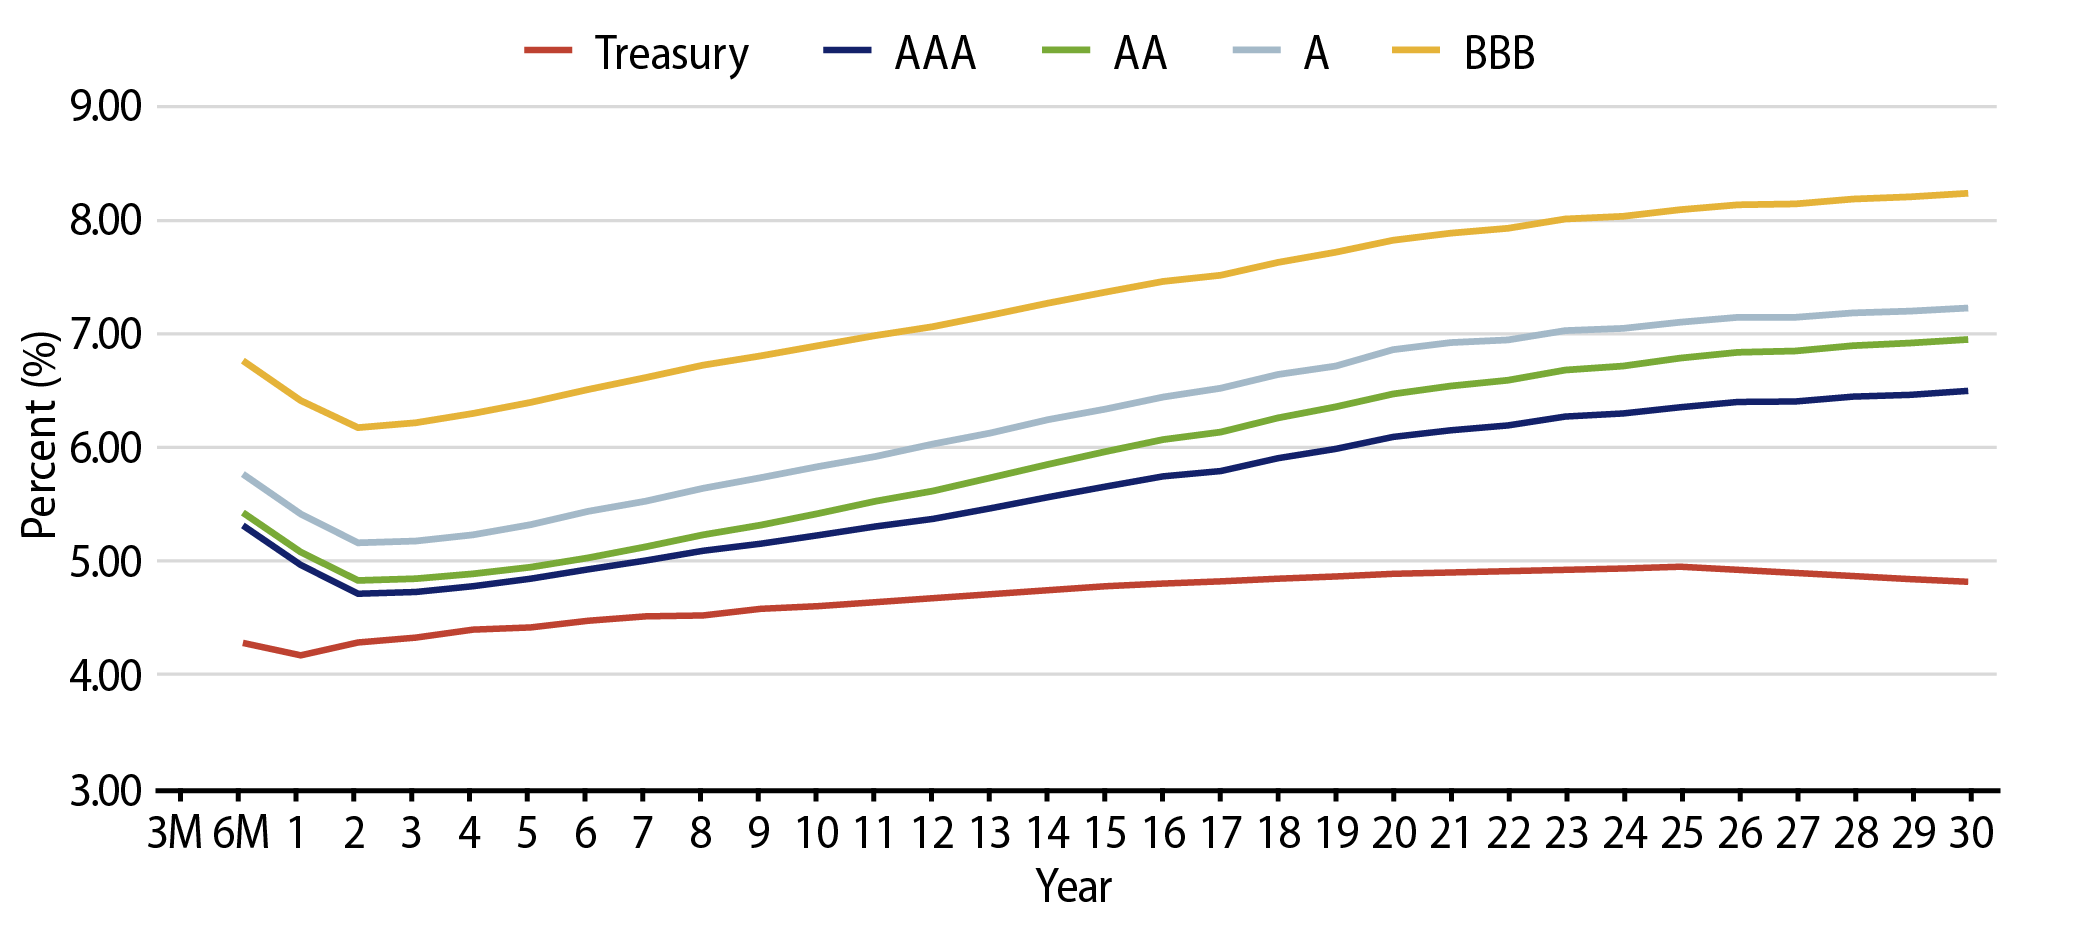
Theme #1: Municipal taxable-equivalent yields remain above decade averages.
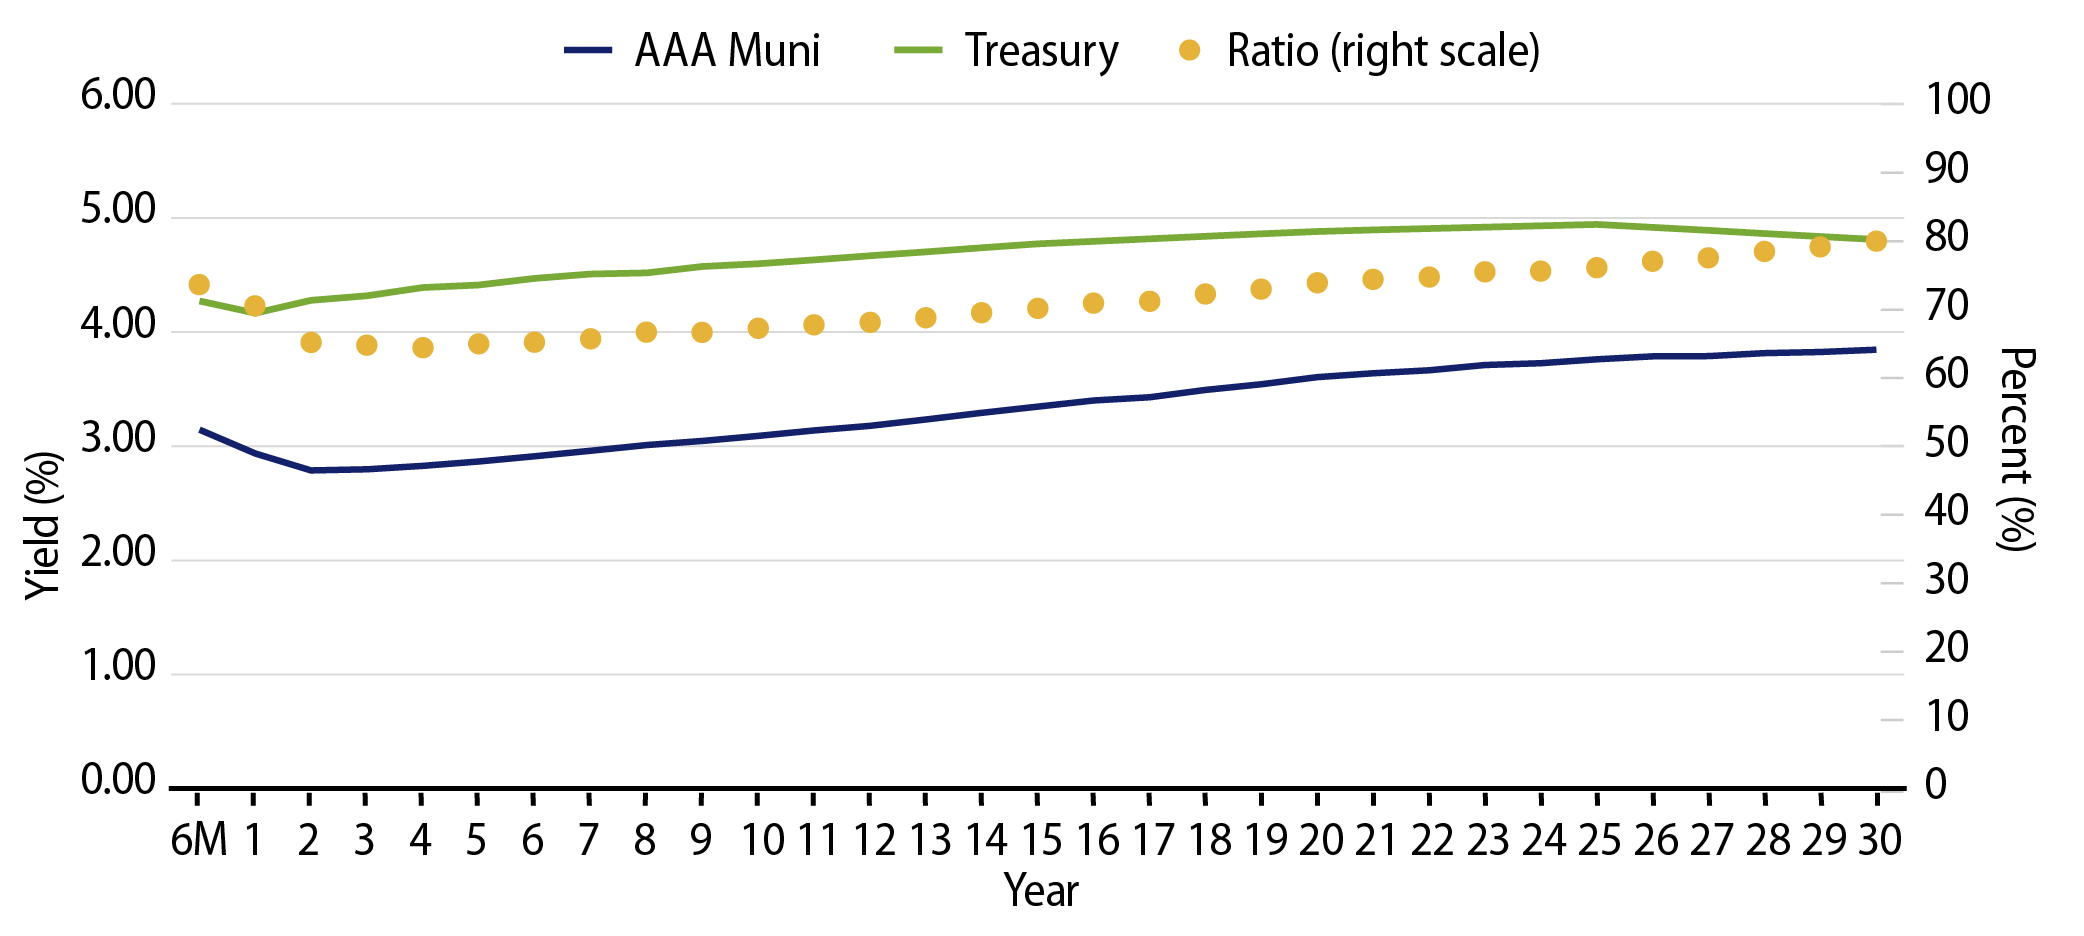
Theme #2: A slight inversion in short maturities underscores the potential value in longer maturities.
Theme #3: Munis offer attractive after-tax yield pickup versus longer-dated Treasuries and investment-grade corporate credit.