Macros, Markets and Munis
Munis posted positive returns last week as Treasuries rallied, moving 19-25 basis points (bps) lower across the yield curve. Muni yields then moved lower with Treasuries last week and underperformed amid elevated supply conditions. Fixed-income yields rose amid a broader risk-off sentiment in equities surrounding growth concerns, coinciding with generally weaker economic data. Weaker manufacturing data in particular led the week, followed by January Personal Consumption Expenditures (PCE) price index inflation readings, which declined from prior-month levels to 2.5% year-over-year (YoY). Meanwhile, muni supply and demand trends remained elevated. As the short-term muni rate declined nearly 1% last week, this week we highlight the year-to-date (YTD) disinversion of the muni yield curve.
Supply and Demand Remain Positive
Fund Flows (up $785 million): During the week ending February 26, weekly reporting municipal mutual funds recorded $785 million of net inflows, according to Lipper. Long-term funds recorded $696 million of inflows, intermediate funds recorded $52 million of outflows and high-yield funds recorded $42 million of inflows. Last week’s inflows marked a sixth consecutive week of inflows and led YTD inflows higher to $8 billion.
Supply (YTD supply of $77 billion; up 41% YoY): The muni market recorded $10 billion of new-issue supply last week, up 15% from the prior week. YTD, the muni market has recorded $77 billion of new issuance, up 41% YoY. This week’s calendar is expected to increase to $14 billion. The largest deals include $1.5 billion State of New York and $1.2 billion University of California transactions.
This Week in Munis: Yield Curve Reverts
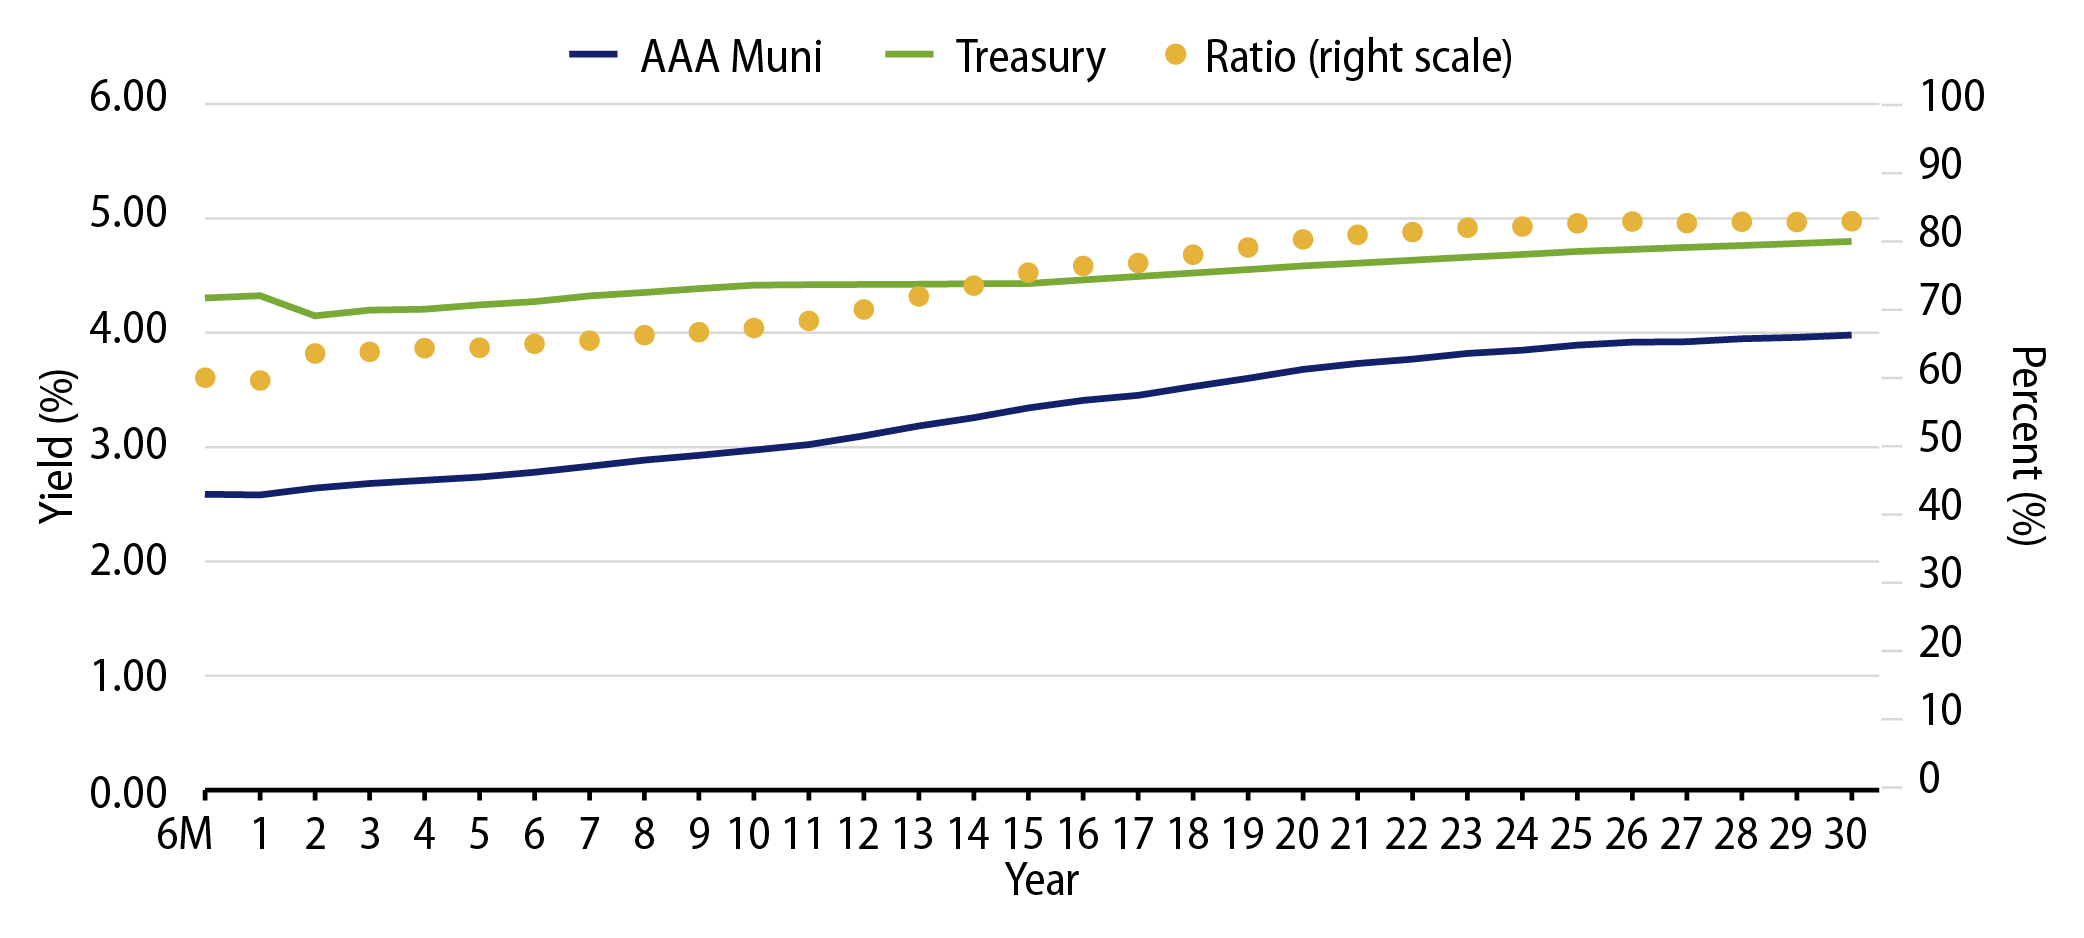
While fixed-income yields rallied last week amid growth concerns that drove risk-off sentiment, municipal short-term rates moved particularly lower. The one-week tax-exempt municipal index declined nearly 100 bps from 2.91% to 1.86%, according to SIFMA. The sharp short-end move supported a continued reversion of the municipal yield curve, which has generally been inverted since the Federal Reserve began its hiking cycle in early 2023.
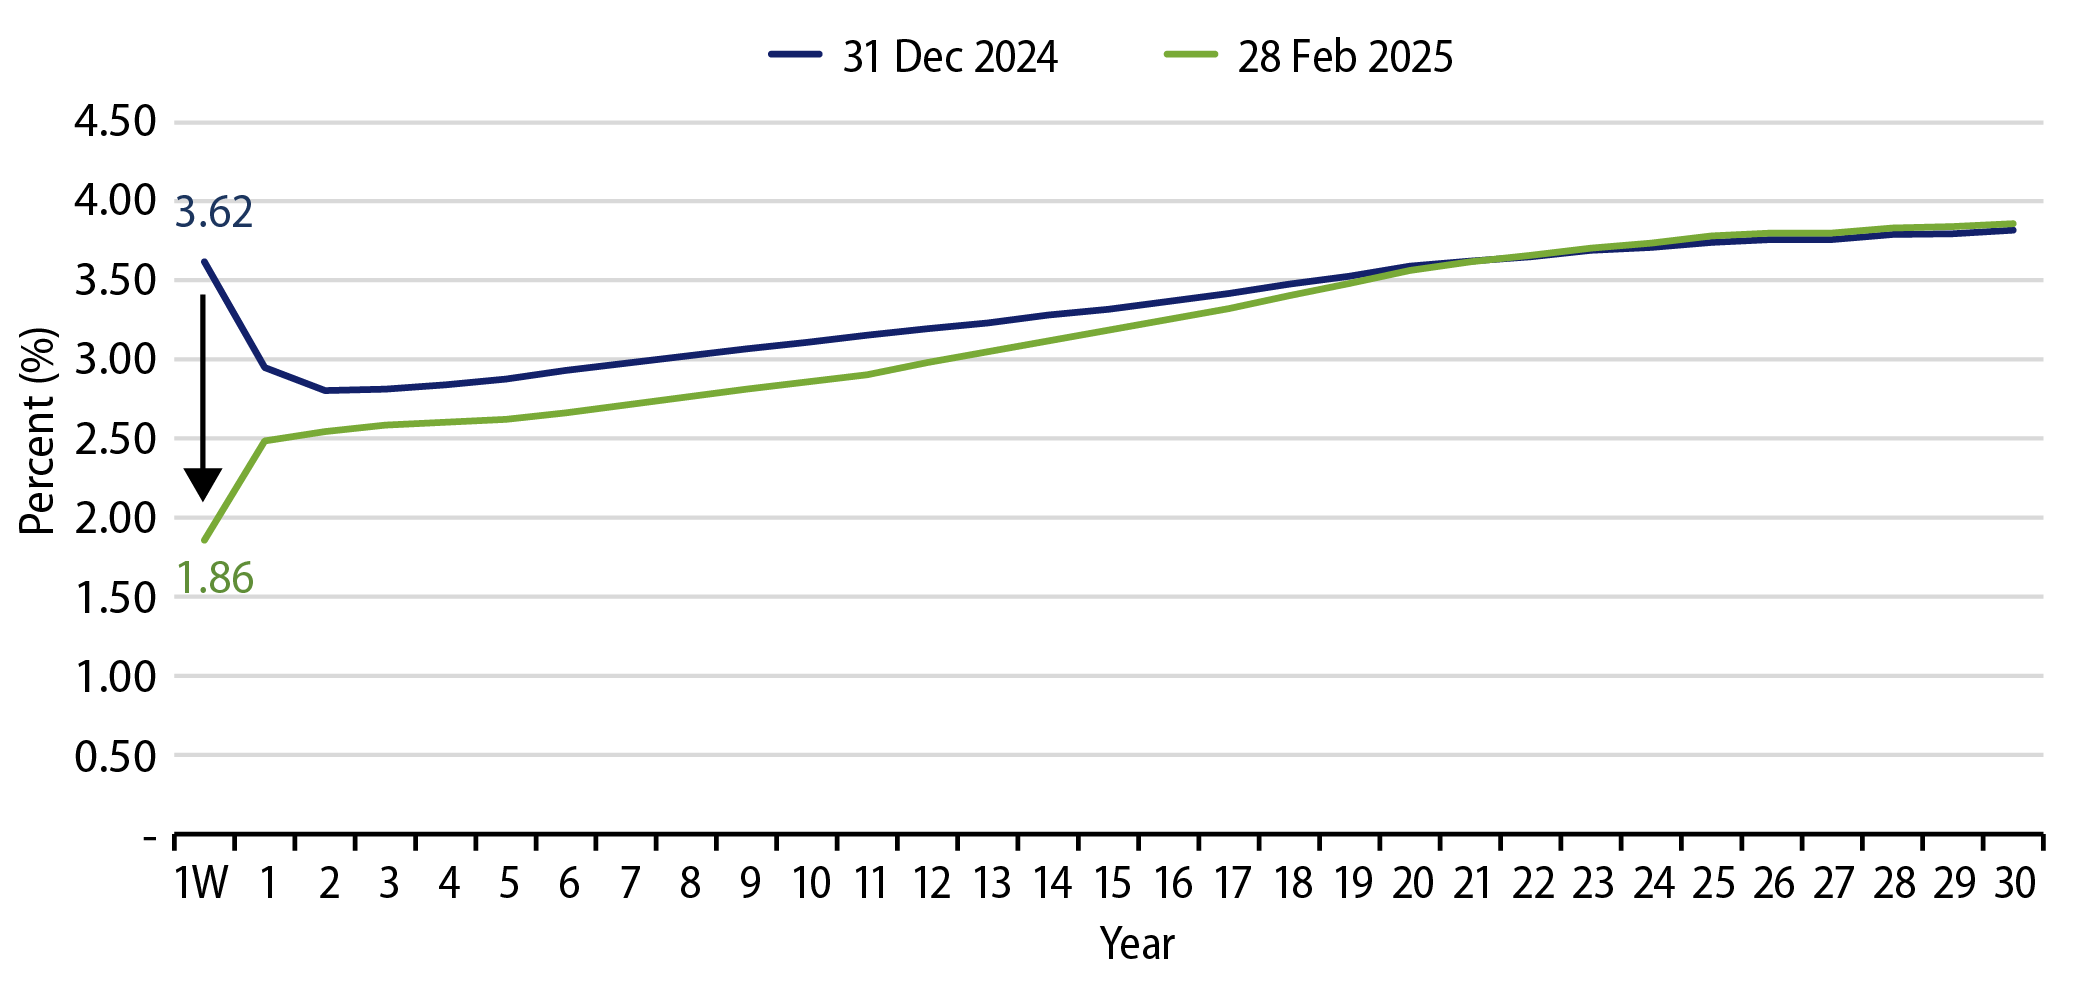
The normalization of the yield curve, and the return of the term premium across the curve has resulted in better relative income opportunities in intermediate and long maturities. At February month-end, the long end of the AAA curve now offers a 200-bp yield advantage versus the one-week SIFMA rate, compared to the 39-bp average observed from January 2023 through February 2025. For short-to-intermediate municipal holders, the curve movement provides not only relative income opportunities, but a return of “roll-down” price support from bonds approaching lower yields as they approach maturity.
Western Asset expects that the curve reversion will provide more opportunities for bulleted curve allocations, such as laddered strategies which had underperformed bar-belled allocations last year. Should short-end yields remain low, the economics of levered tax-exempt structures (e.g., closed-end funds and tender option bonds) would also stand to benefit. Lastly, we expect that lower short-term yields could contribute to greater longer-term muni fund demand, as short-term muni investors consider reallocating to relatively higher income opportunities further out the curve.
Municipal Credit Curves and Relative Value
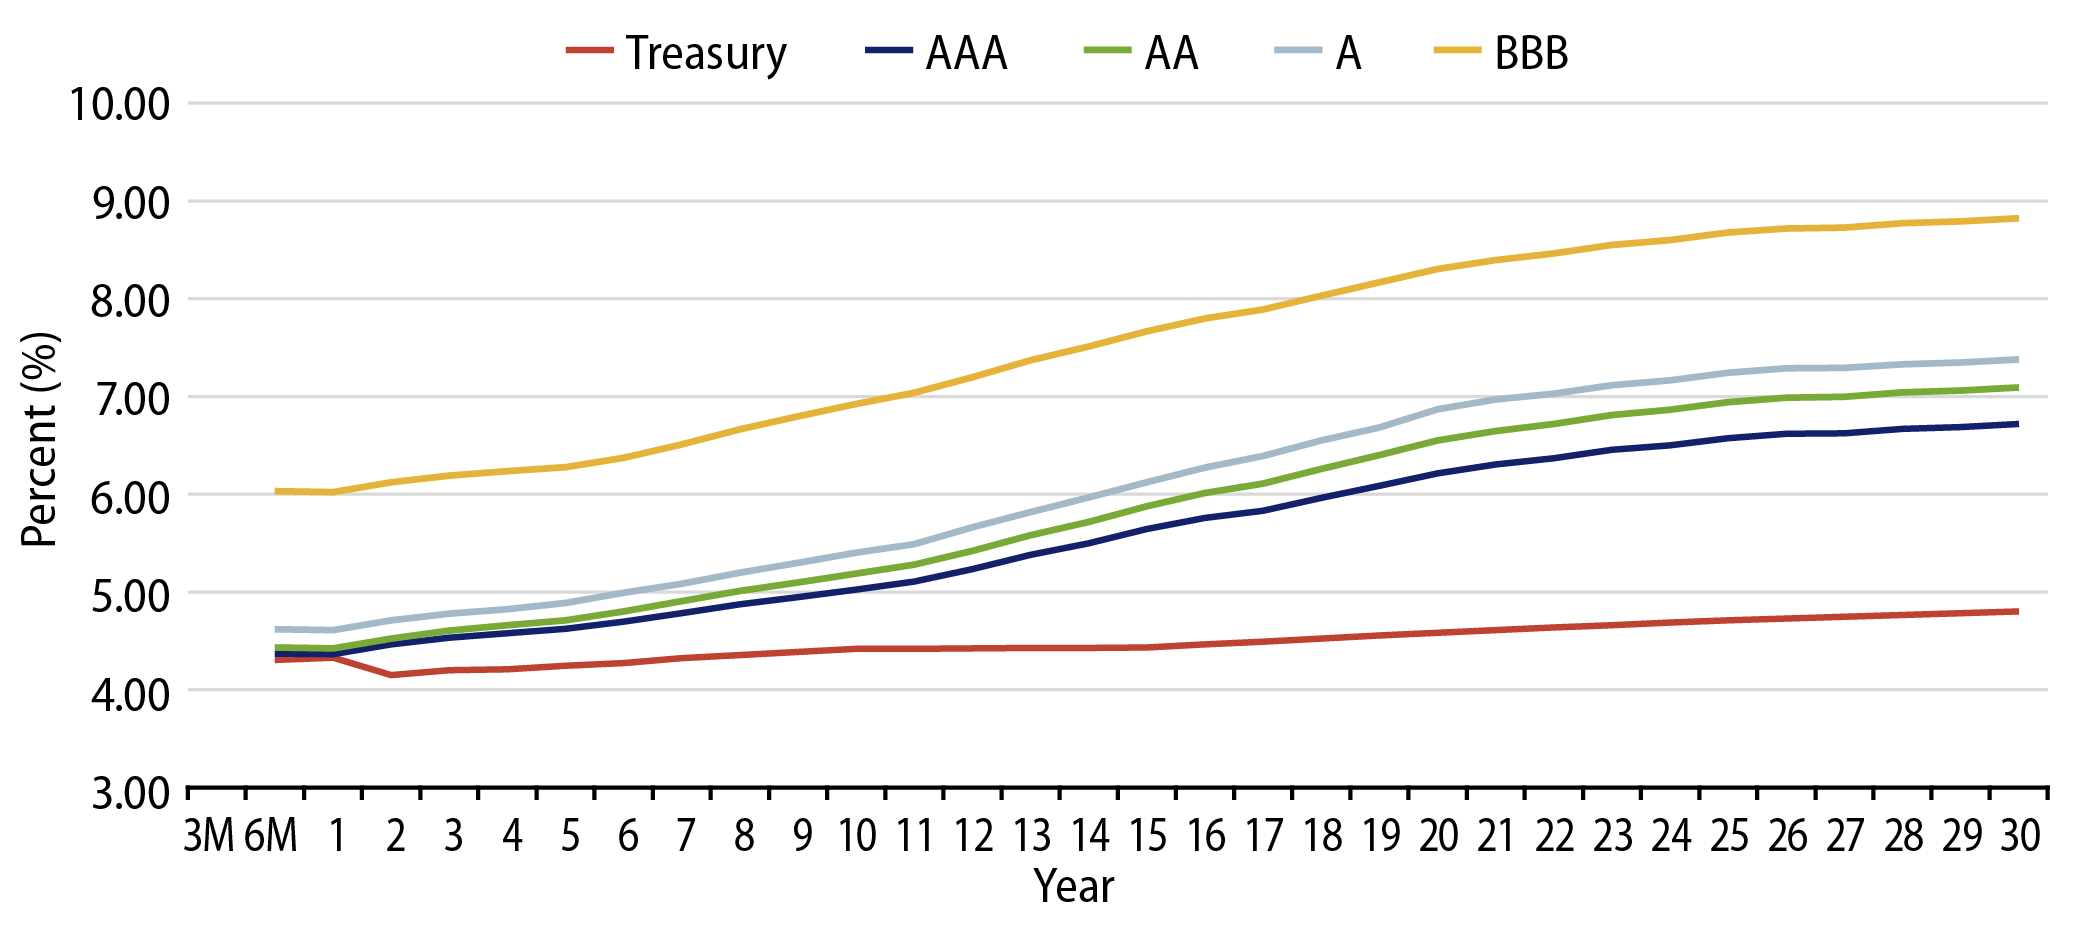
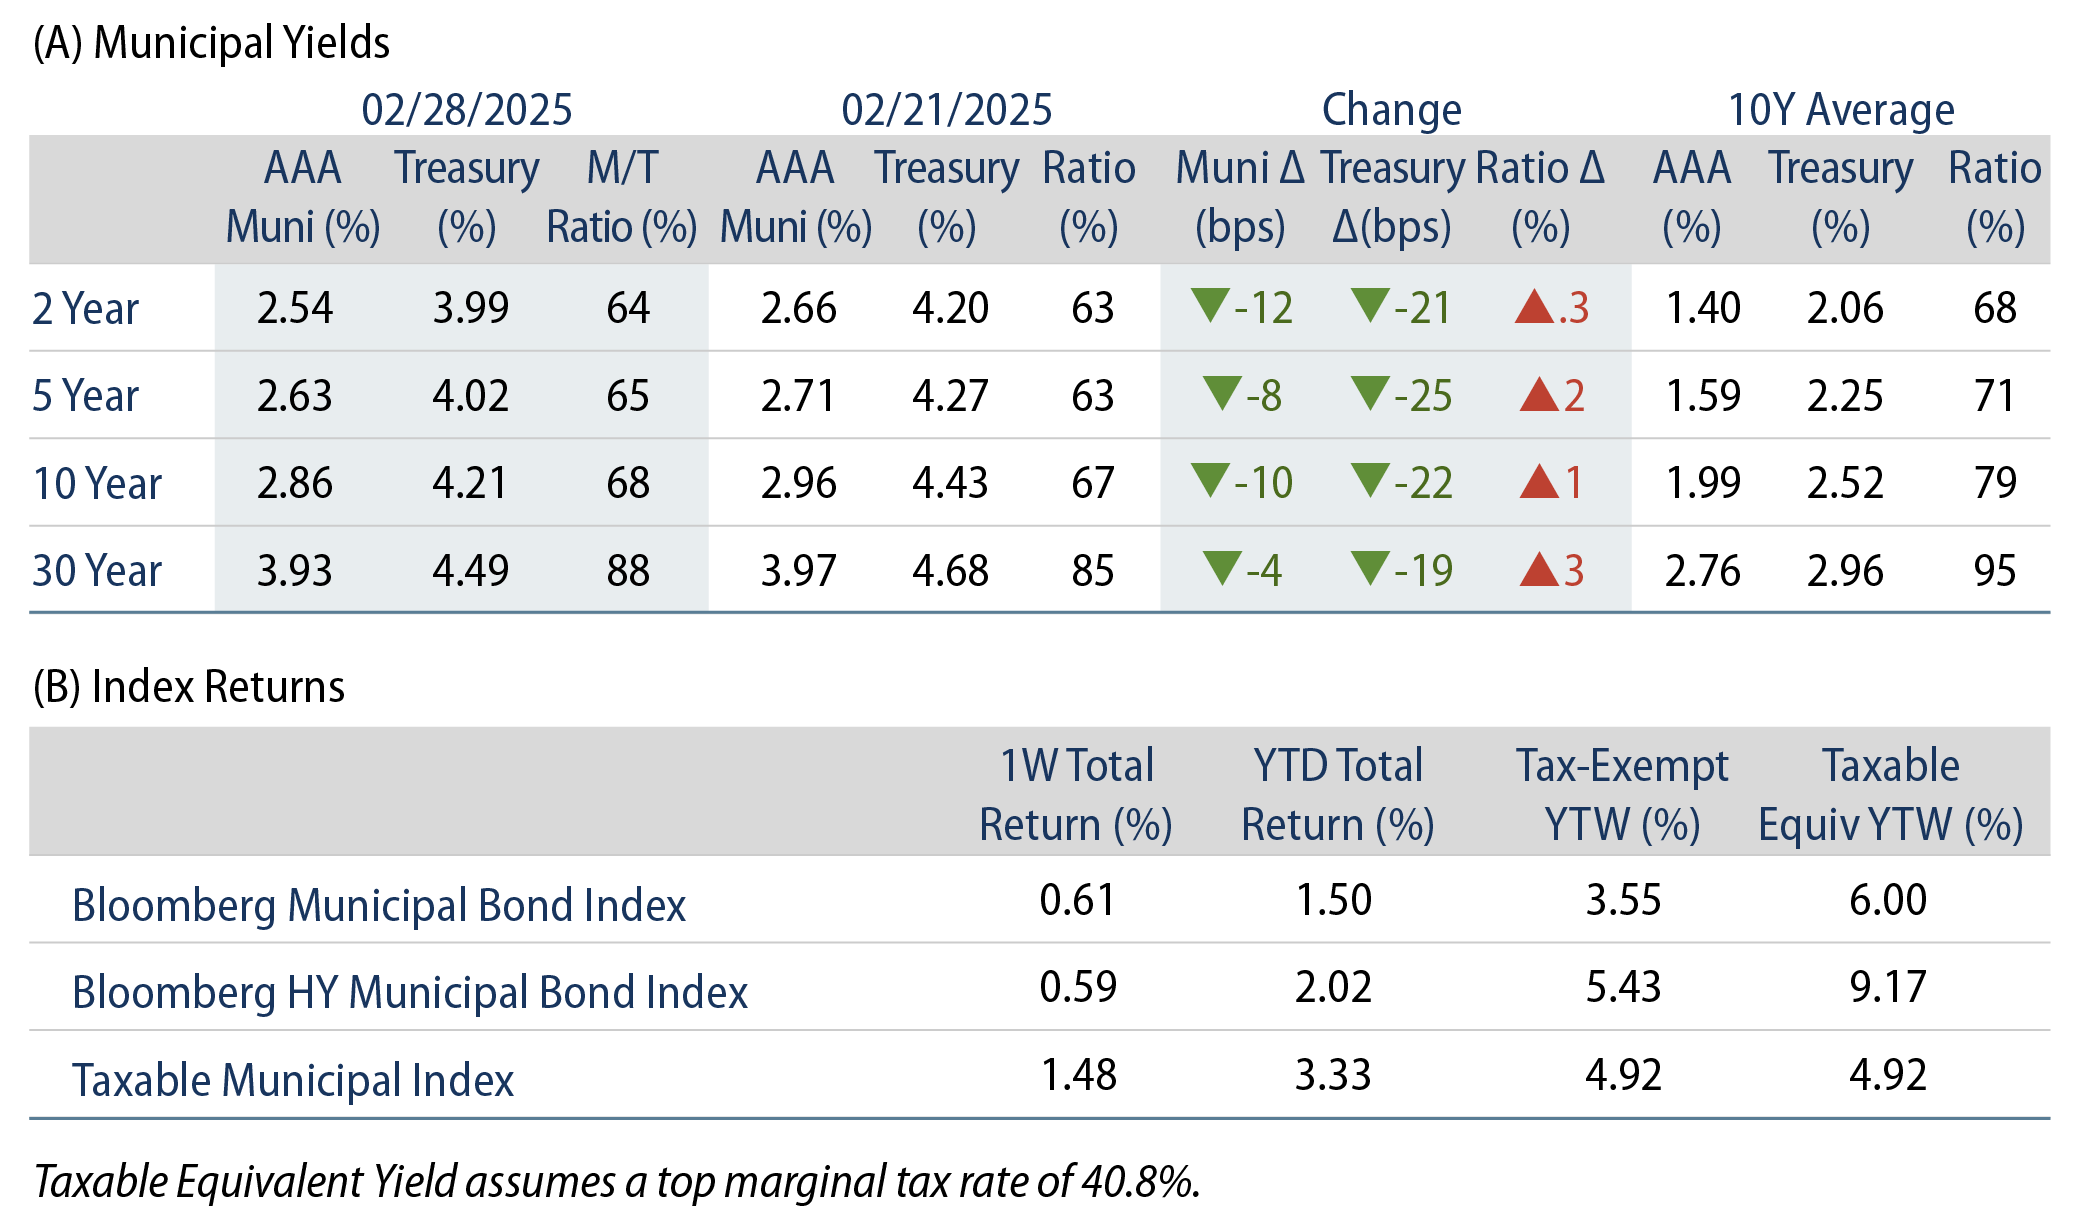
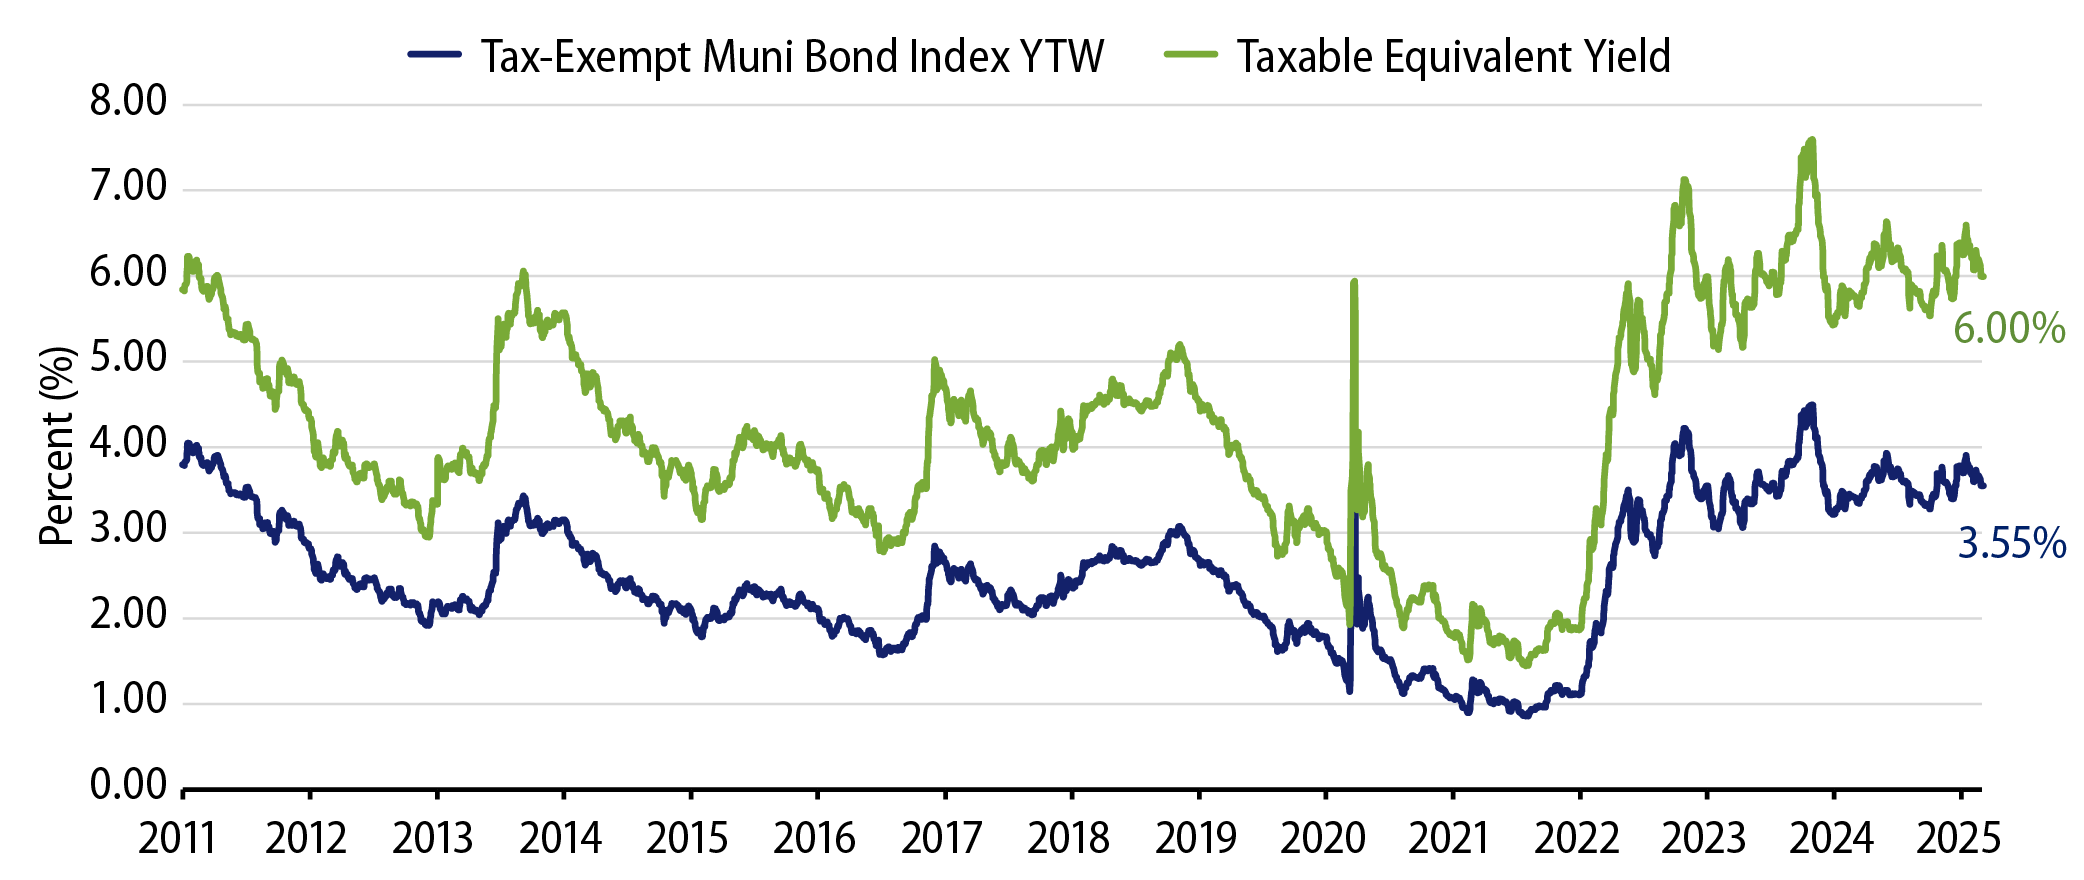
Theme #1: Municipal taxable-equivalent yields and income opportunities remain above decade averages.
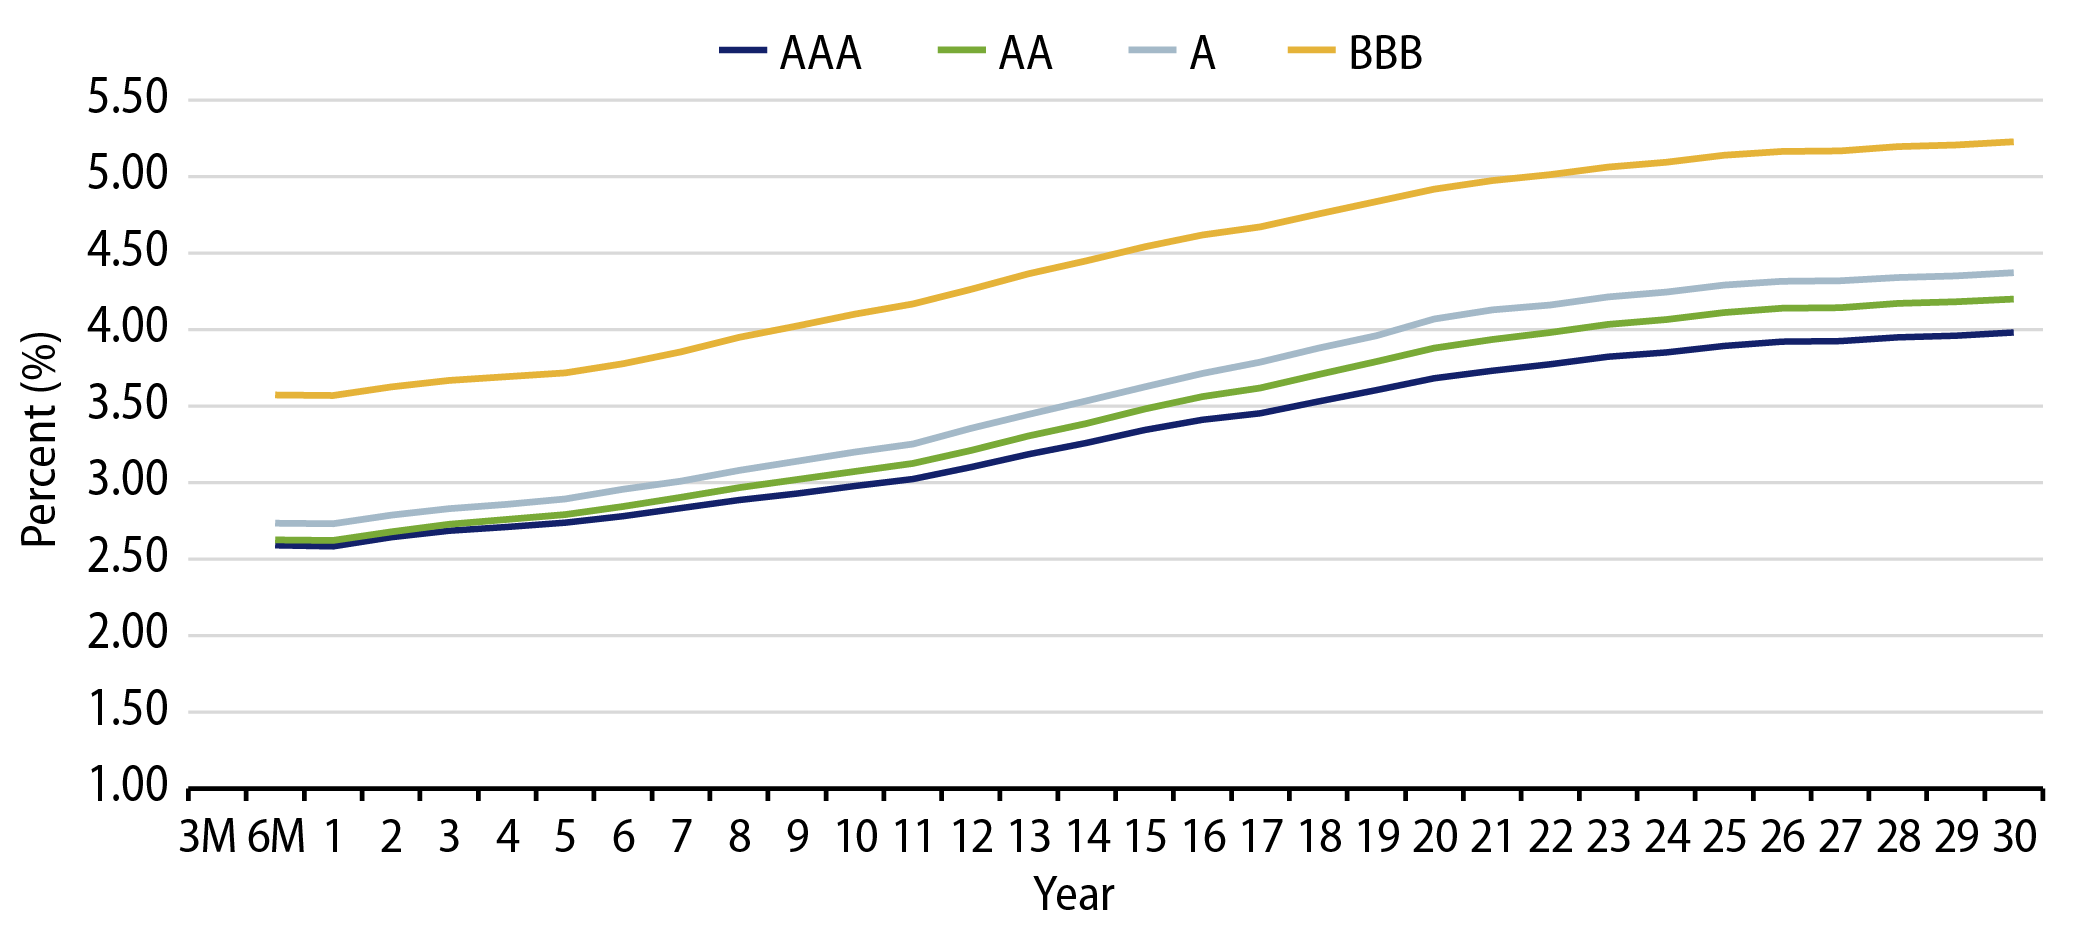
Theme #2: The muni curve has steepened, offering better value in longer maturities.
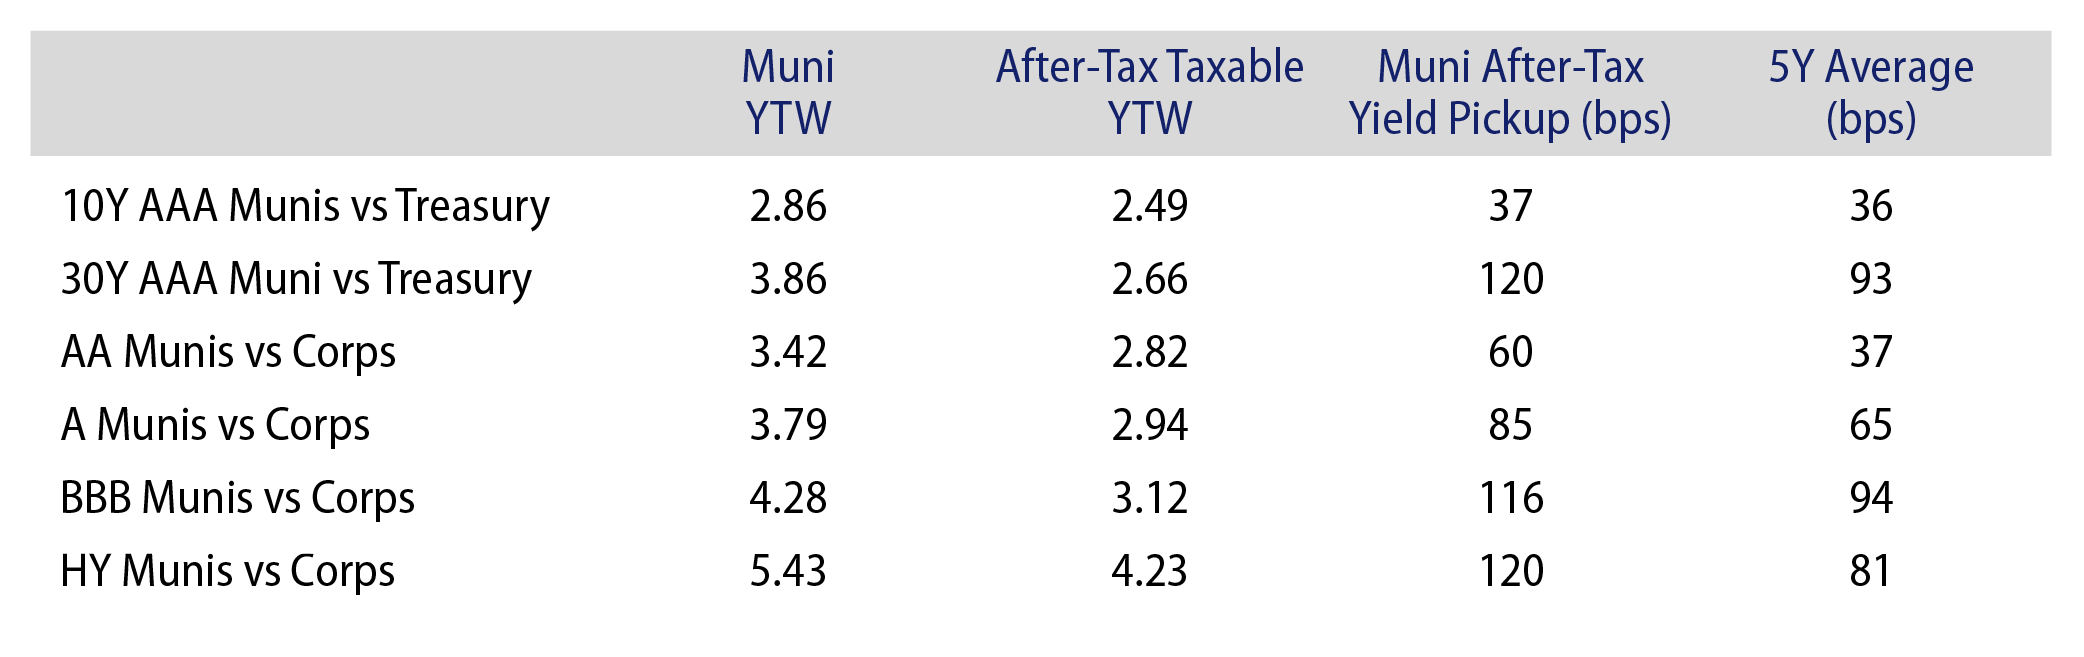
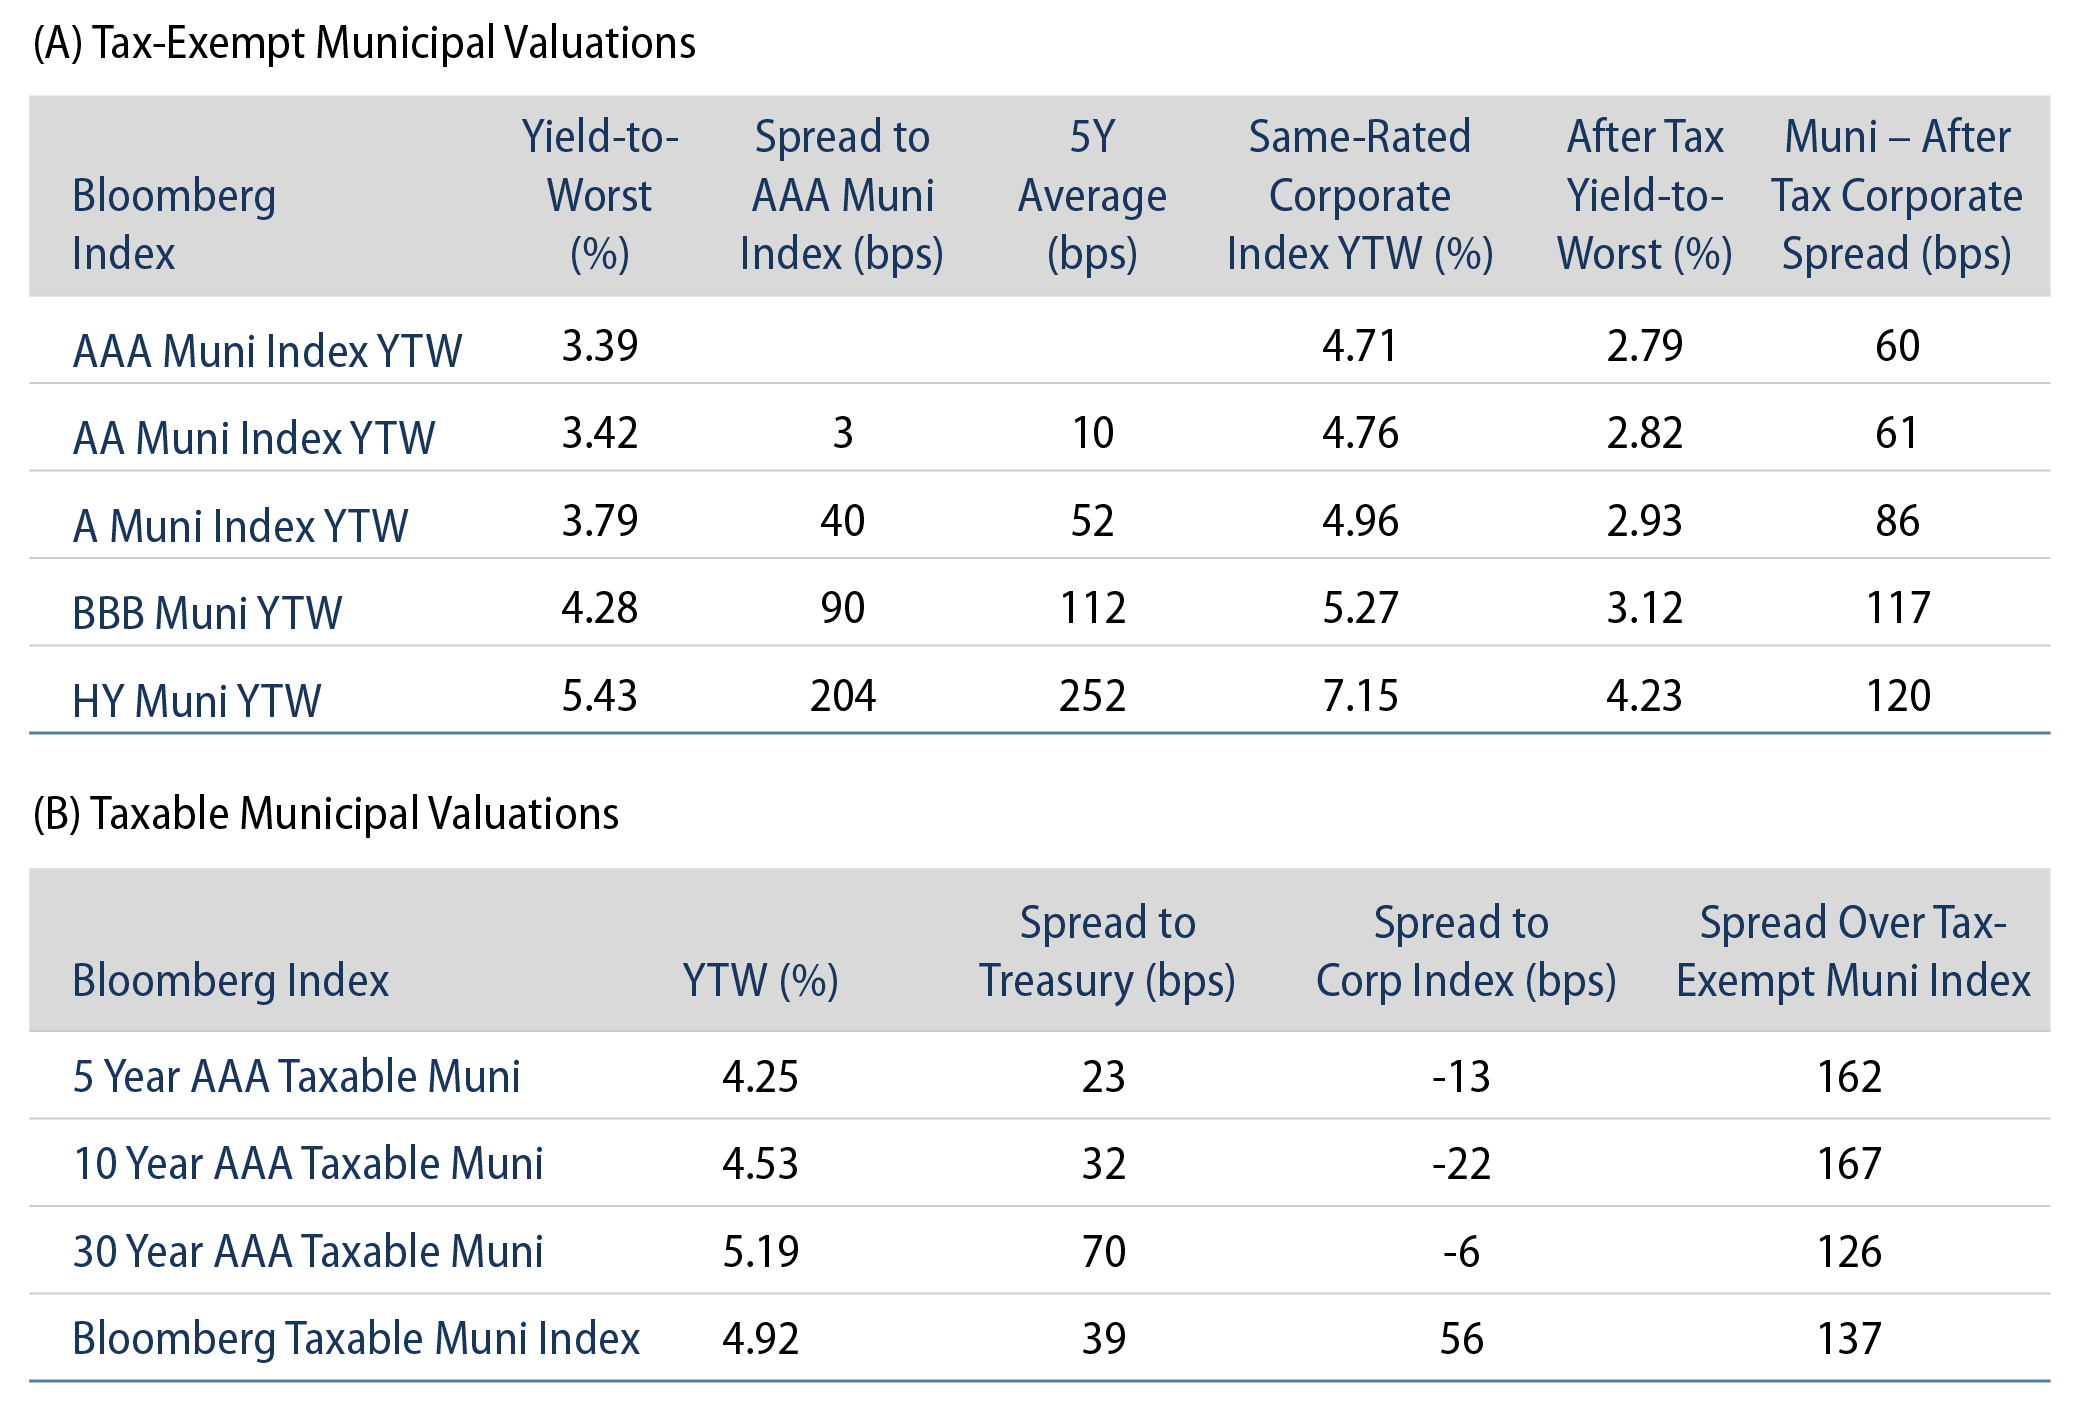
Theme #3: Munis offer attractive after-tax yield pickup versus longer-dated Treasuries and investment-grade corporate credit.