マーケット・ブログ
MARKETS
17 March 2026

Muni Monthly—February 2026

By Sam Weitzman, Christopher Johana, CFA

Performance Overview

Strong Municipal Performance in February Counters Recent Weakness

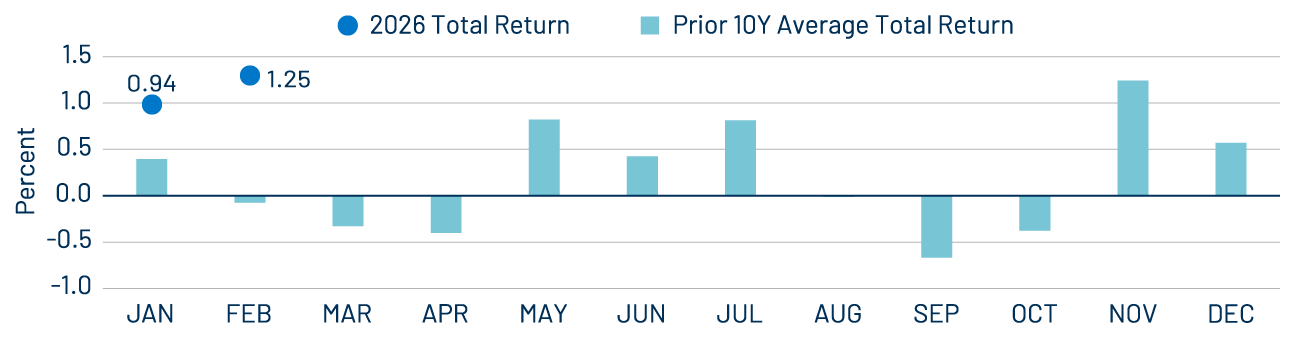
In February, market sentiment was shaped by escalating US-Iran geopolitical tensions and sector-specific selloffs driven by concerns about AI’s potential disruption to existing business models. Economic data presented a mixed picture, with January nonfarm payrolls increasing by 130,000 jobs, rebounding from December’s revised 48,000 gain, while the unemployment rate edged down to 4.3%. Inflation data for January eased from the prior month, with headline Consumer Price Index (CPI) falling to 2.4% year-over-year (YoY) from 2.7% and core CPI easing to 2.5% YoY from 2.6%. All told, Treasuries rallied across the curve, and the municipal yields followed suit but generally underperformed the risk-off sentiment. The Bloomberg Municipal Bond Index gained 1.25% leading year-to-date (YTD) returns higher to 2.20%. February’s strong performance counters recent weakness, with the index averaging negative returns in February, largely driven by softening demand ahead of tax season and limited new issuance.

Exhibit 1: 2026 Monthly Performance vs. 10-Year Average
2026 Monthly Performance vs. 10-Year Average
Source: Western Asset, Bloomberg. As of 27 Feb 26. Select the image to expand the view.

Technicals

Renewed Investor Demand Bolstered Muni Funds

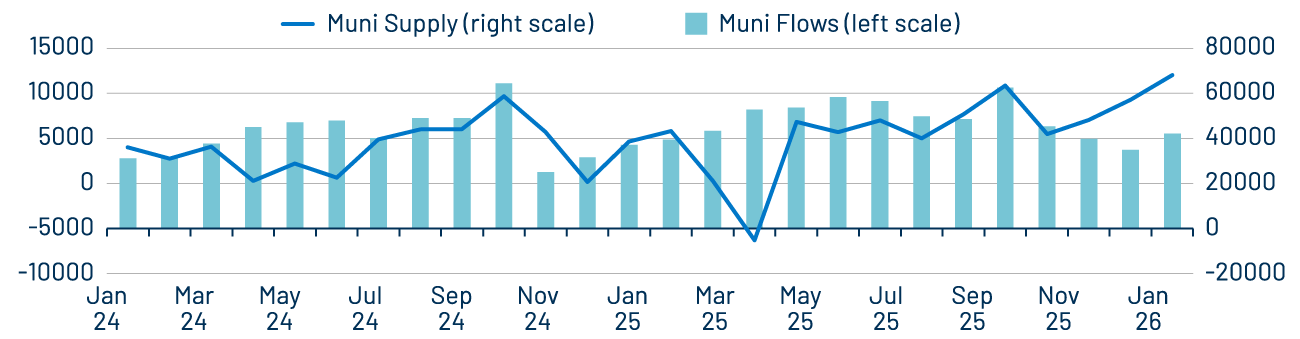
The strong start of the year has been supported by renewed investor demand, as capital has moved decisively back into municipal mutual funds. Investors appear to show an increasing willingness to capitalize on relatively attractive municipal valuations during periods of elevated market volatility, particularly in longer maturities as the yield curve steepened. According to weekly and monthly Lipper and ICI data, municipal mutual funds and ETFs recorded over $10 billion of net inflows in February. Notably, Lipper estimates that approximately 86% of the $18 billion in YTD inflows has been concentrated in intermediate- and long-duration fund categories. Since January 2024, cumulative net inflows of over $126 billion on top of strong SMA demand have fully offset the $122 billion of net outflows experienced in 2022 and 2023.

Exhibit 2: Muni Demand Accelerated Amid Limited Issuance
Muni Demand Accelerated Amid Limited Issuance
Source: Bloomberg, ICI, Western Asset. As of 27 Feb 26. Select the image to expand the view.

Fundamentals

Muni Fundamentals Remained Strong

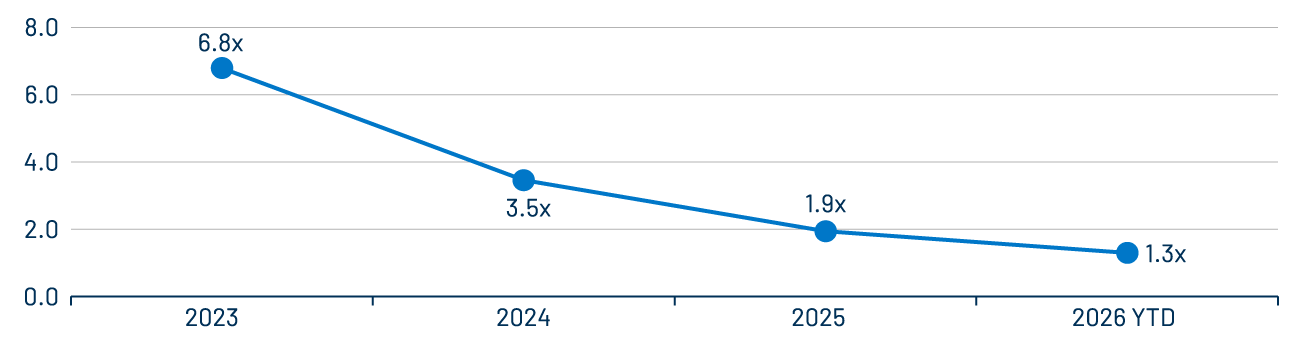
Municipal fundamentals remained strong, supported by elevated tax collections. However, the pace of upgrades relative to downgrades has continued to moderate. Upgrades have outpaced downgrades YTD by a factor of 1.3x, compared to 3.5x in 2024 and 1.9x in 2025, according to Bloomberg. Notably, Fitch downgraded the city of Chicago during the month from A- to BBB+, while maintaining a negative outlook. Fitch cited consecutive operating deficits and a high reliance on one-time solutions as key drivers of the downgrade.

Exhibit 3: Upgrade/Downgrade Ratio (S&P, Moody’s, Fitch Combined by Par Value)
Upgrade/Downgrade Ratio (S&P, Moody’s, Fitch Combined by Par Value)
Source: Bloomberg, Western Asset. As of 26 Feb 26; S&P, Moody’s, Fitch rating actions combined by par value. Select the image to expand the view.

Valuations

Muni Valuation Disparities Create Tax-Efficient Opportunities for Active Managers

The strong YTD performance also represents a meaningful reversal of the underperformance the municipal market experienced in 2025, and muni supply and demand dynamics have shifted valuations in certain segments of the market. For example, AAA rated municipals maturing inside of 10 years now yield less than comparable Treasuries on an after-tax basis, assuming a 37% effective tax rate, largely attributable to high demand for SMA strategies concentrated in shorter maturities. In contrast, using the same tax rate, AAA municipals beyond 20 years offer more than 100 basis points of after-tax yield advantage relative to Treasuries. We believe these valuation disparities create opportunities for active managers to deliver tax-efficient outcomes.

リスク・ディスクロージャー 投資一任契約および金融商品に係る投資顧問料(消費税を含む):
投資一任の場合は運用財産の額に対して、年率1.10%(税抜き1.00%)を上限とする運用手数料を、運用戦略ごとに定めております。また、別途運用成果に応じてお支払いいただく手数料(成功報酬)を設定する場合があります。その料率は、運用成果の評価方法や固定報酬率の設定方法により変動しますので、手数料の金額や計算方法をこの書面に記載することはできません。

投資信託の場合は投資信託ごとに信託報酬が定められておりますので、目論見書または投資信託約款でご確認ください。有価証券の売買又はデリバティブ取引の売買手数料を運用財産の中からお支払い頂きます。投資信託に投資する場合は信託報酬、管理報酬等の手数料が必要となります。これらの手数料には多様な料率が設定されているためこの書面に記載することはできません。デリバティブ取引を利用する場合、運用財産から委託証拠金その他の保証金を預託する場合がありますが、デリバティブ取引の額がそれらの額を上回る可能性があります。その額や計算方法はこの書面に記載することはできません。投資一任契約に基づき運用財産の運用を行った結果、金利、通貨の価格、金融商品市場における相場その他の指標に係る変動により、損失が生ずるおそれがあります。損失の 額が、運用財産から預託された委託証拠金その他の保証金の額を上回る恐れがあります。個別交渉により、一部のお客様とより低い料率で投資一任契約を締結する場合があります。

© Western Asset Management Company Ltd 2026. 本資料の著作権は、ウエスタン・アセット・マネジメント株式会社およびその関連会社(以下「ウエスタン・アセット」という)に帰属するものであり、意図した受取人のみを対象として作成されたものです。本資料に記載の内容は、秘密情報及び専有情報としてお取り扱いください。ウエスタン・アセットの書面による事前の承諾なしに、全部又は一部を無断で複写、複製することや転載することを堅くお断りいたします。

過去の運用実績は将来の運用実績を示すものではありません。また、本資料は、将来の実績を予測または予想するものではありません。

本資料は、適格機関投資家、特定投資家、企業年金基金、公的年金等、豊富な投資経験と高度な専門知識とを備えたプロフェッショナルのお客様のみにご提供するものです。

本資料は情報の提供のみを目的としています。資料作成時点のウエスタン・アセットの見解を掲載したものであり、将来予告なしに変更する場合があります。また、リアルタイムの市場動向や運用に関する見解ではありません。

本資料で第三者のデータが使用されている場合、ウエスタン・アセットはそのデータが公表時点で正確であると信じていますが、それを保証するものではありません。ウエスタン・アセットの戦略・商品の受賞またはランキングが含まれている場合、これらは独立した第三者または業界出版物により公平な定量・定性情報に基づき決定されたものです。ウエスタン・アセットは、これらの第三者の標準的な業界サービスを利用したり、出版物を購読したりする場合がありますが、それらは、すべてのアセット・マネージャーが利用可能なものであり、ランキングや受賞に影響を与えるものではありません。

本資料に記載の戦略・商品には、元本の一部または全部の損失を含む大きなリスクが伴う場合があります。また、当該戦略や商品に投資することは大きな変動を伴う可能性があり、投資家にはそのようなリスクを受け入れる経済力および意思を持つことが求められます。

特段の注記がない限り、本資料に記載の戦略のパフォーマンスはコンポジットのデータです。コンポジットではないその他 のデータについては、当戦略の運用方針に最も近いと考えられる口座を、コンポジットの代表口座として掲載しています。 つまり、代表口座は運用結果により選択されるものではありません。代表口座のポートフォリオ特性は、コンポジットやそ の他のコンポジット構成口座と異なる場合があります。これらの口座についての情報はご依頼に応じてご提供いたします。

本資料に記載している内容は、ウエスタン・アセットの投資家に対する投資助言ではありません。個別銘柄・発行体に関 する一般的または具体的に言及する内容は、例としてご提示したものであり、購入または売却を推奨するものでもありま せん。また、ウエスタン・アセットの役職員及びお客様は、本資料に記載の有価証券を保有している可能性があります。

本資料は、会計、法務、税務、投資またはその他の助言の提供を意図したものではなく、またそれらに依存すべきでは ありません。お客様は、ウエスタン・アセットが提供する戦略・商品への投資を行うにあたり、経済的リスクやメリットな どについて助言が必要である場合は、ご自身の弁護士、会計士、投資家、税理士、その他のアドバイザーに相談して下さ い。お客様は、居住国で適用される法令を遵守する責任を負います。

ウエスタン・アセットは世界有数の運用専門会社です。1971年の設立以来、債券運用に特化したアクティブ運用機関として 最大規模の運用資産と運用チームを有しています。拠点は米国カリフォルニア州パサデナ、ニューヨーク、英国ロンドン、 シンガポール、東京、豪メルボルン、ブラジル・サンパウロ、香港、スイス・チューリッヒにあり、フランクリン・リソーシズInc の完全子会社ですが、経営全般に独立性を保っており、次の6法人で構成されています。米国:ウエスタン・アセット・マネ ジメント・カンパニーLLC(米証券取引委員会(SEC)登録の投資顧問会社)。ブラジル・サンパウロ:ウエスタン・アセット・マネジメント・カンパニーLtda.(ブラジル証券取引委員会が規制)。メルボルン:ウ エスタン・アセット・マネジメント・カンパニーPty Ltd(事業者番号ABN 41 117 767 923、AFSライセンス303160)。シンガ ポール:ウエスタン・アセット・マネジメント・カンパニーPte. Ltd(. CMSライセンスCo. Reg. No. 200007692R、シンガポール 通貨監督庁が監督)。日本:ウエスタン・アセット・マネジメント株式会社(金融商品取引業者、金融庁が規制)。英国:ウ エスタン・アセット・マネジメント・カンパニーLimited(英金融行動監視機構(FCA)が認可(FRN145930)、規制)。本資料 は英国ではFCAが定義する「プロフェッショナルな顧客」のみを対象とした宣伝目的に使用されます。許可された欧州経 済領域 (EEA)加盟国へ配信する場合もあります。最新の承認済みEEA加盟国のリストは、ウエスタン・アセット(電話:+44 (0)20 7422 3000)までお問い合わせください。詳細は当社ウエブサイトwww.westernasset.co .jpをご参照ください。
ウエスタン・アセット・マネジメント株式会社について
業務の種類: 金融商品取引業者(投資運用業、投資助言・代理業、第二種金融商品取引業)
登録番号: 関東財務局長(金商)第427号
加入協会: 一般社団法人日本投資顧問業協会(会員番号 011-01319)、
一般社団法人投資信託協会