Putting 2022 in Perspective
One of the most challenging aspects for investors during 2022 has been the lack of hedging alternatives for balanced portfolios due to the apparent breakdown of historical diversification characteristics between stocks and bonds. Exhibit 1 illustrates the so-called “60/40 portfolio”—60% in equities and 40% in bonds (represented by the S&P 500 Index and the Bloomberg US Aggregate Index, respectively)—which is down close to 20% in year-to-date performance so far this year. This is on course to be the deepest annual drawdown for this portfolio since 2008.
This has been a particularly painful experience for investors who have allocated a portion of their assets to fixed-income with the expectation that it would act as a safe-haven asset class and would dampen portfolio volatility during periods of equity market declines. In 2022, however, bonds have not only failed to provide protection from the weak performance of risk assets such as equities, but they have lost almost as much value as equities (Exhibit 2).

In light of market performance this year, is the diversification benefit of bonds now structurally impaired or is the experience of 2022 a statistical anomaly?
The Historical Context
Based on our analysis, we have concluded that rising and persistently high inflation along with the restrictive policies of central banks, led by the Federal Reserve (Fed), have combined to negatively impact the returns of both asset classes. That said, the mounting macroeconomic evidence pointing to lower inflation and a peaking of official interest rates in the coming months suggest a slowing and eventual reversal of the conditions prevailing in 2022. In turn, this could see bonds recover and re-establish their diversifying benefits versus equities and other risk assets.
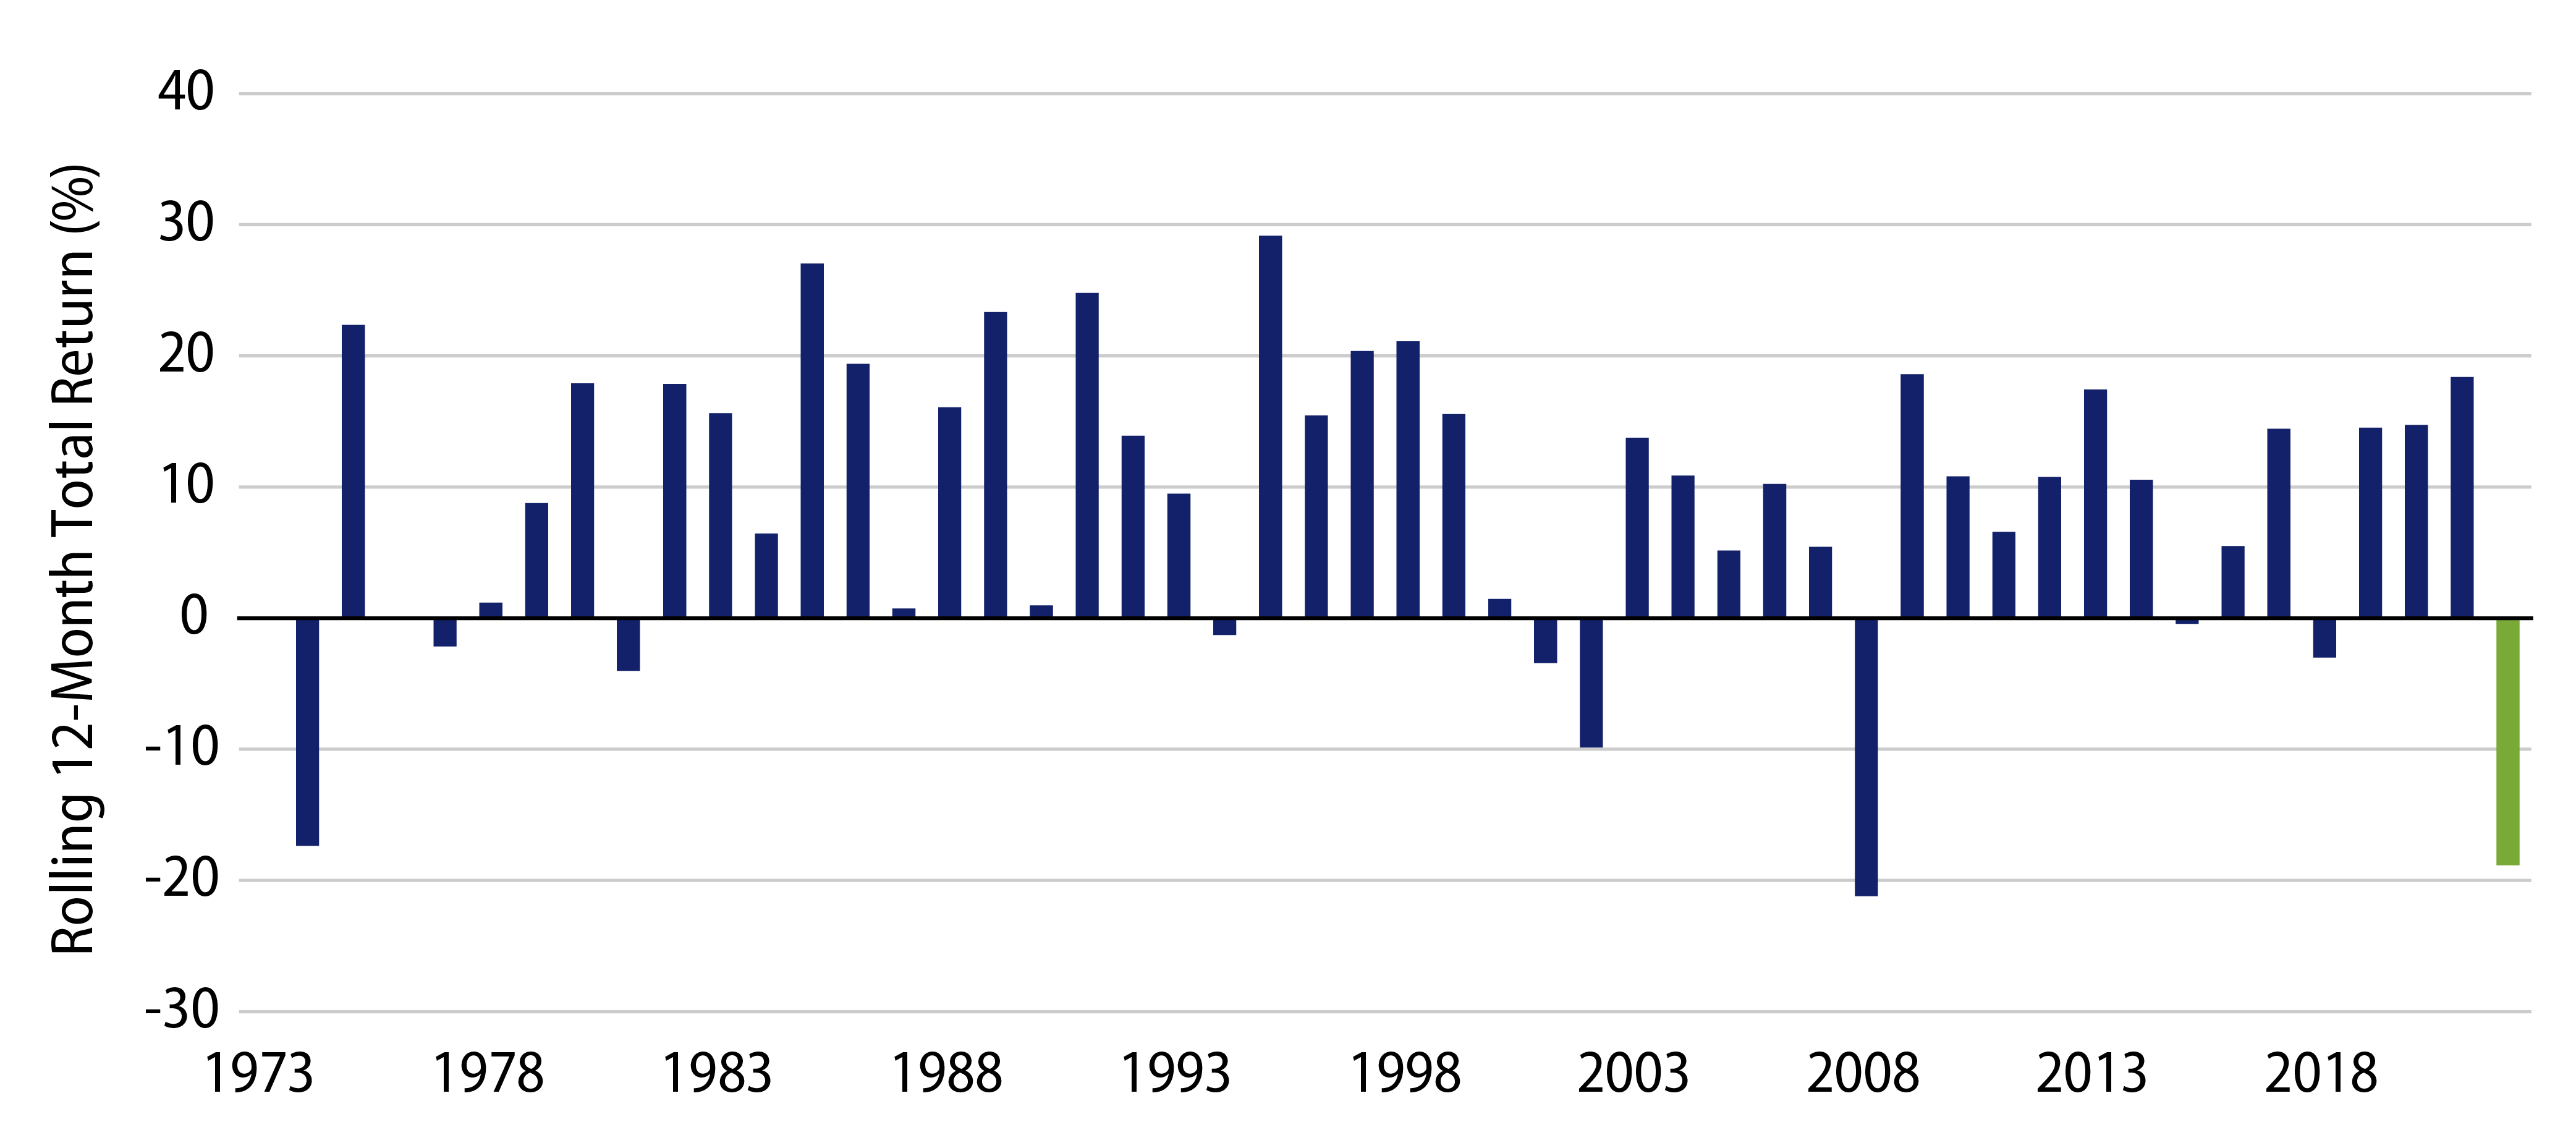
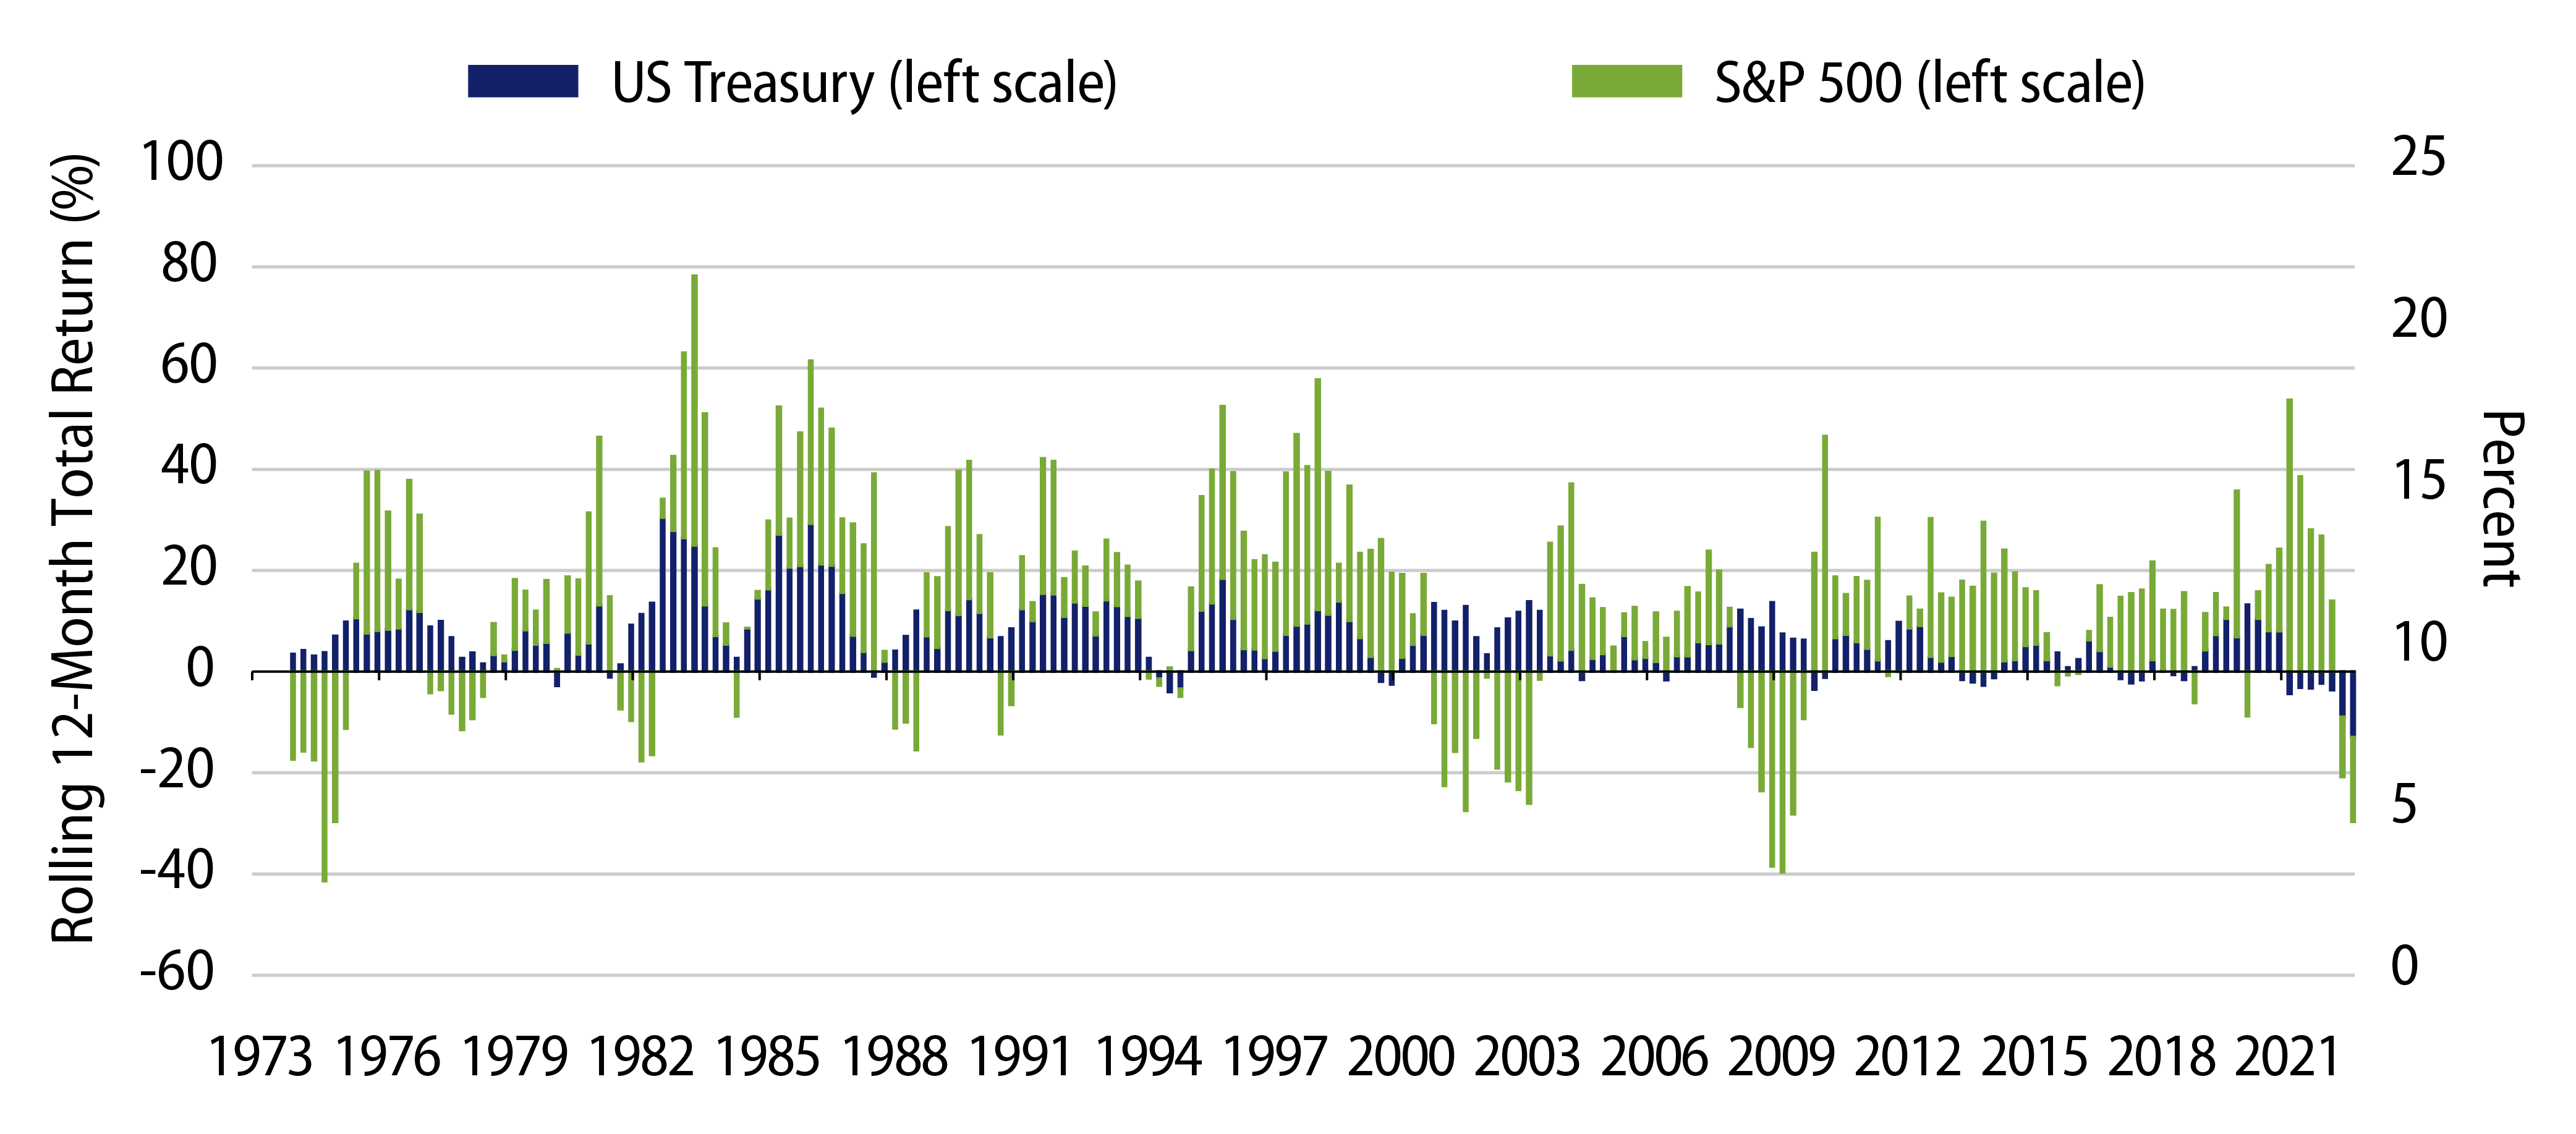
Looking back to the mid-1970s when the active bond market (and Western Asset’s journey) began in earnest, we observe that it is not common to see periods during which government and other high-quality bonds post negative total returns over a 12-month rolling period. In fact, since 1973 there were only 26 out of 196 (or 13%) quarters in which total returns of US Treasuries (USTs) over the previous 12 months were negative. As you can see in Exhibit 3, the magnitude of bond declines seen since 4Q20 is unprecedented. Moreover, periods during which bonds delivered negative total returns over the same time frames when equities also saw declines are even rarer. Such simultaneous declines have occurred in only four (or 2%) of the quarterly rolling 12-month periods since 1973.
Looking Forward
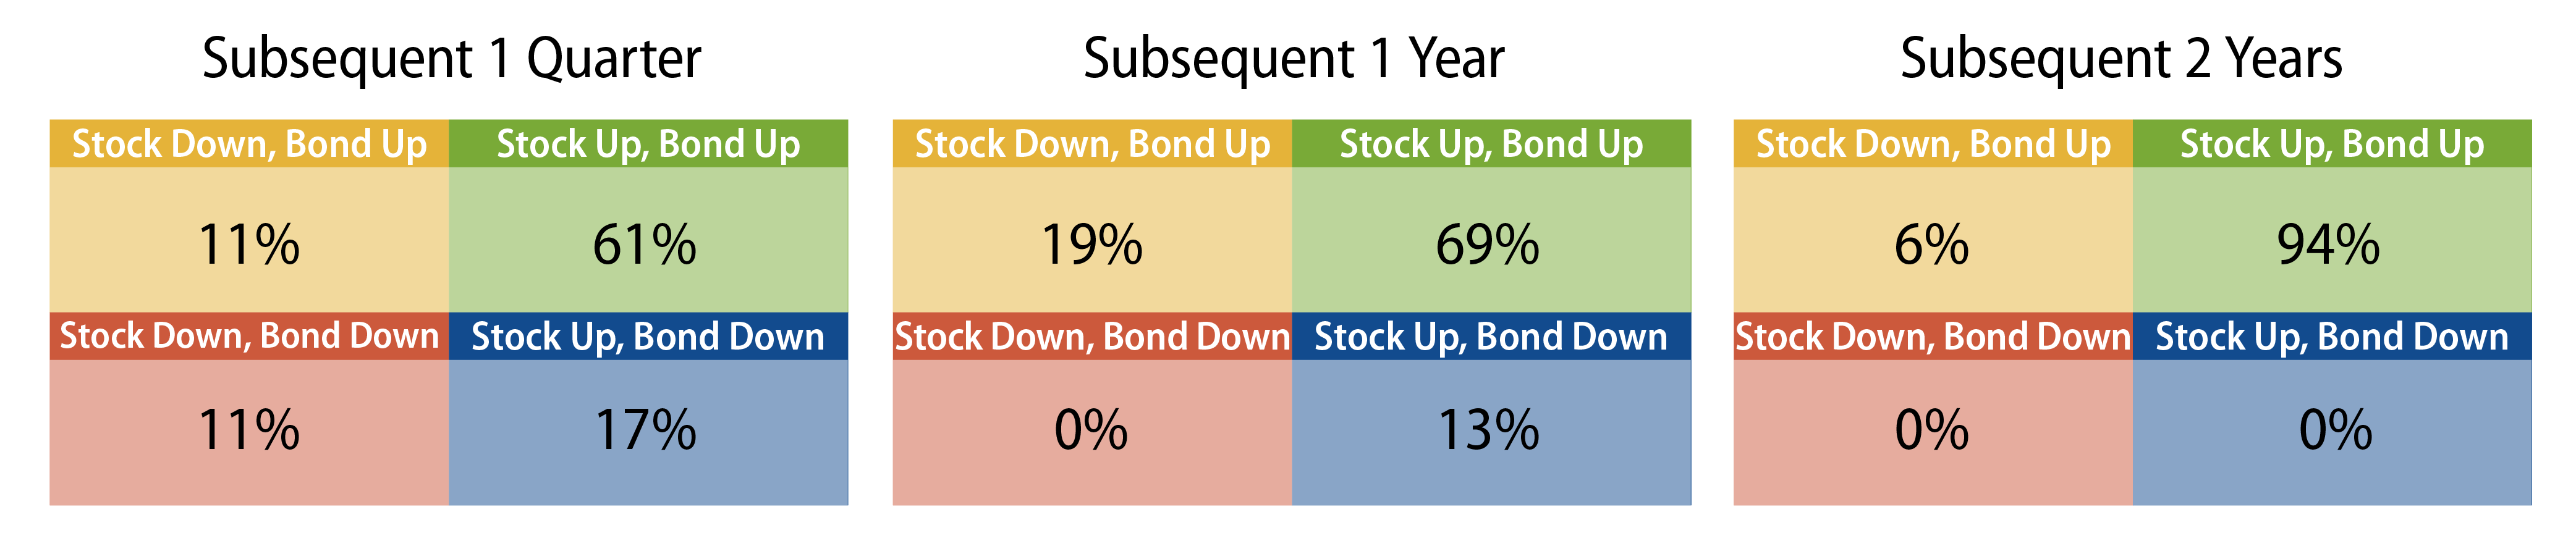
While the past is no guarantee of the future, what can history teach us about the performance of bonds and equities after periods of simultaneous decline? As shown in Exhibit 4, the probability of a reversal in performance from such periods is significant. According to historical data, since 1973 we observe that following a quarterly decline in both bonds and equities, bonds have posted positive total returns in 88% of periods after one year and 100% after two years. These recoveries occur usually (but not always) alongside a recovery in equities. Moreover, bonds have historically returned 9.2% in the subsequent one-year period, recovering 88% of the losses sustained during the period of drawdown. Stocks returned 16.3% in the subsequent one-year period, recovering 81% of their losses.
The Fundamental Case for Asset Class Performance
To help us relate equity and bond returns to inflation and interest-rate cycles, we have identified two distinct macroeconomic regimes when equities decline alongside bonds. When both regimes occur at the same time the breakdown in negative correlation between bonds and equities can be meaningful.
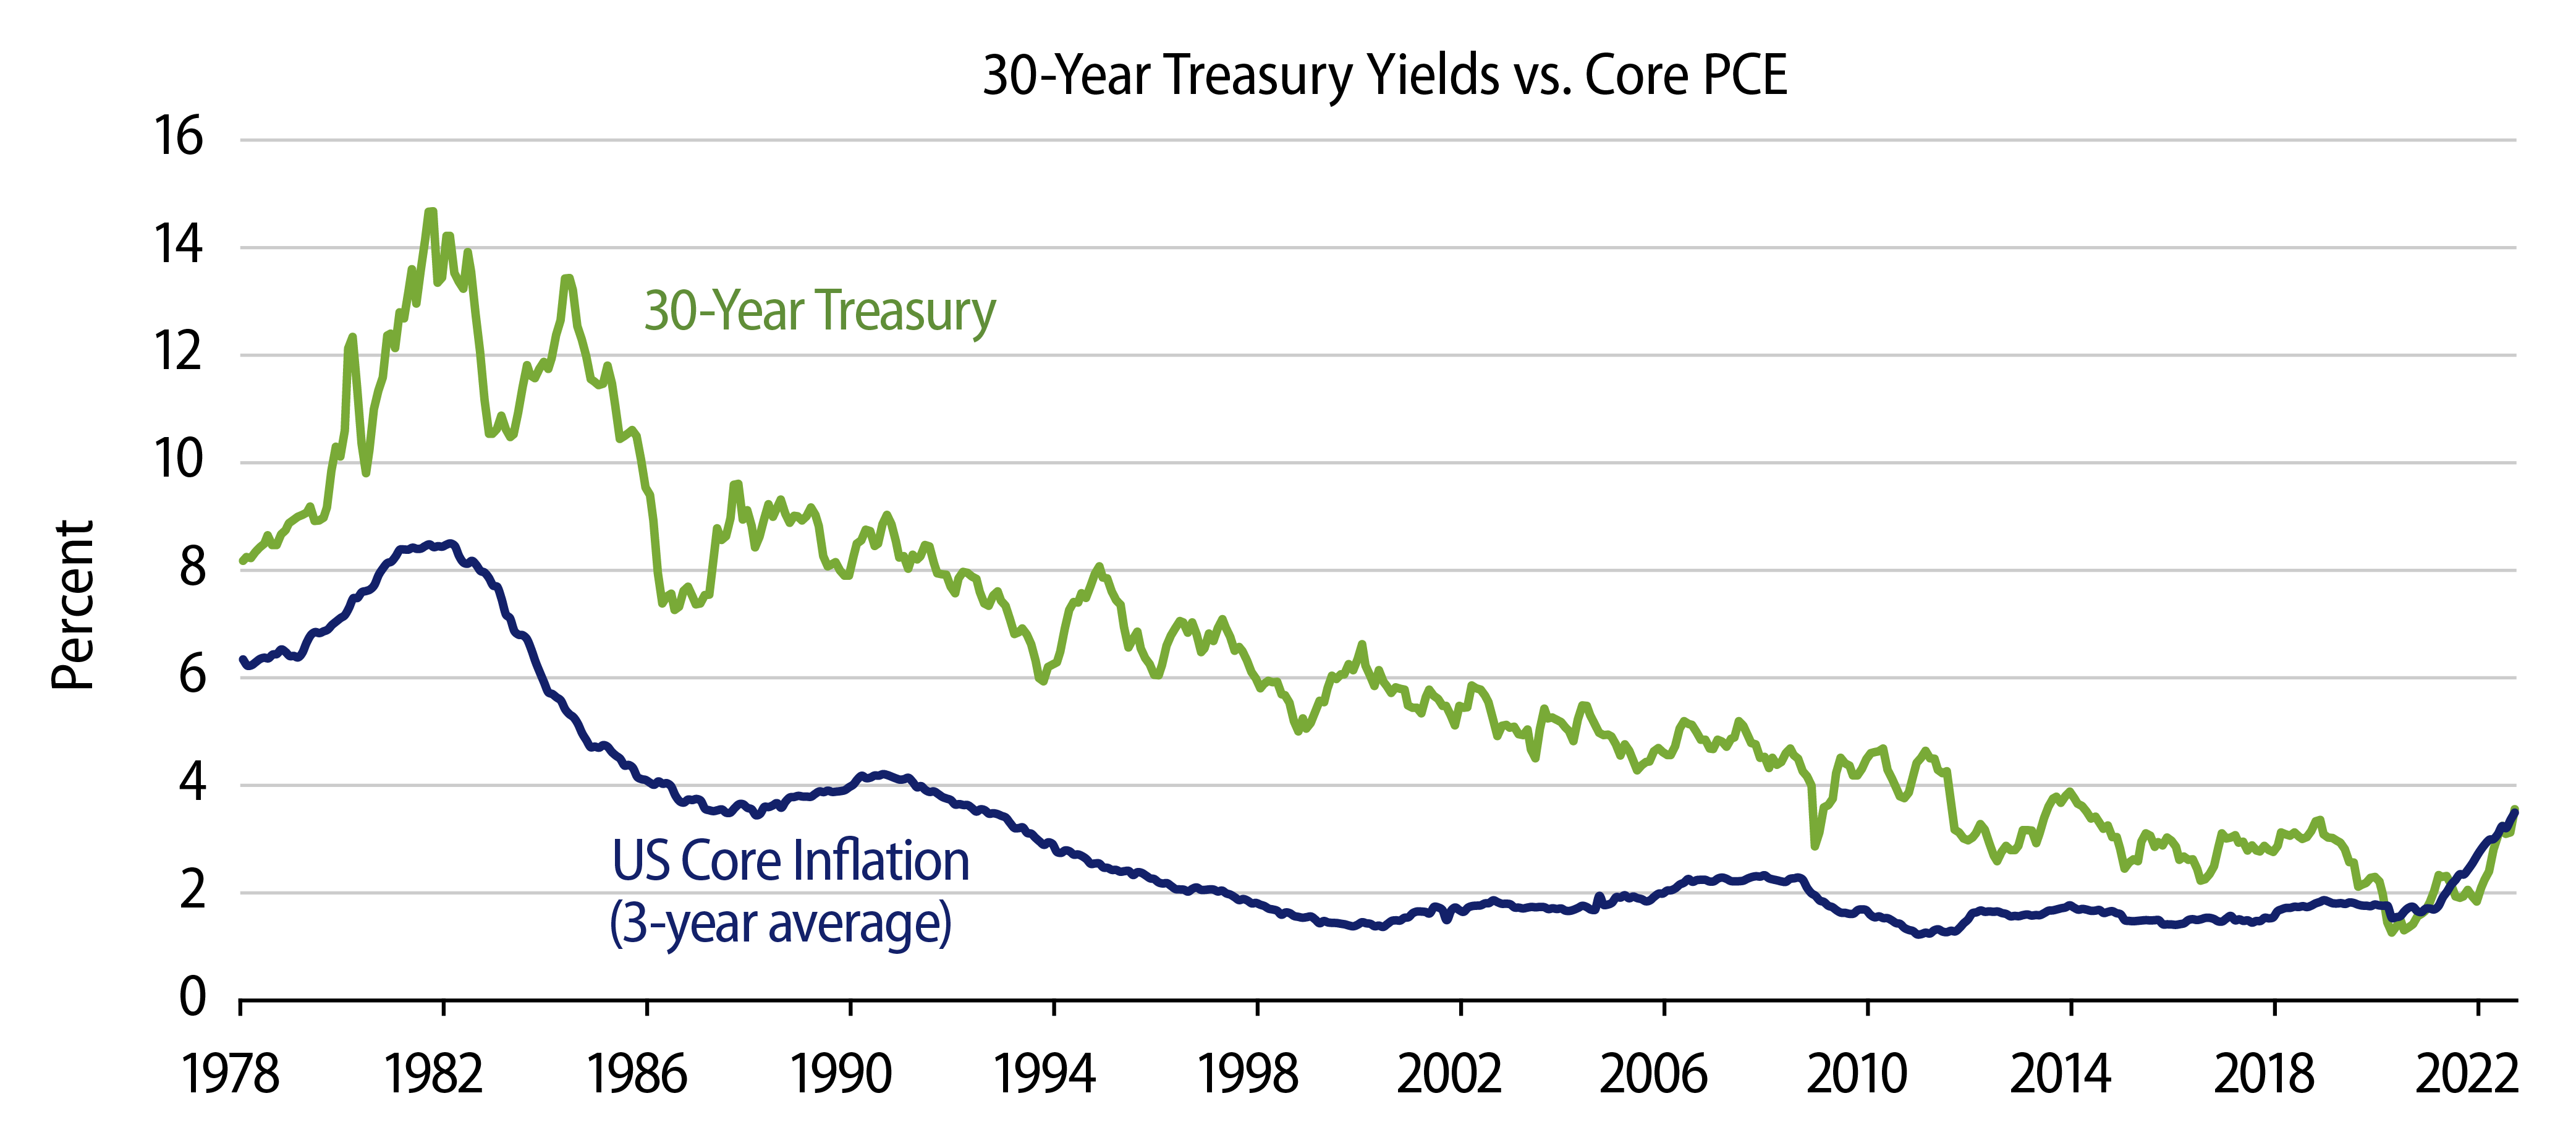
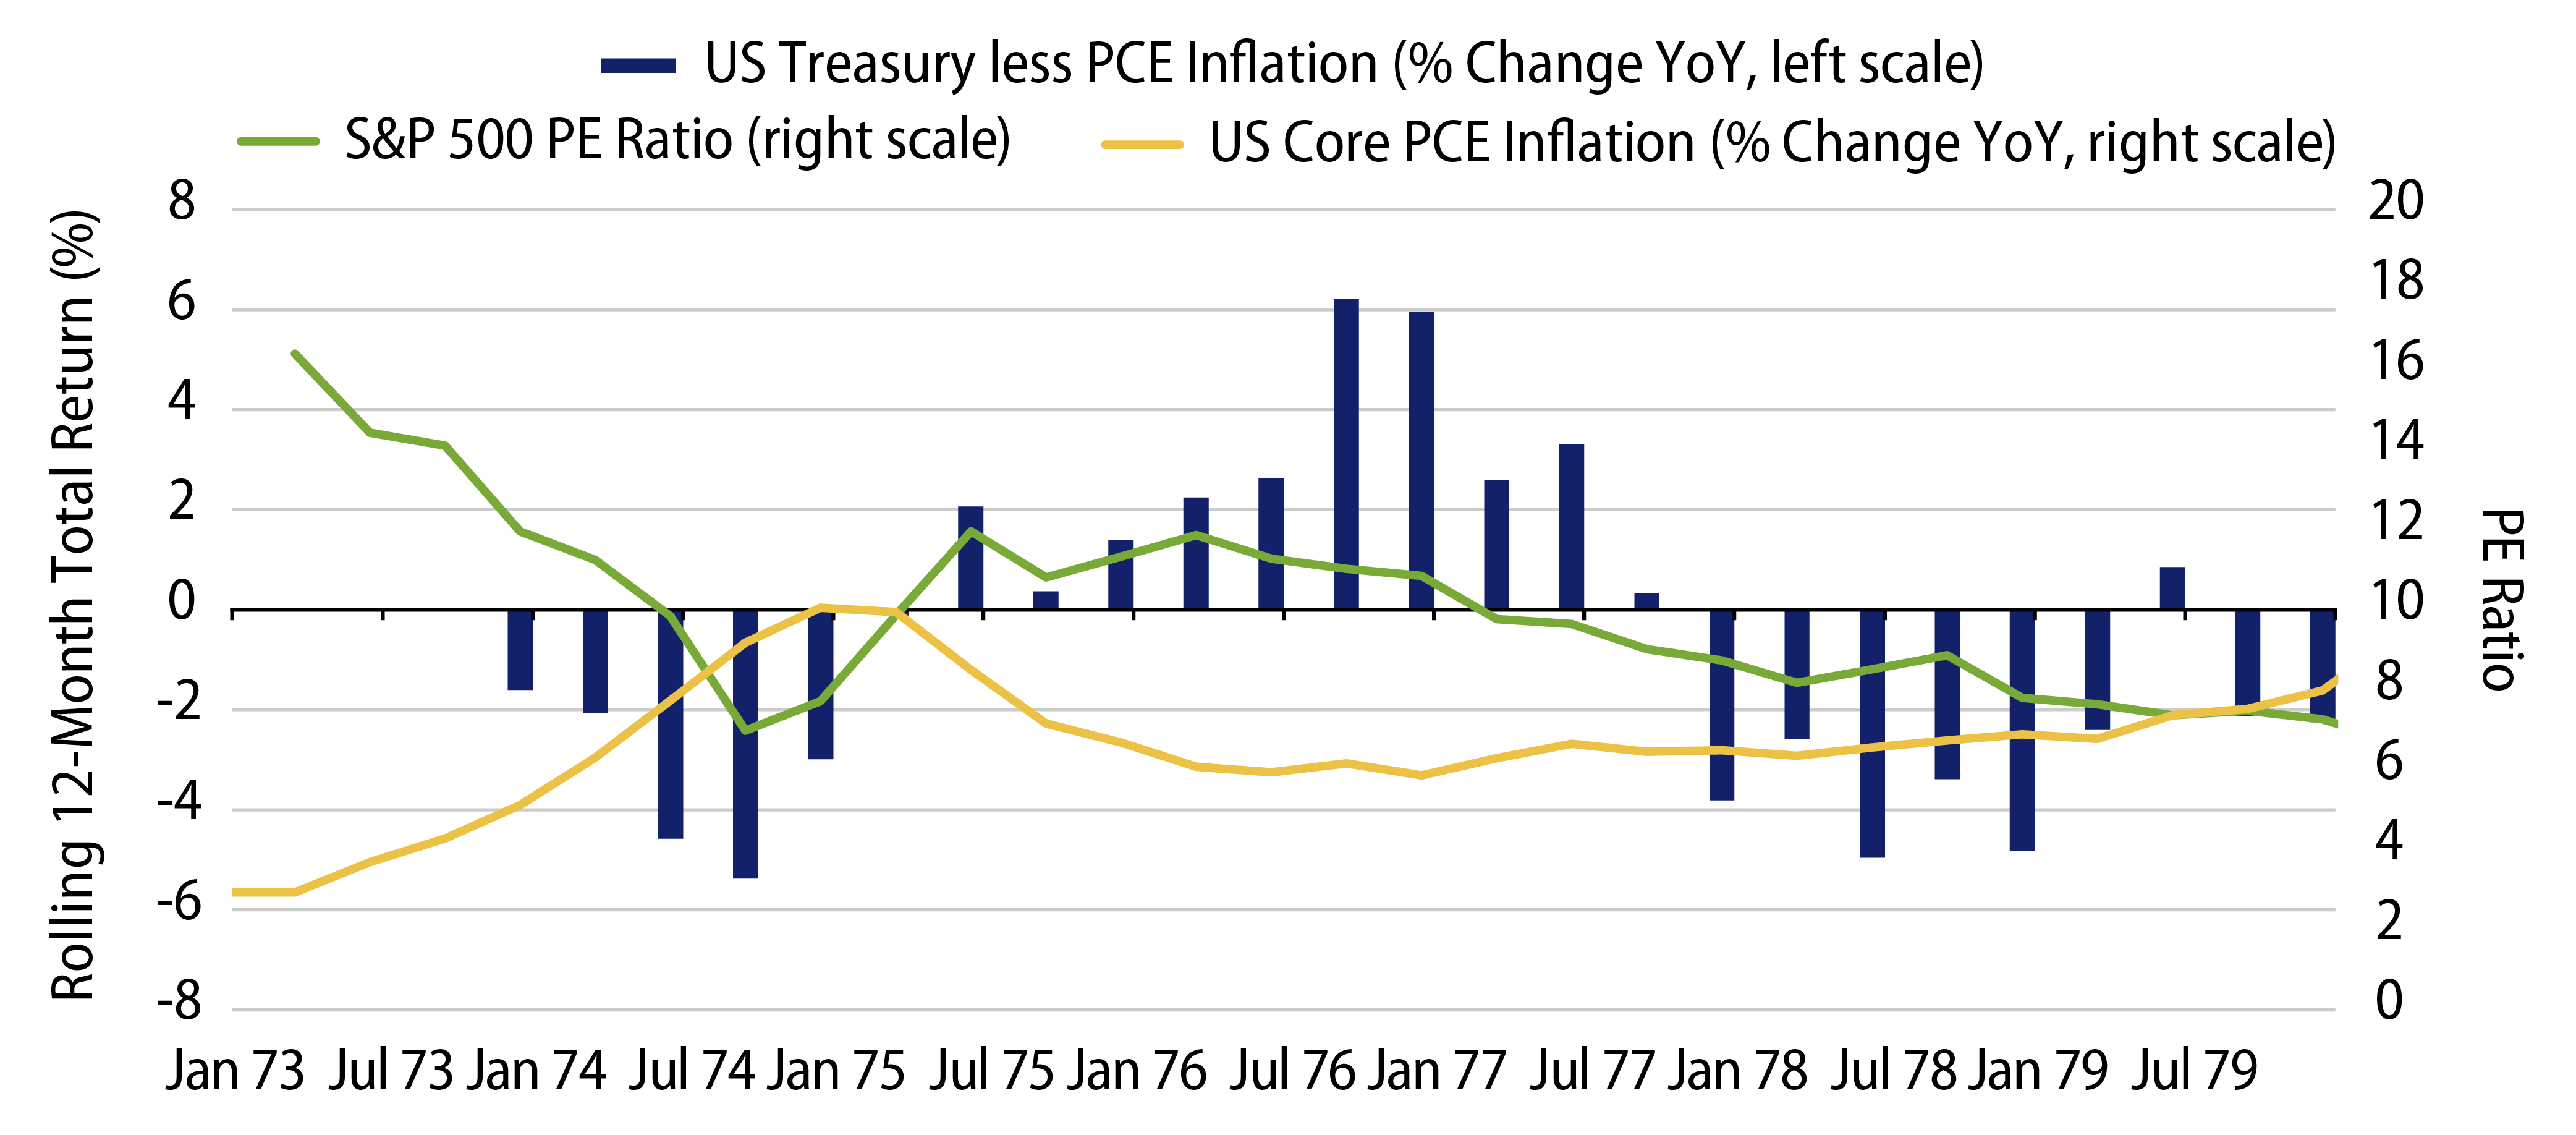
1. High, rising and persistent inflation hurts bond valuations (especially in real terms), but also negatively impacts equities via weaker P/E ratios. Exhibit 5 shows that this is what we observed throughout the 1970s.
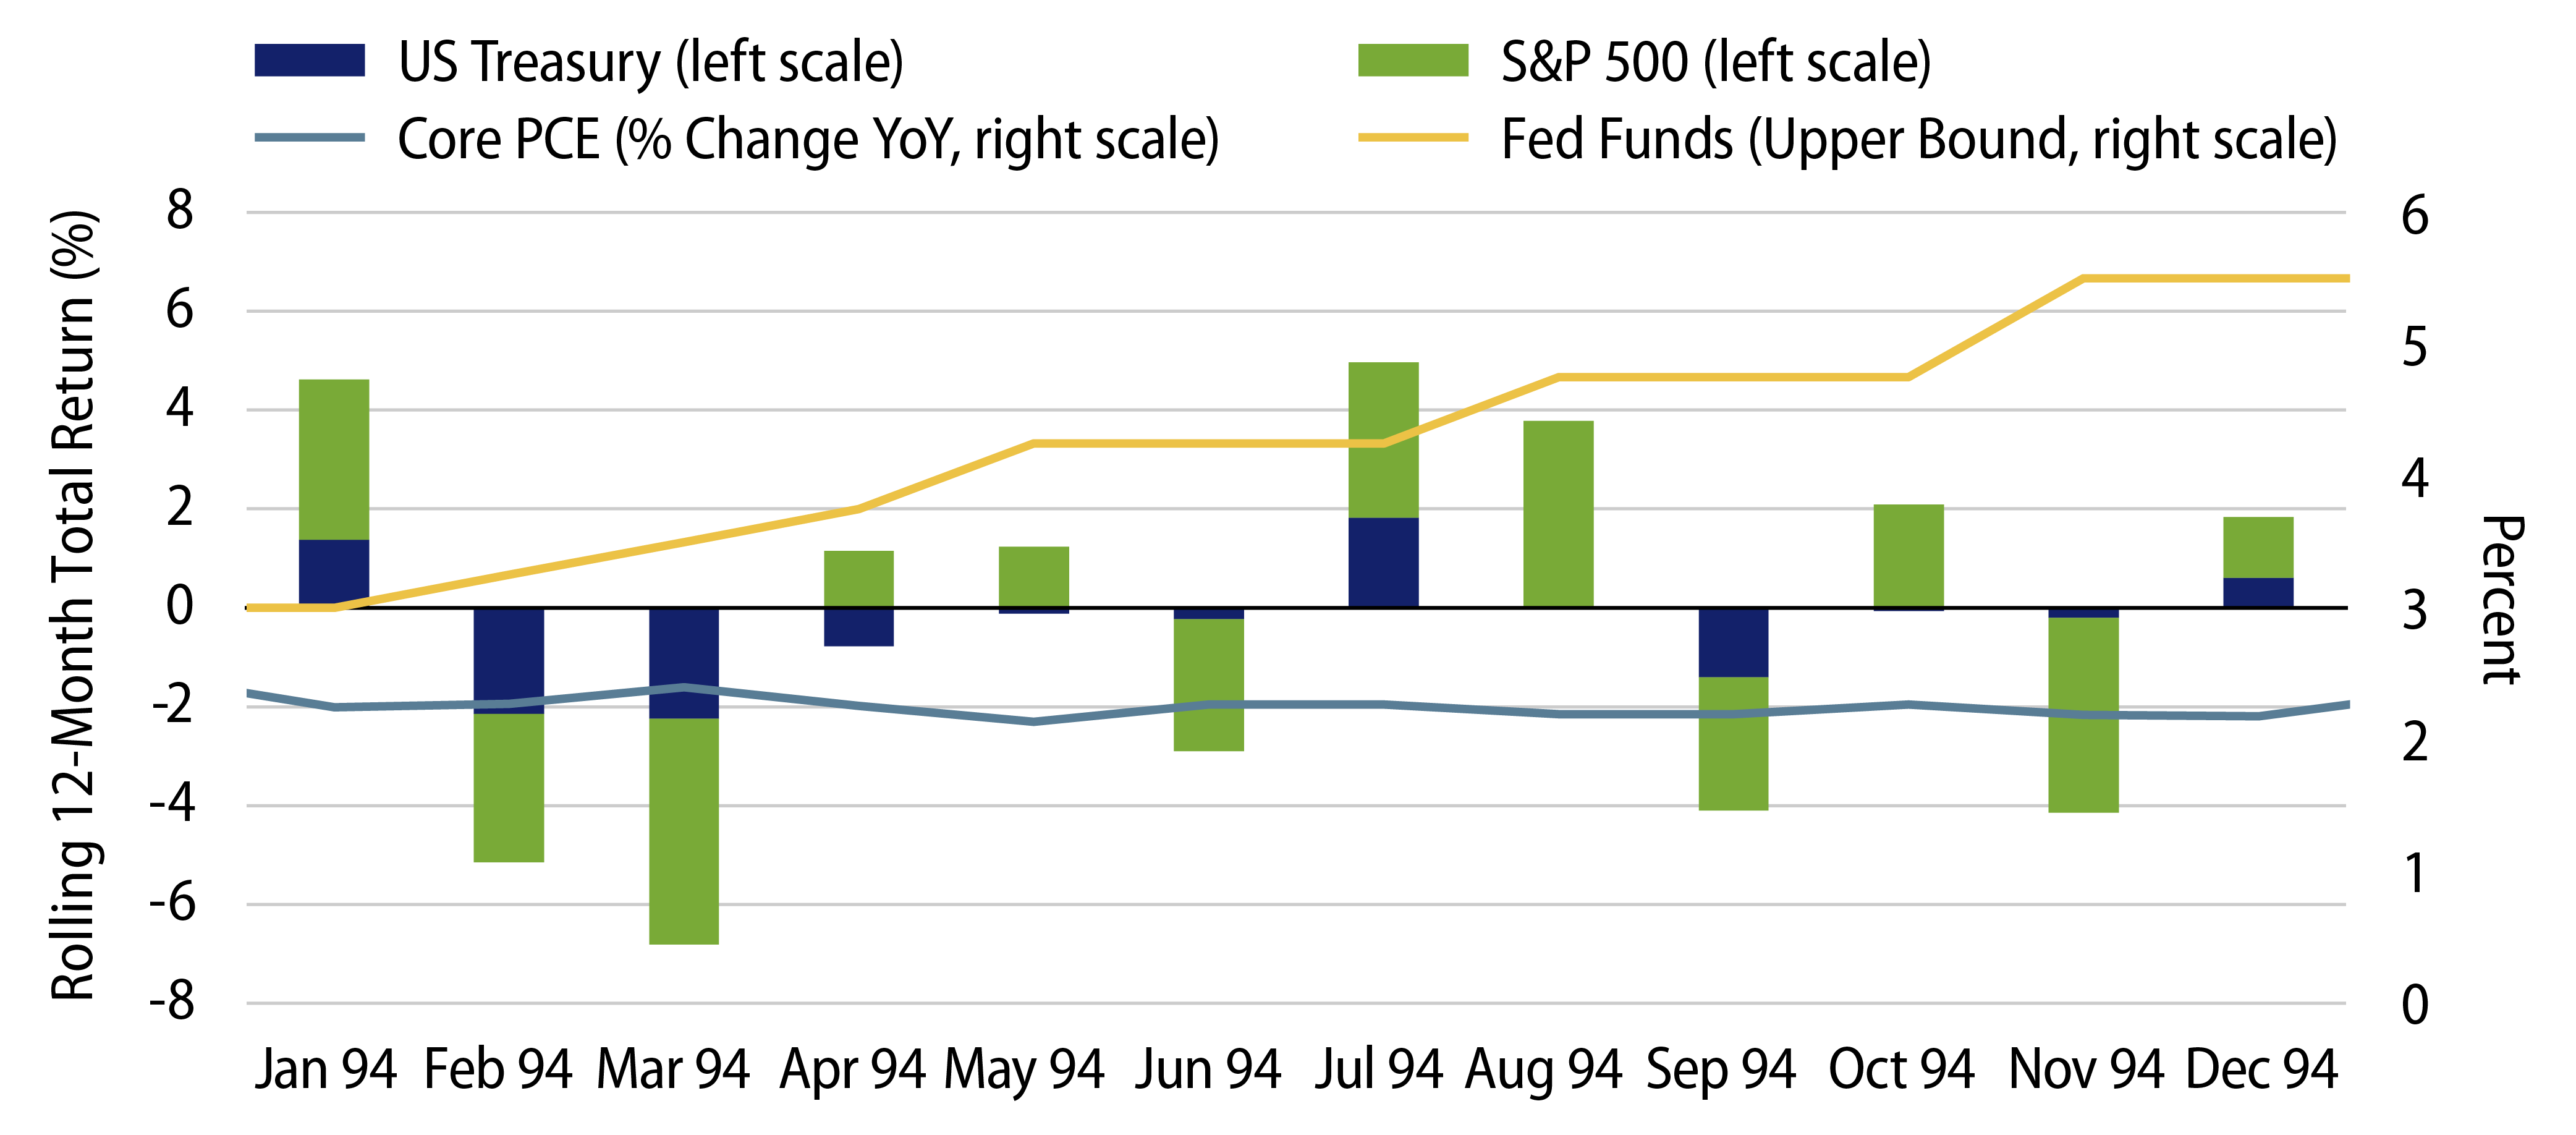
2. The Fed and other central banks drive interest rates meaningfully higher in nominal and real terms. Exhibit 6 shows that the first half of 1994 was a good example of this regime.
What Next for Diversification?
We expect that at least one or both of the macroeconomic regimes described above to end over the course of the next year; a moderation in inflation would help reduce the risk of weaker real returns from bonds. High levels of uncertainty act to deter investors from committing capital to financial markets. If interest rates also reach levels the Fed deems sufficiently restrictive to pause its active tightening policy, investors can return to fixed-income markets without the risks of the high volatility that prevailed throughout 2022. Consequently, we expect to see the correlations between bonds and equities revert to their historical (negative) relationship as shown in Exhibit 7.

Ultimately, the path of long-term interest rates is determined by inflation (Exhibit 8). Once official inflation data corroborate the decline in forward-looking inflation indicators, bonds can be expected to stage a meaningful recovery.