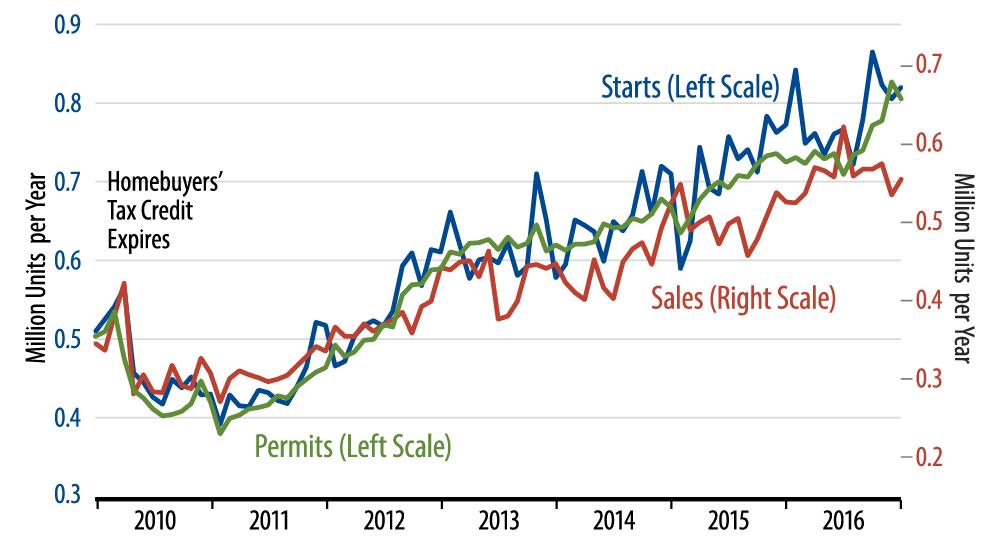
As seen there, while single-family starts levels have pulled back some from their October spike, even the lower recent levels remain well above the prevailing levels of 2016 (blue line). Also, lately permit levels have increased steadily to catch up with starts (green line). In contrast, new-home sales have held stubbornly flat over the last nine months (red line).
The relative scaling in our chart suggests that new-home sales are too low to support recent starts levels. This conclusion is affirmed by the fact that inventories of unsold homes have risen steadily over the last five months, to where inventories of unsold homes are equivalent to 5.7 months' worth of sales.
Regional data show recent new-home sales levels especially soft in the South, where sales have dropped 20.3% from their July peak level and 10.5% from their prevailing levels of mid-2016. The South is the dominant region for US homebuilding, accounting for more than half of all single-family construction, so the fact that sales in the South dovetail with national trends indicates that the recent sogginess in new-home sales is not a statistical fluke.
Now, we should emphasize that new-home sales are not weak per se. Again, they look about flat since last April 2016. The problem is that homebuilders have aggressively ramped up construction levels since then, and though they have built it, the buyers have not come (apologies to "Field of Dreams").
Homebuilding gave a nice lift to GDP growth in 4Q16 and is likely to repeat that boost in 1Q17. However, those boosts will not continue through the rest of 2017 unless buyer demand steps up in coming months.