For other data, we look at "control" or "core" measures—beneath the headline measure—mostly because of especially high volatility within the components excluded from the control/core measure. For housing, while it is true that multi-family starts are especially volatile, it is also true that single-family units generally involve much higher dollar-per-unit totals than do multi-family builds, which further increases the importance of the single-family starts measure.
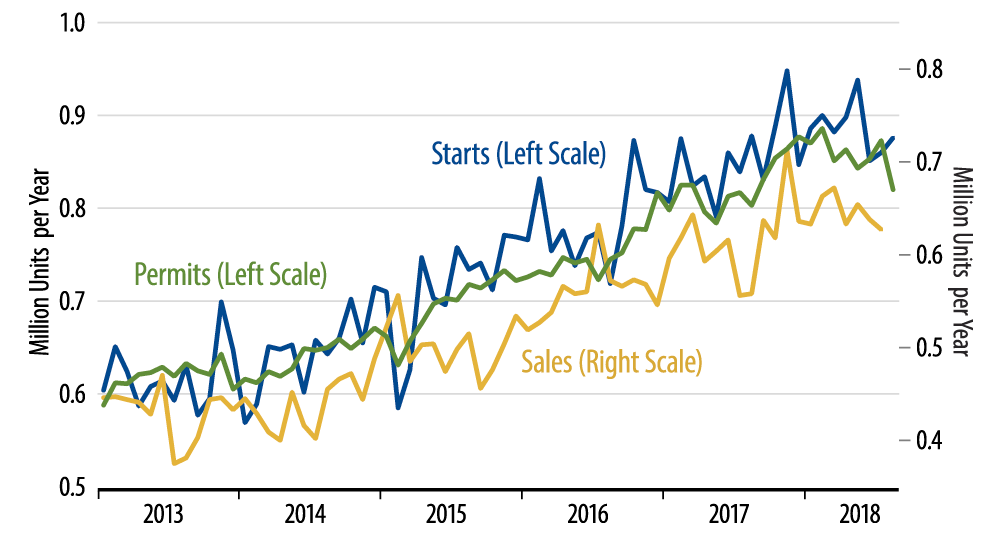
The chart shows single-family activity: permits, starts and new-home sales. All three have looked soggy lately, and today’s August data don’t change the picture. Again, the August gains leave single-family starts well below the levels prevailing between November 2017 and May 2018. Similarly, single-family permits have been trending down throughout 2018. And all through the last few years, new-home sales have failed to keep up with single-family builds, leading to rising inventories of new-home sales, which now stand at nearly six months’ worth of sales.
Meanwhile, despite a 29.3% (non-annualized) gain in August, multi-family starts still look to be on a downtrend. Here too, the August gains only partially offset declines over preceding months, and here too, multi-family permits have been declining steadily over the last five months, continuing this downtrend in August.
None of this spells doom for housing, and it probably has little import for home prices. Our focus is more on GDP growth, and the recent "pause" in homebuilding suggests that housing—and construction in general—will not provide any boost to GDP growth in the quarters ahead. In contrast, homebuilding boosted GDP growth by about 0.3 percentage points through much of the current economic expansion.