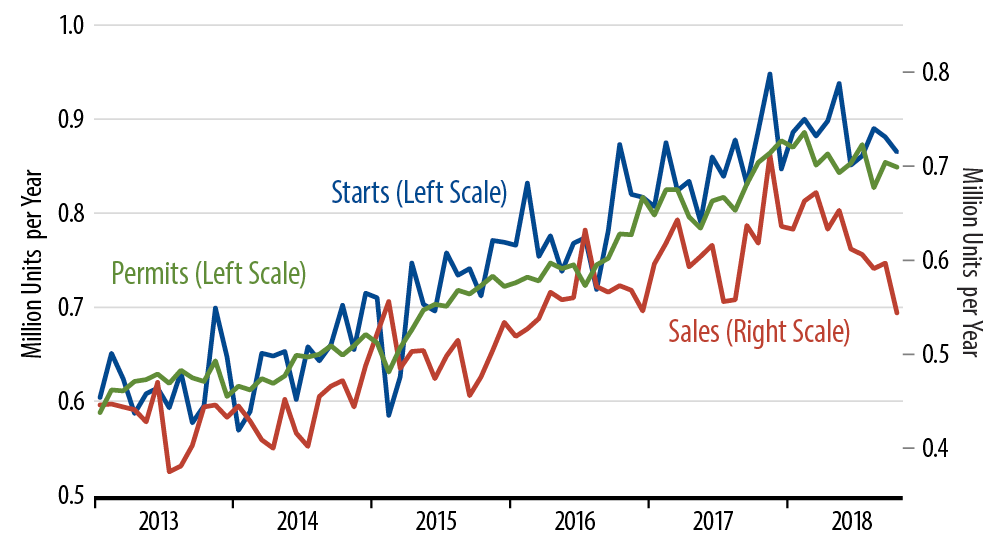
In fact, the chart shows downtrends for all three major indicators of single-family homebuilding: new-home sales, starts and permits. The 2018 downtrends in starts and permits had not looked to be clearly defined until recently, given the "head fakes" that these series had shown in early-2016 and early-2017. However, with continued softness through recent months, the downtrends there look more convincing, and the downtrend in new-home sales has looked convincing for a bit longer.
All regions of the country reflect this sales downtrend, including the South, which accounts for the majority of US homebuilding. Inventories of unsold new homes continue to rise and are now equivalent to 7.4 months’ worth of sales (compared to non-bubble norms of 4 to 5 months’ worth of sales).
For a few years now, our By the Numbers installments have cautioned about rising new-home inventories. Through most of that span, the word on the Street was that homes were—somehow!—in short supply. With the developments of the past year, that Street tune has changed.
The relevant question is how or whether all this will influence the Fed. There is no question that the FOMC has its back up for continued rate hikes. However, with recent manufacturing data looking sketchy, with the booming oil patch likely to pause, and with housing clearly trending lower—though admittedly at a modest rate—we are inclined to think the Fed will pull back on that fervor.