
Steady GDP growth in the Asia-Pacific region since the turn of the millennium has underpinned the secular development of fixed-income markets. This signifies a stark contrast to the market backdrop of the 1990s. At that time, in the face of persistent current account deficits, disproportionate reliance on equity financing and short-term bank borrowings contributed to the region’s financial crisis in 1997. Since then, in lockstep with the region’s lead in terms of global expansion, Asian debt markets have become a mainstream asset class. Specifically, there has been a radical transformation in the USD-denominated offering of investment-grade (IG) securities issued by Asian governments, agencies, corporates and financial institutions.
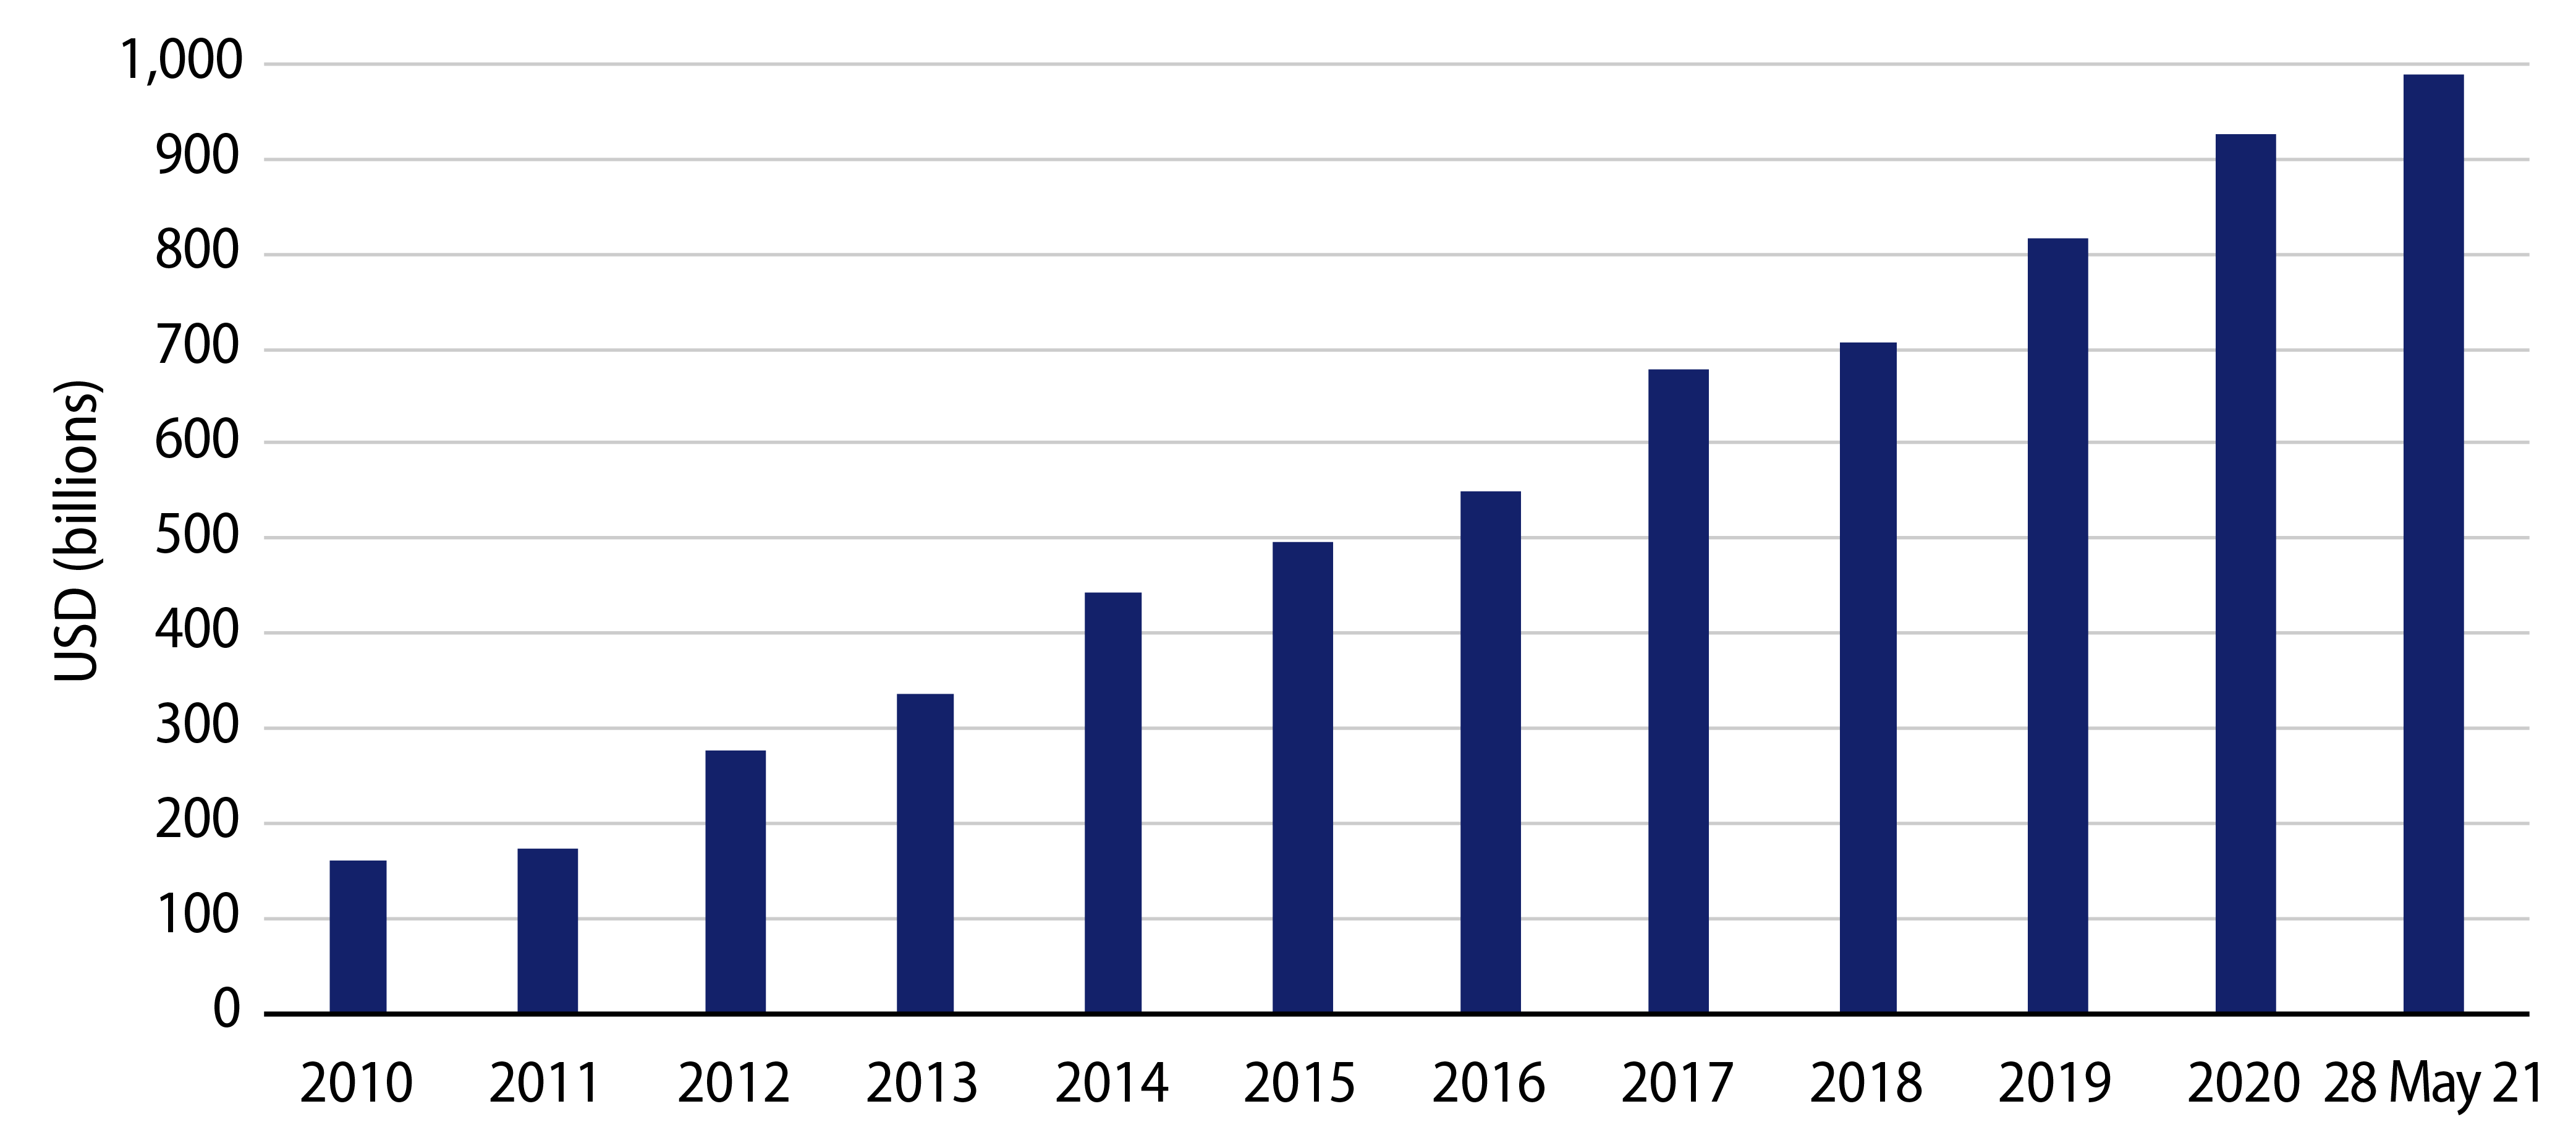
Based on the widely followed JPMorgan Asian Credit Index (JACI), IG bonds now account for 77% of the index, significantly higher than 60% a decade ago. Of the 16 countries in the JACI, 11 are IG-rated. Indeed, Asian IG is fast approaching the $1 trillion milestone, a far cry from $170 billion just 10 years ago (Exhibit 1). Today, there are more than 420 IG issuers with nearly 1,500 bond issues outstanding compared to less than 100 IG issuers with a little over 200 bond issues outstanding at the beginning of the last decade. Not surprisingly, the supply of JACI bonds has outpaced other emerging market (EM) geographies, with Asia accounting for roughly two-thirds of all EM IG new issues in the last five years.
We believe three features of Asian IG bonds make them appealing for the global investor.
1. Favorable Ratings
Since the trough of the late 1990s, the trajectory in sovereign ratings in Asia has been unambiguously positive. In the past decade, ratings for two countries—Indonesia and the Philippines—were upgraded to IG. Indeed, we would note the comparative stickiness in the IG ratings of Asia’s rising stars versus other EM regions, such as Brazil, South Africa and Turkey. More recently and despite the COVID-19 pandemic, we have not witnessed significant “fallen angel” downgrades. (This is in contrast with the recent case of Colombia.) While the quality bias within the JACI IG universe has admittedly whittled down over the last 10 years as a result of the inclusion of debut BBB rated bonds, securities that are rated in the A bucket or higher continue to account for about half of the IG universe since 2016.
2. Investor Sponsorship
Asia’s rising share in the high-quality bucket of EM indices makes it hard for dedicated EM investors to ignore. The region’s weight in the IG component of the Corporate Emerging Markets Bond Index (CEMBI) has surged to over 60% from about one-third in the past decade. Of note, Asian IG credits have also attracted crossover bids from global credit managers. Perhaps the most striking shift in demand has been the emergence of indigenous players as a result of the accumulation of surpluses with nearly 75% of Asian IG new prints being allocated to Asia-based investors over the last five years. In addition, the aging demographic shift, which has spurred the growth of insurance and pension business particularly in North Asia, has underpinned demand for high-grade duration. Indeed, the “home region” bias is strong enough for many IG companies to issue on a Reg S only format, which effectively excludes the participation of US investors.
3. Product Offerings
Prior to the financial crisis in the 1990s, Asia was only a marginal player within the universe of USD-denominated debt. The Philippines—rated non-IG at that time—was the only major sovereign issuer, while corporate issuances were narrowly centered on short-dated senior debt issued by government-linked entities in Hong Kong, Malaysia and South Korea. This is in sharp contrast to a broad range of IG issuers spanning across 11 countries and industries today. With the increase in new prints from China, we are also witnessing the introduction of various corporate bond structures—in addition to the direct issuance route—such as those with offshore SPV/onshore guarantee structures, with keepwell agreements or with a standby letter of credit from a bank. Furthermore, the menu of investment choices has now extended beyond bullet bonds with corporate perpetuals and their myriad “bells and whistles” features. And on the financial-issuers front, with the adoption of Basel III rules beginning in the earlier part of the last decade, we also began to see Asian banks issuing capital instruments such as Tier 2 bonds and Additional Tier 1 perpetuals with terms/structures that reflect the various banking regulatory regimes across Asia.
Attractive Valuations, Especially Versus Developed Markets
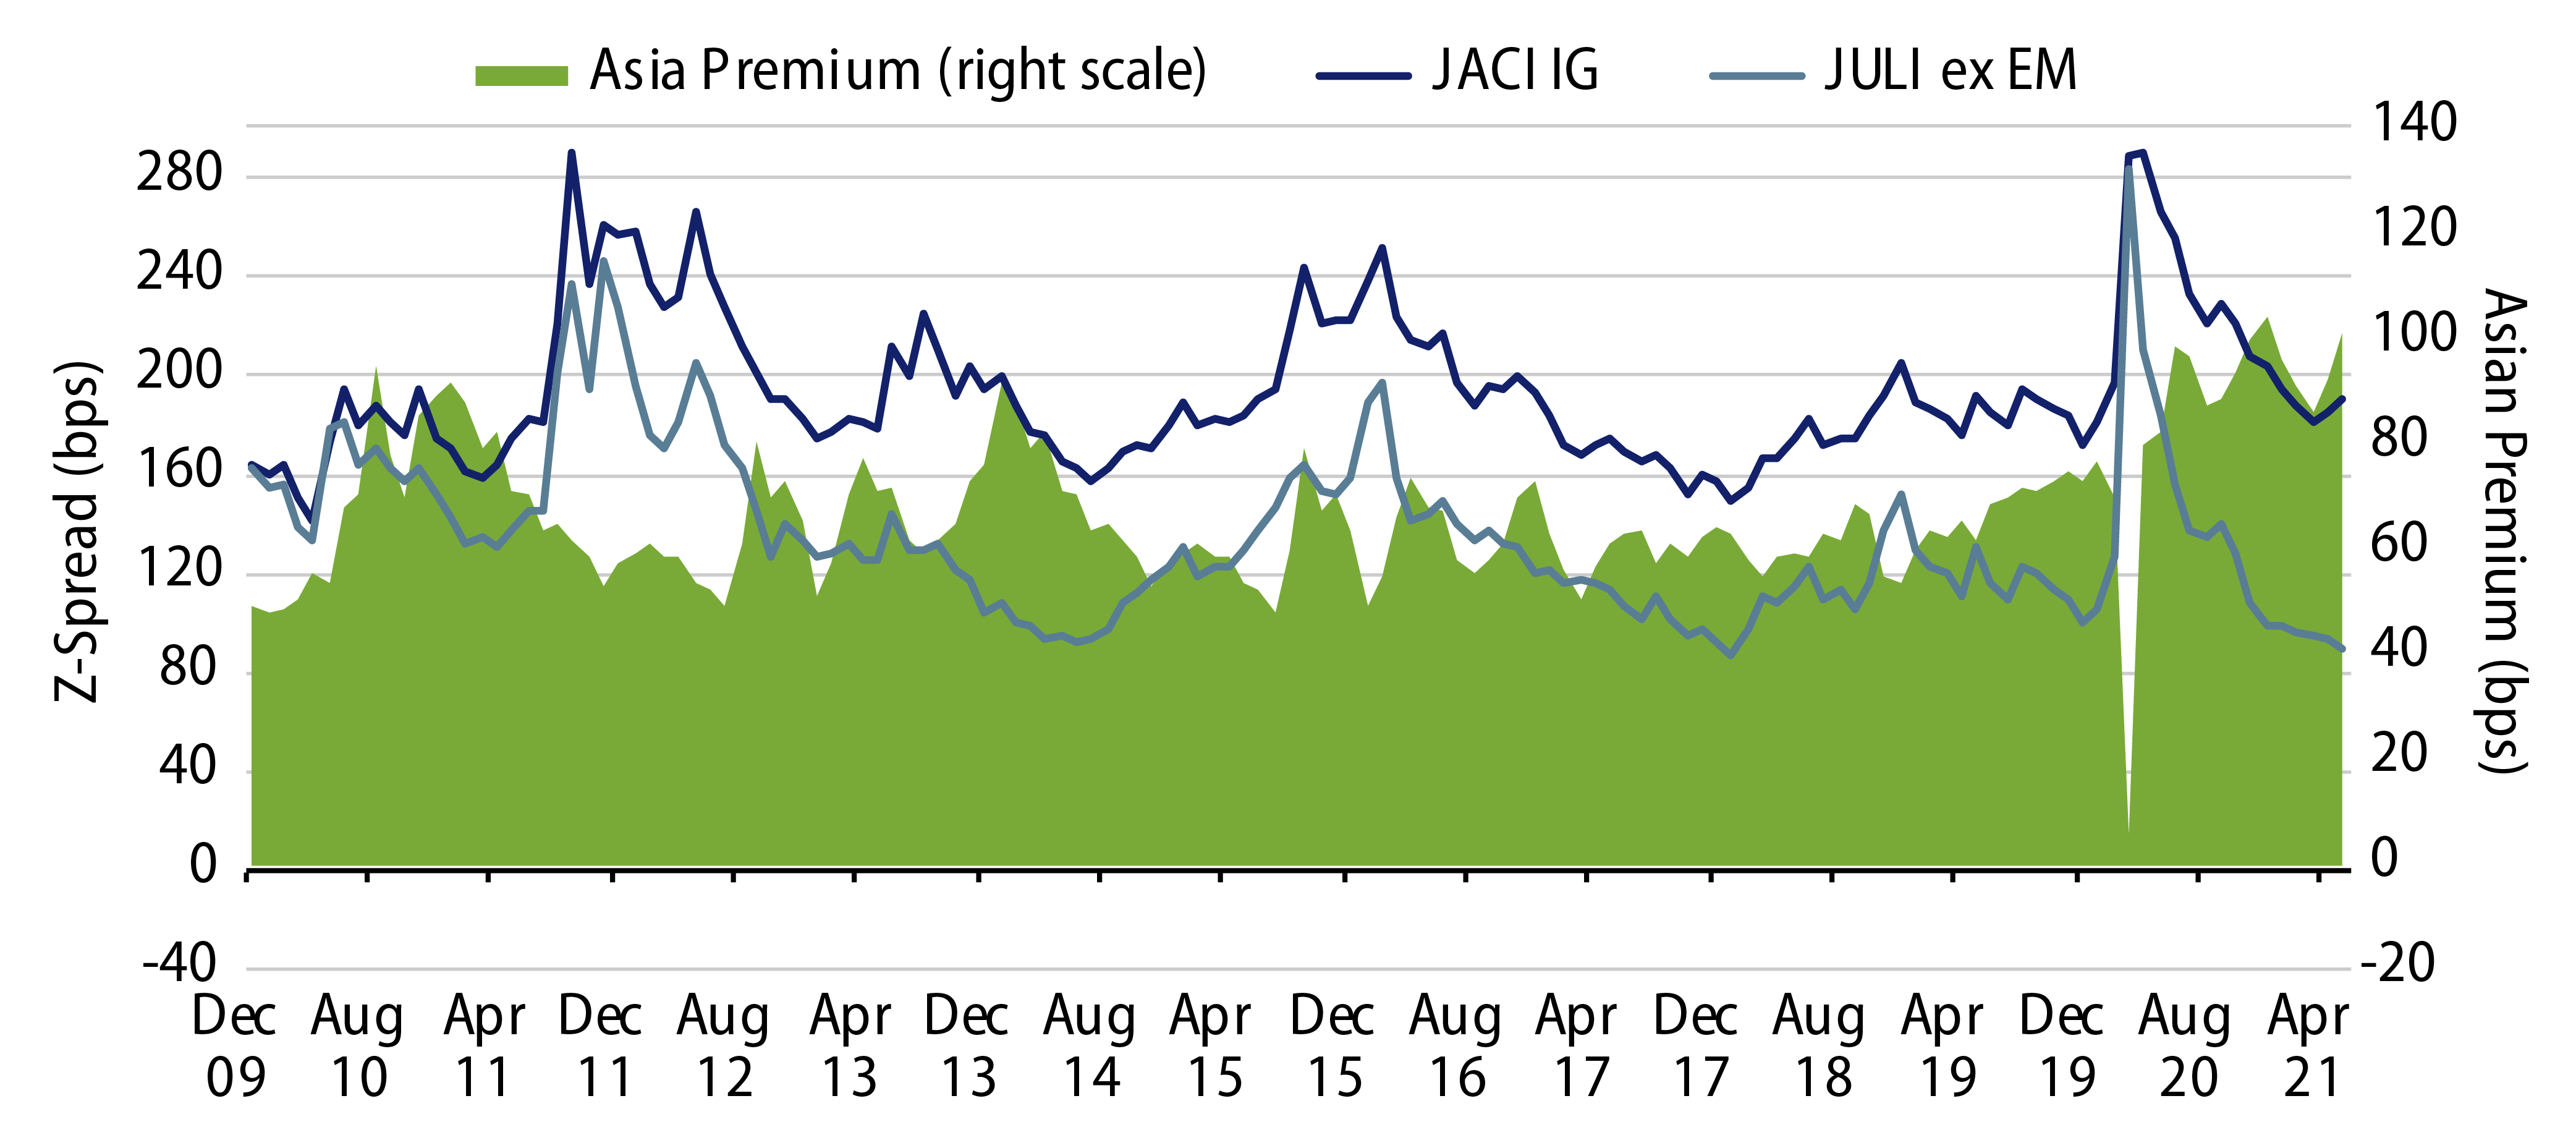
With developed market (DM) credit indices hitting multi-decade tights, we see relative value in Asian IG bonds. Spread on the JACI IG currently stands at 190 bps, off the most recent tights seen at the beginning of 2018 (Exhibit 2). Furthermore, we highlight that current JACI IG spread premiums over US IG credit indices, such as JULI Ex-EM spreads, are at decade highs with little in the way of credit fundamentals and credit ratings deterioration being explanatory factors. We would note that, for the global investor, in addition to the benefit of geographical diversification, an increase in allocation to Asian credits is consistent with the favorable post-pandemic outlook for the region’s GDP growth.
Too Large to Ignore?
From an investment standpoint, the upshot is that Asian IG credits provide a unique blend of value and diversification for the global investor seeking to express a constructive fundamental view on the region. In addition, market technicals have improved over time, with the investor base dominated by long-term, buy-and-hold players. With a market cap of almost $1 trillion, we believe there is significant scope for active managers to cherry-pick high quality credits that should be positioned to withstand the vagaries of the boom-bust cycles of financial markets. With Asian IG investments that are appropriately customized, calibrated and actively managed, we believe the credit investor has the opportunity to be rewarded over longer time horizons.