
Recent trends in investor behavior point to overwhelming interest in cash or cash-like investments. This sentiment is particularly understandable considering 2022 offered poor returns across most asset classes. While central banks were aggressively reversing years of easy monetary policy in 2022, the S&P 500 Index and Bloomberg US Aggregate Bond Index were down 19.4% and 13.1%, respectively, with bonds providing none of the diversification benefit investors had traditionally relied upon. A byproduct of this unique environment, which extended into 2023, is that yield has returned, specifically to cash investors. While most ordinary bank savings account rates are not attractive, with a national average of just 0.62% APY1, flow data shows widespread appeal for Treasury bills (T-bills), CDs, money markets and similar accounts2, which directly benefit from higher policy rates, are currently above 5%. Having enjoyed higher returns on cash-like instruments, what is the likelihood for this trend to continue? More importantly, what should investors consider going forward regarding cash and cash-like investments?
First, broadly speaking, cash-like investments are notably poor performers relative to other asset classes. In fact, when looking at the returns of nine major asset classes going back to 2000, cash is the worst performer in eight calendar years, or 36% of the time, while only posting the best performance in two calendar years, or 9% of the time.3
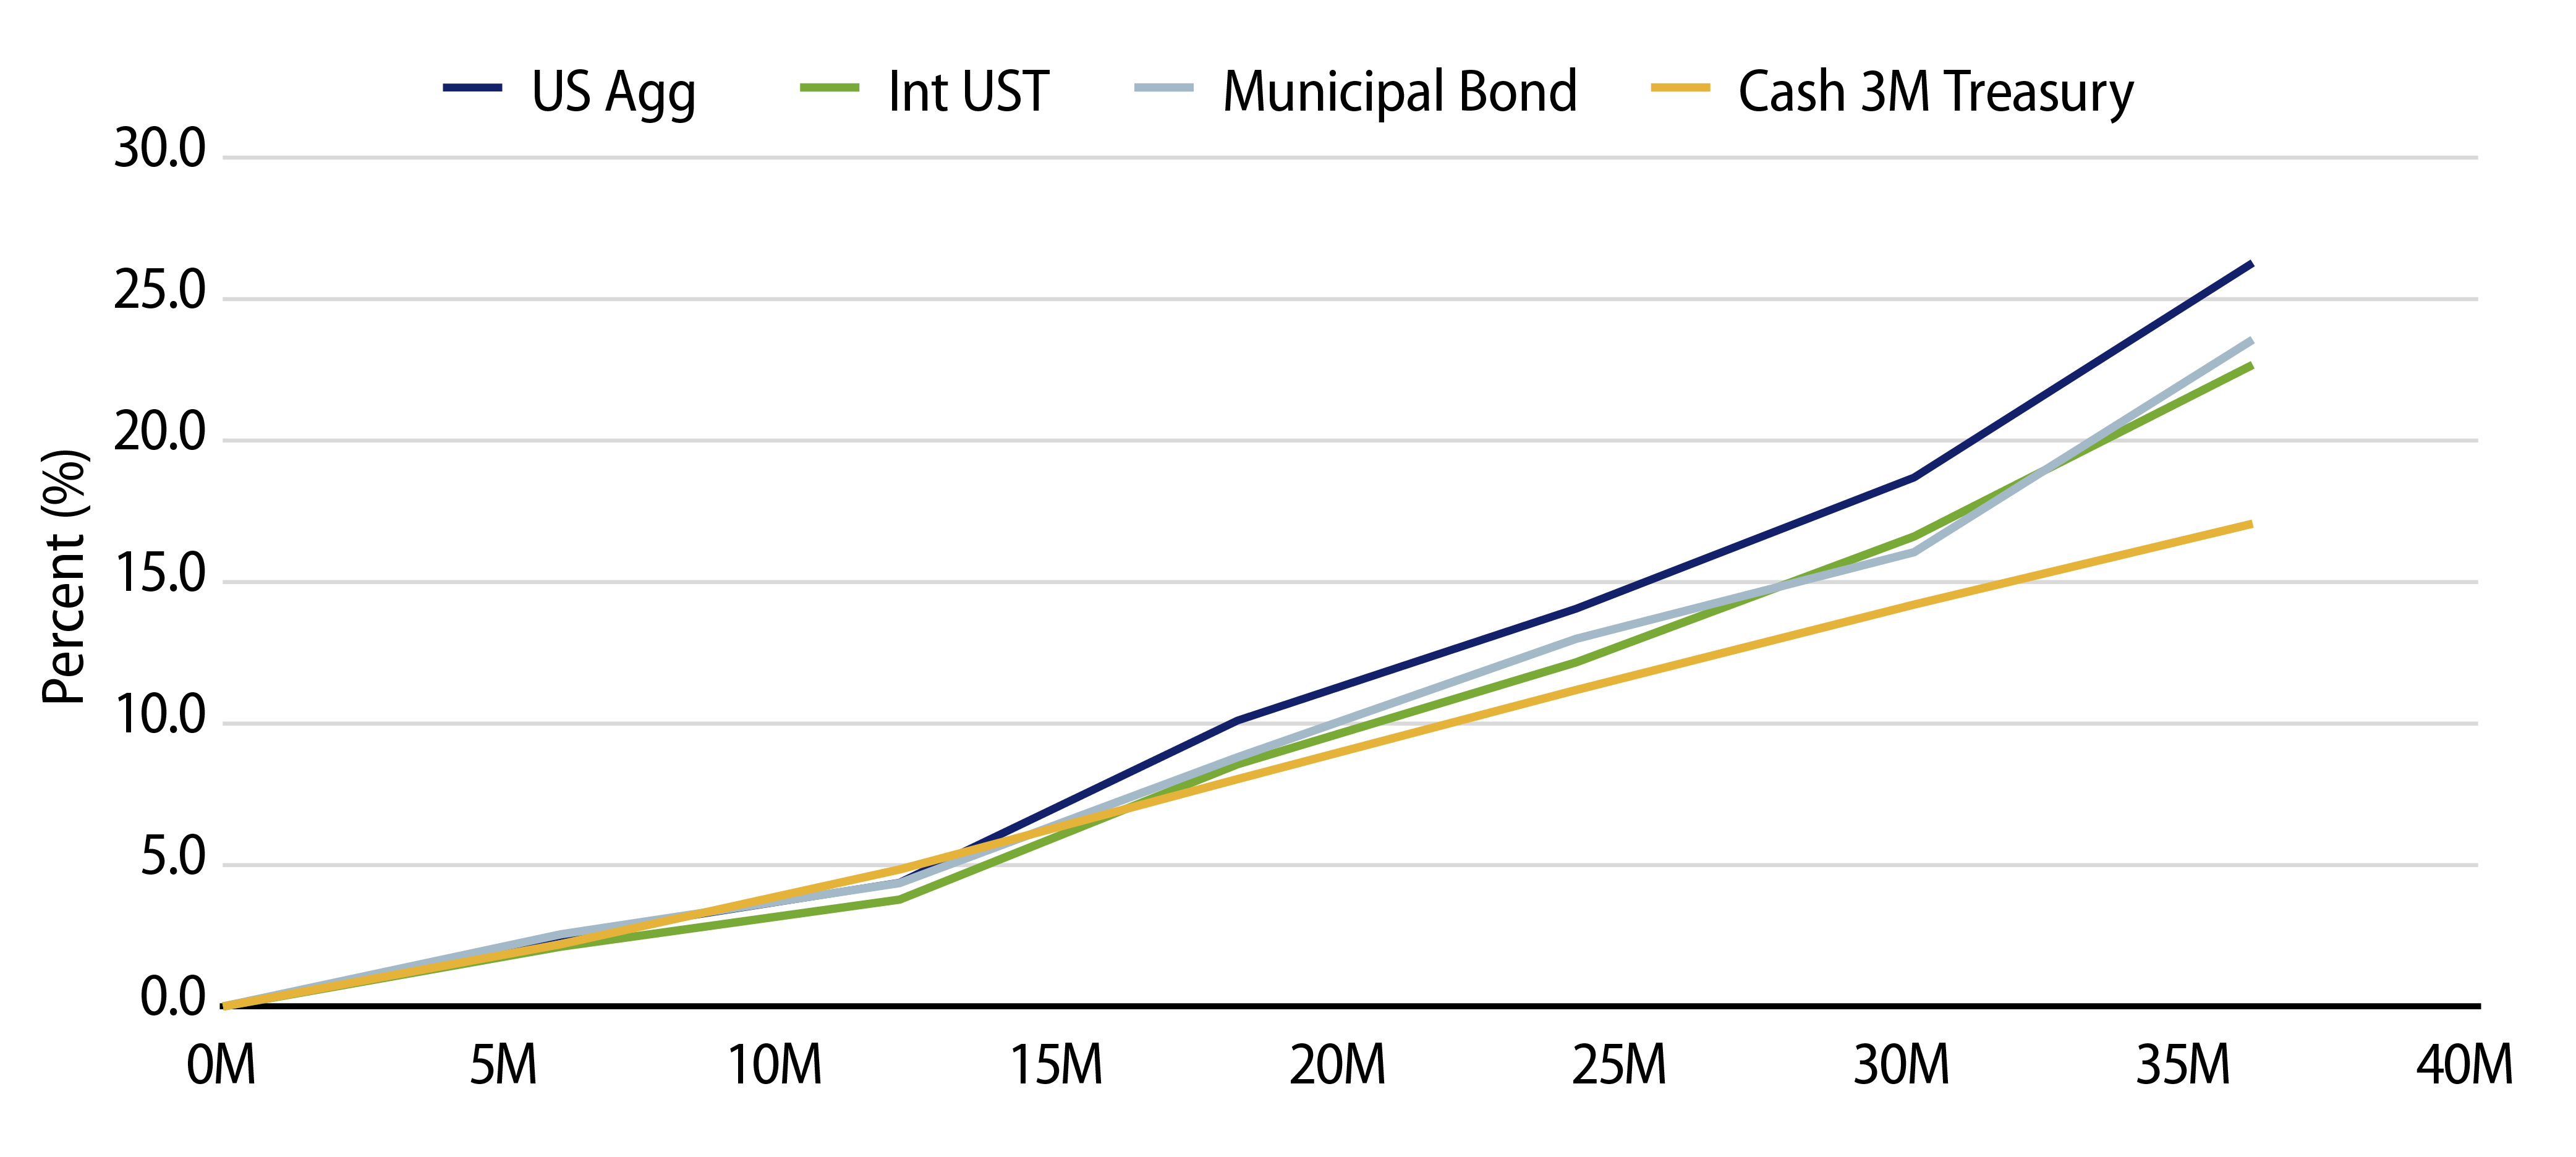
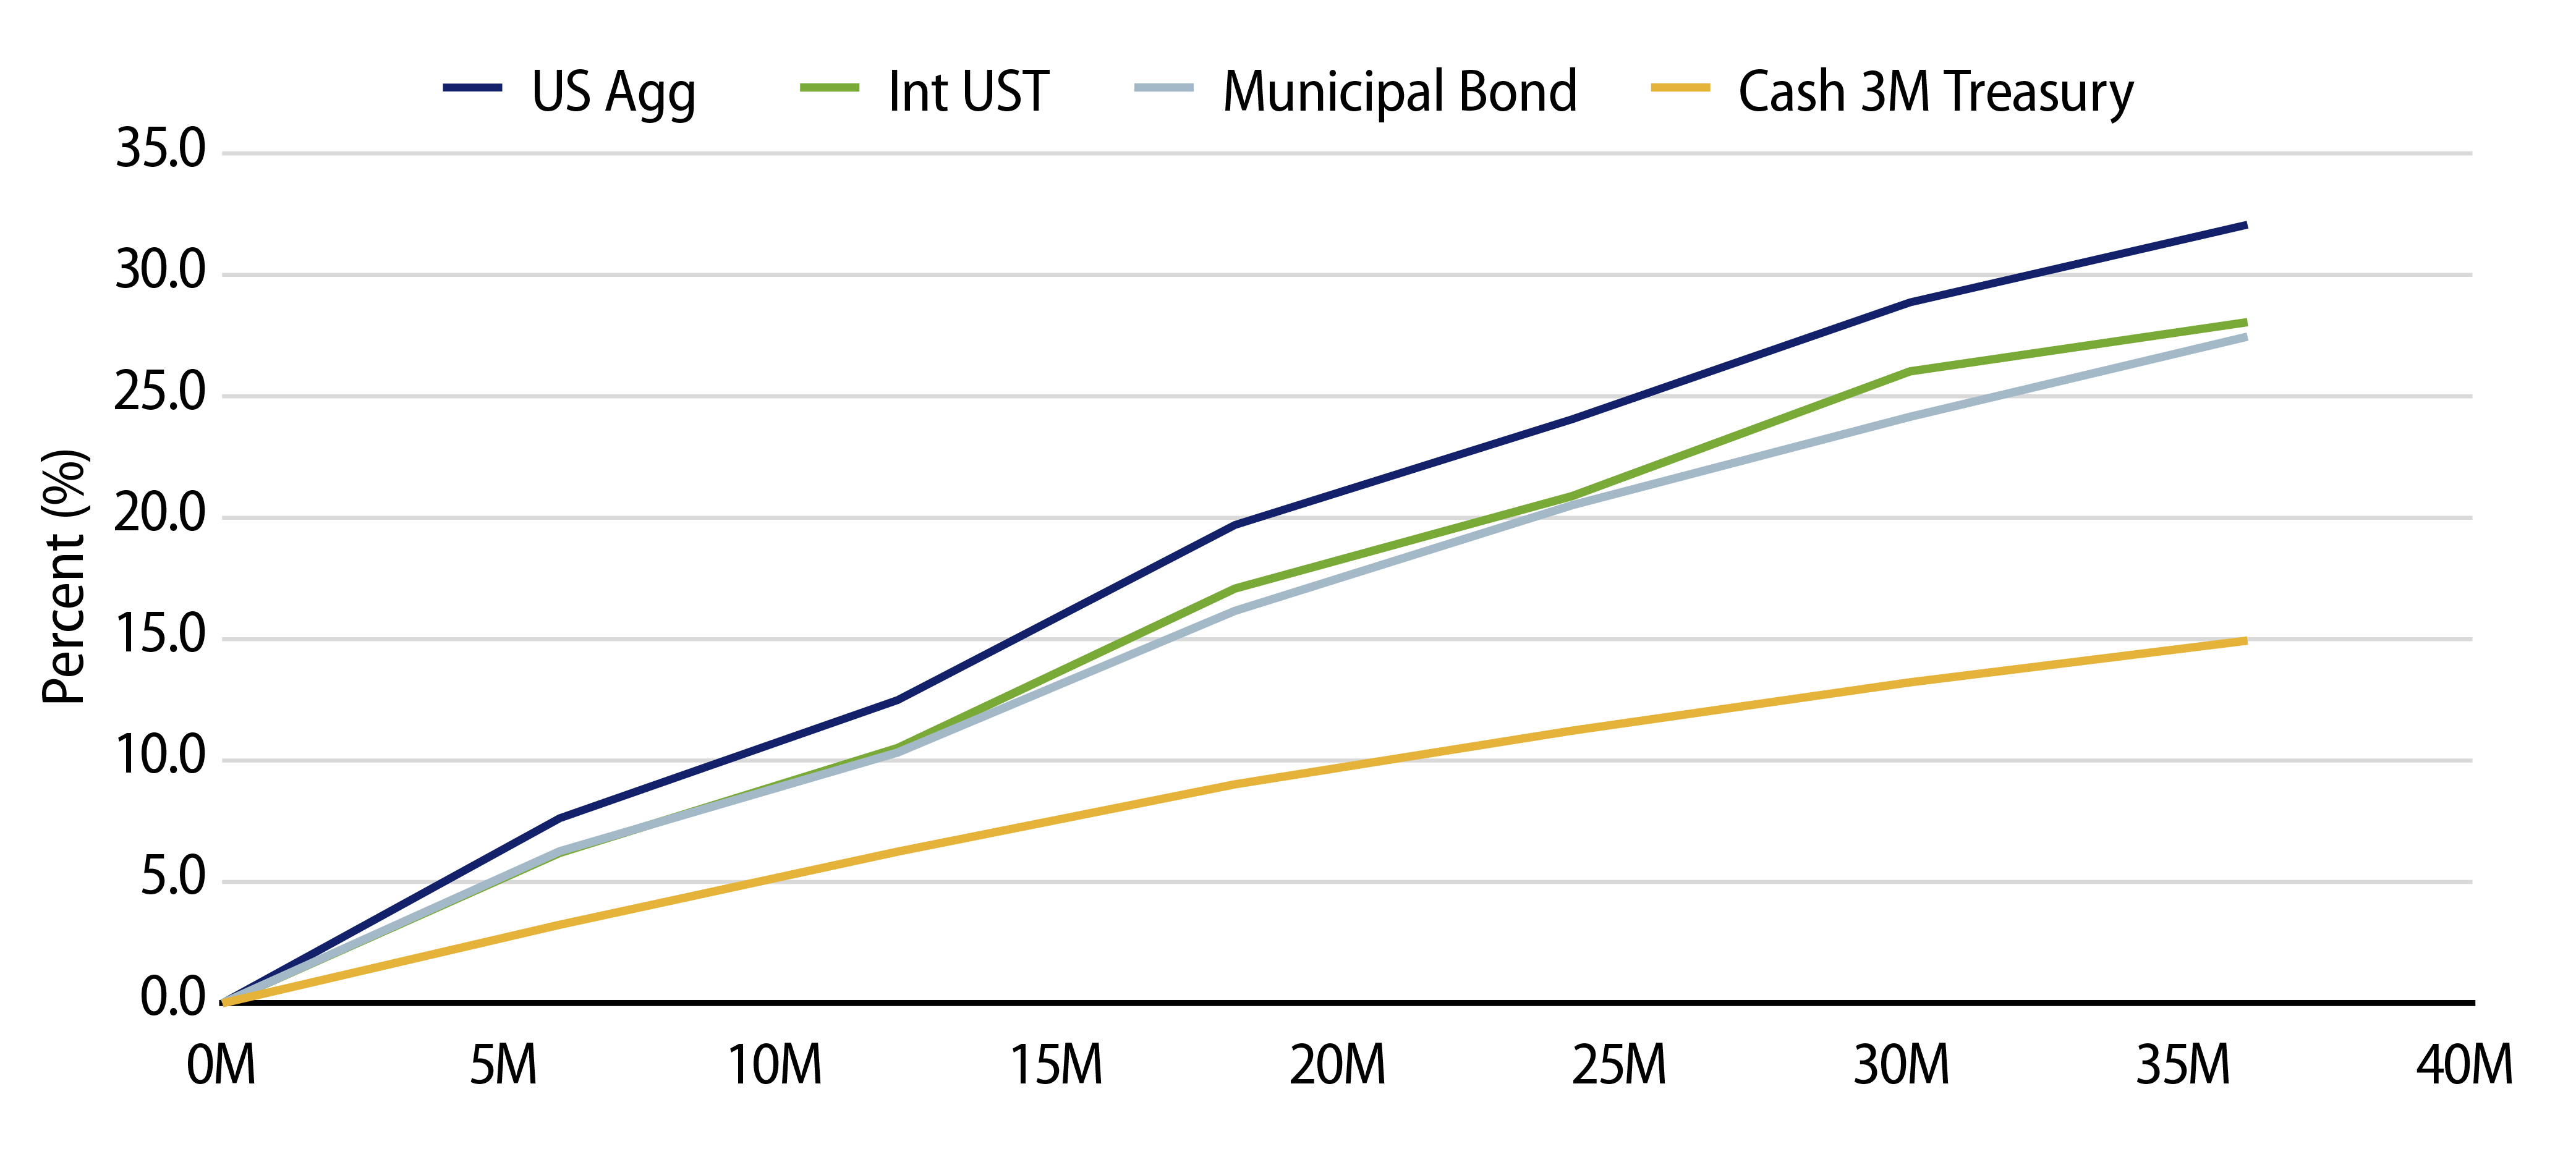
Perhaps more relevant to today’s environment, let’s explore the performance of bonds relative to cash during the past six Federal Reserve (Fed) rate-hike cycles. Despite periods of early underperformance, bonds generated substantially better returns than cash if an investor stayed the course over a three-year period, beginning with the first-rate hike (Exhibit 1). If isolating returns from the last rate hike, cumulative performance of bonds nearly doubled cash returns within six months, a trend that continued over the following three-year period. Last, an investor would have sacrificed up to 40% of the three-year return if waiting 12 months before rotating from cash into bonds (Exhibit 2).
The second thing to consider is that market timing is rarely an effective strategy, and current tactical cash allocations are no different. To illustrate, we analyzed a 60/40 portfolio (60% equities/40% bonds) versus a 60/40 portfolio using cash instead of bonds, for every month from December 1999 through November 2022. After each one-year period passed, we checked back to see which portfolio performed better. It turns out that over this nearly 23-year span, it would have benefited an investor to hold cash rather than bonds just 28% of the time (almost exclusively during periods of policy tightening). If we were less tactical and simply held a 60/40 portfolio with bonds during those same periods, a pure cash allocation would have outperformed 7.6% of the time. To summarize, if an investor precisely timed their tactical asset allocation changes to optimize returns, it would have resulted in outperformance less than 8% of the time (21 out of 276 months) since 1999.
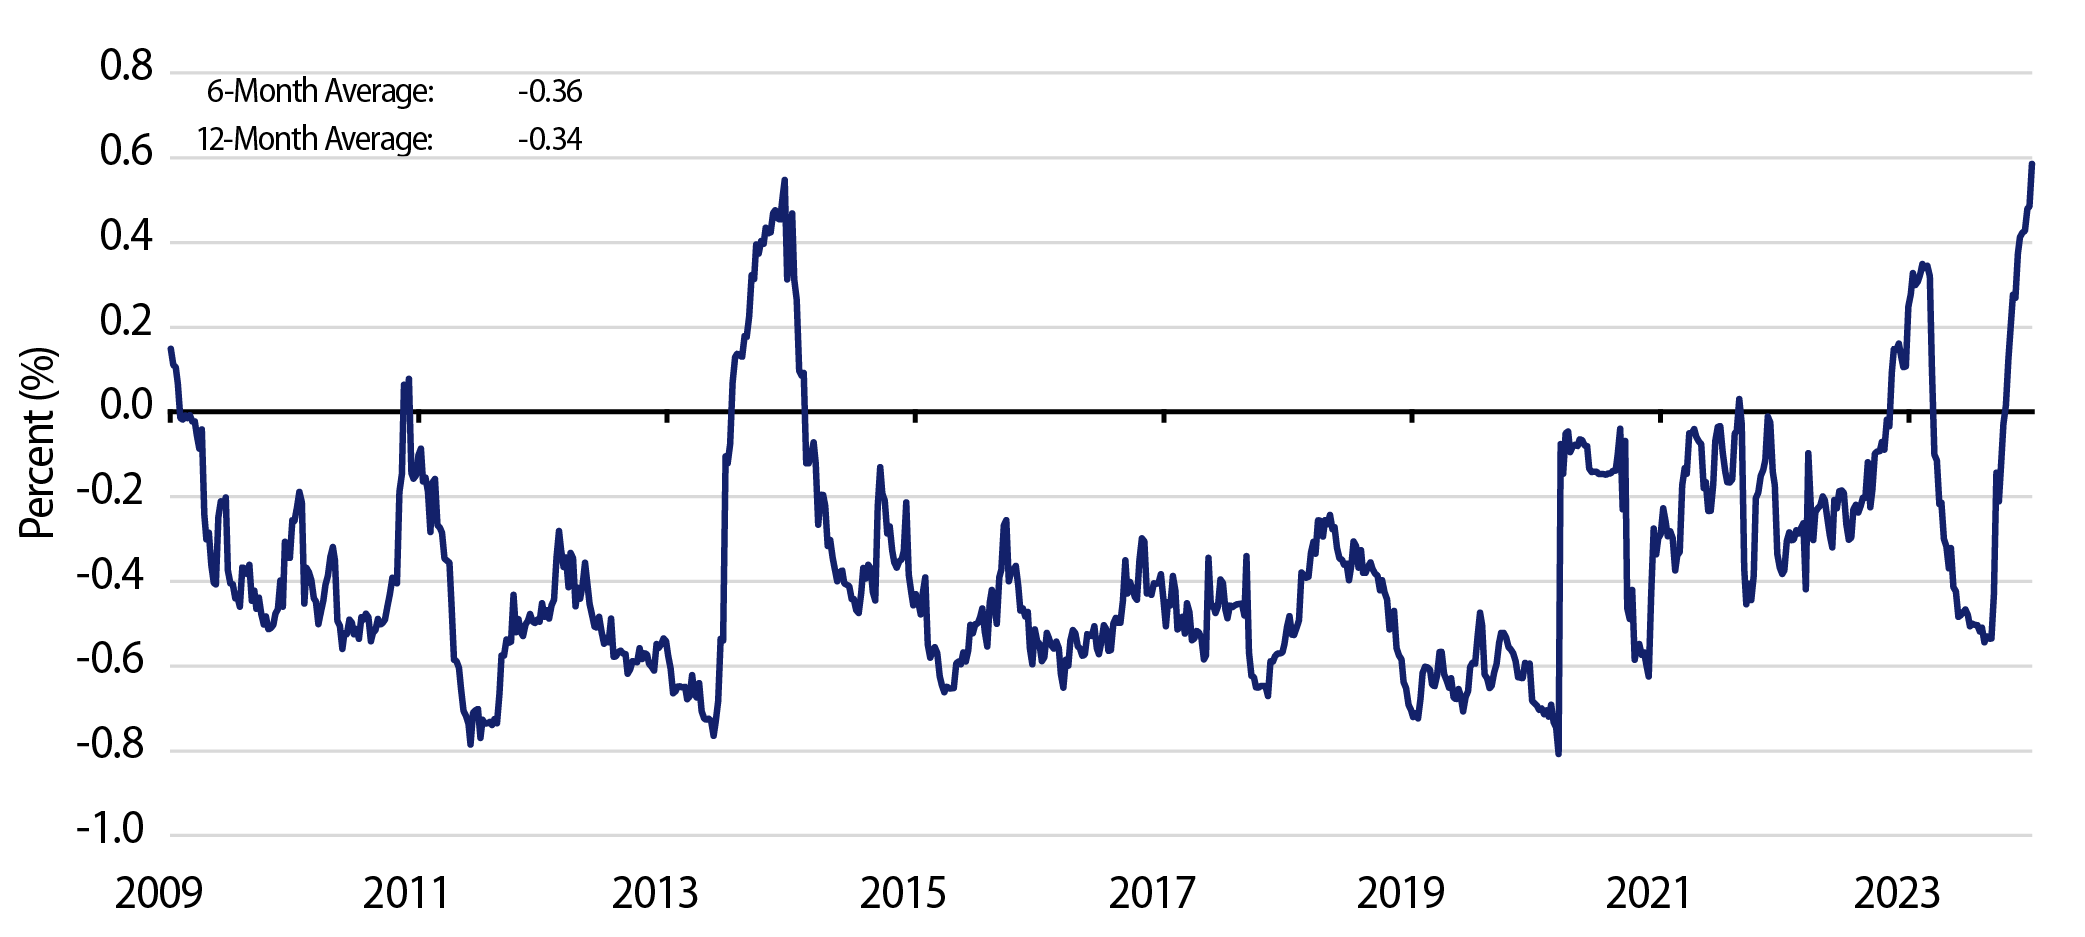
Third, one of the most important considerations relates to diversification. When investors decrease an appropriate fixed-income allocation without proportionally reducing their equity exposure, the resulting effect can increase risk by diminishing the traditionally helpful effects of diversification through negative correlation. Exhibit 3 shows how bonds have been negatively correlated to equities, whereas cash has been nearly uncorrelated. Negative correlation is better than zero correlation because it can offset risk rather than diluting it.
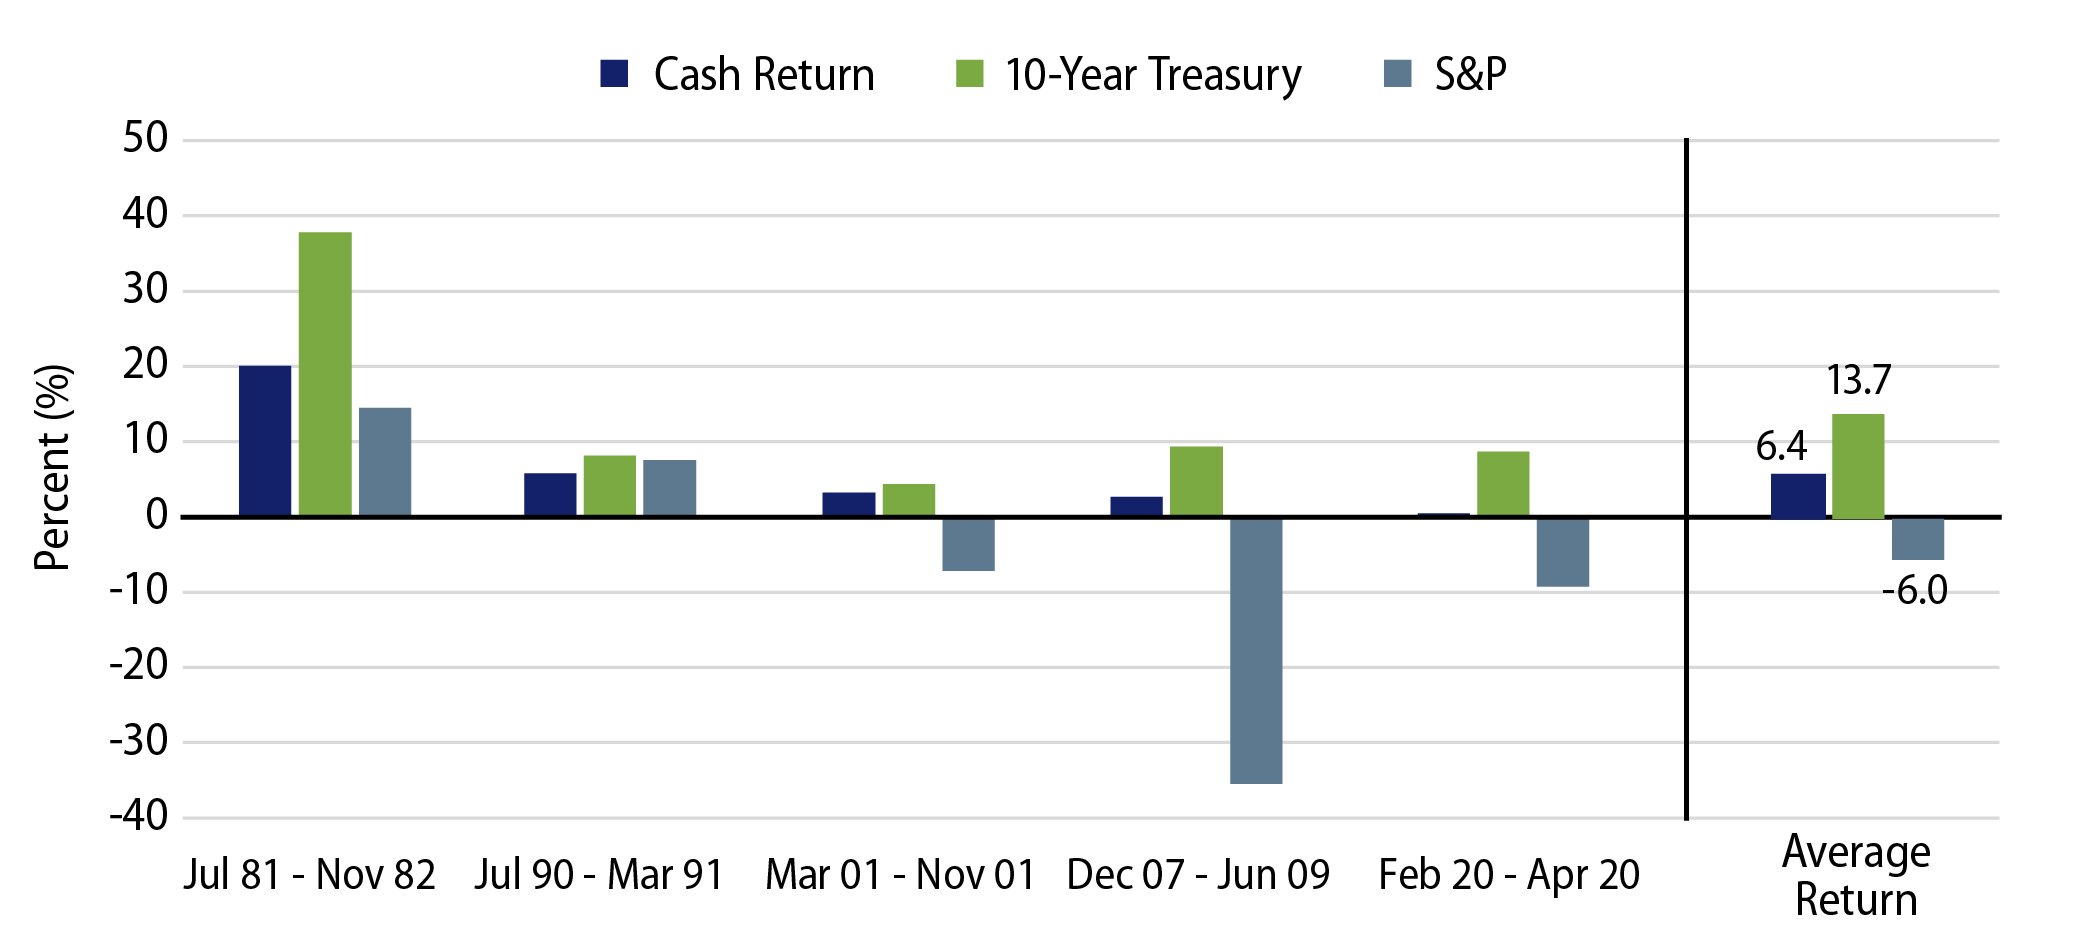
To continue, by moving assets from bonds to cash, one leaves the resulting investments more heavily concentrated in equities, potentially increasing risk and decreasing risk-adjusted performance. This relationship is often quantified through various risk-adjusted measures such as Sharpe ratios or Calmar ratios, for example. But perhaps one of the more meaningful proof statements can be found in historical performance during recessions. Exhibit 4 represents the last five US recessions and demonstrates the importance of bonds as both an offset to equity risk and meaningful source of return relative to cash, with the average cumulative return for bonds, once again, doubling the return on cash.
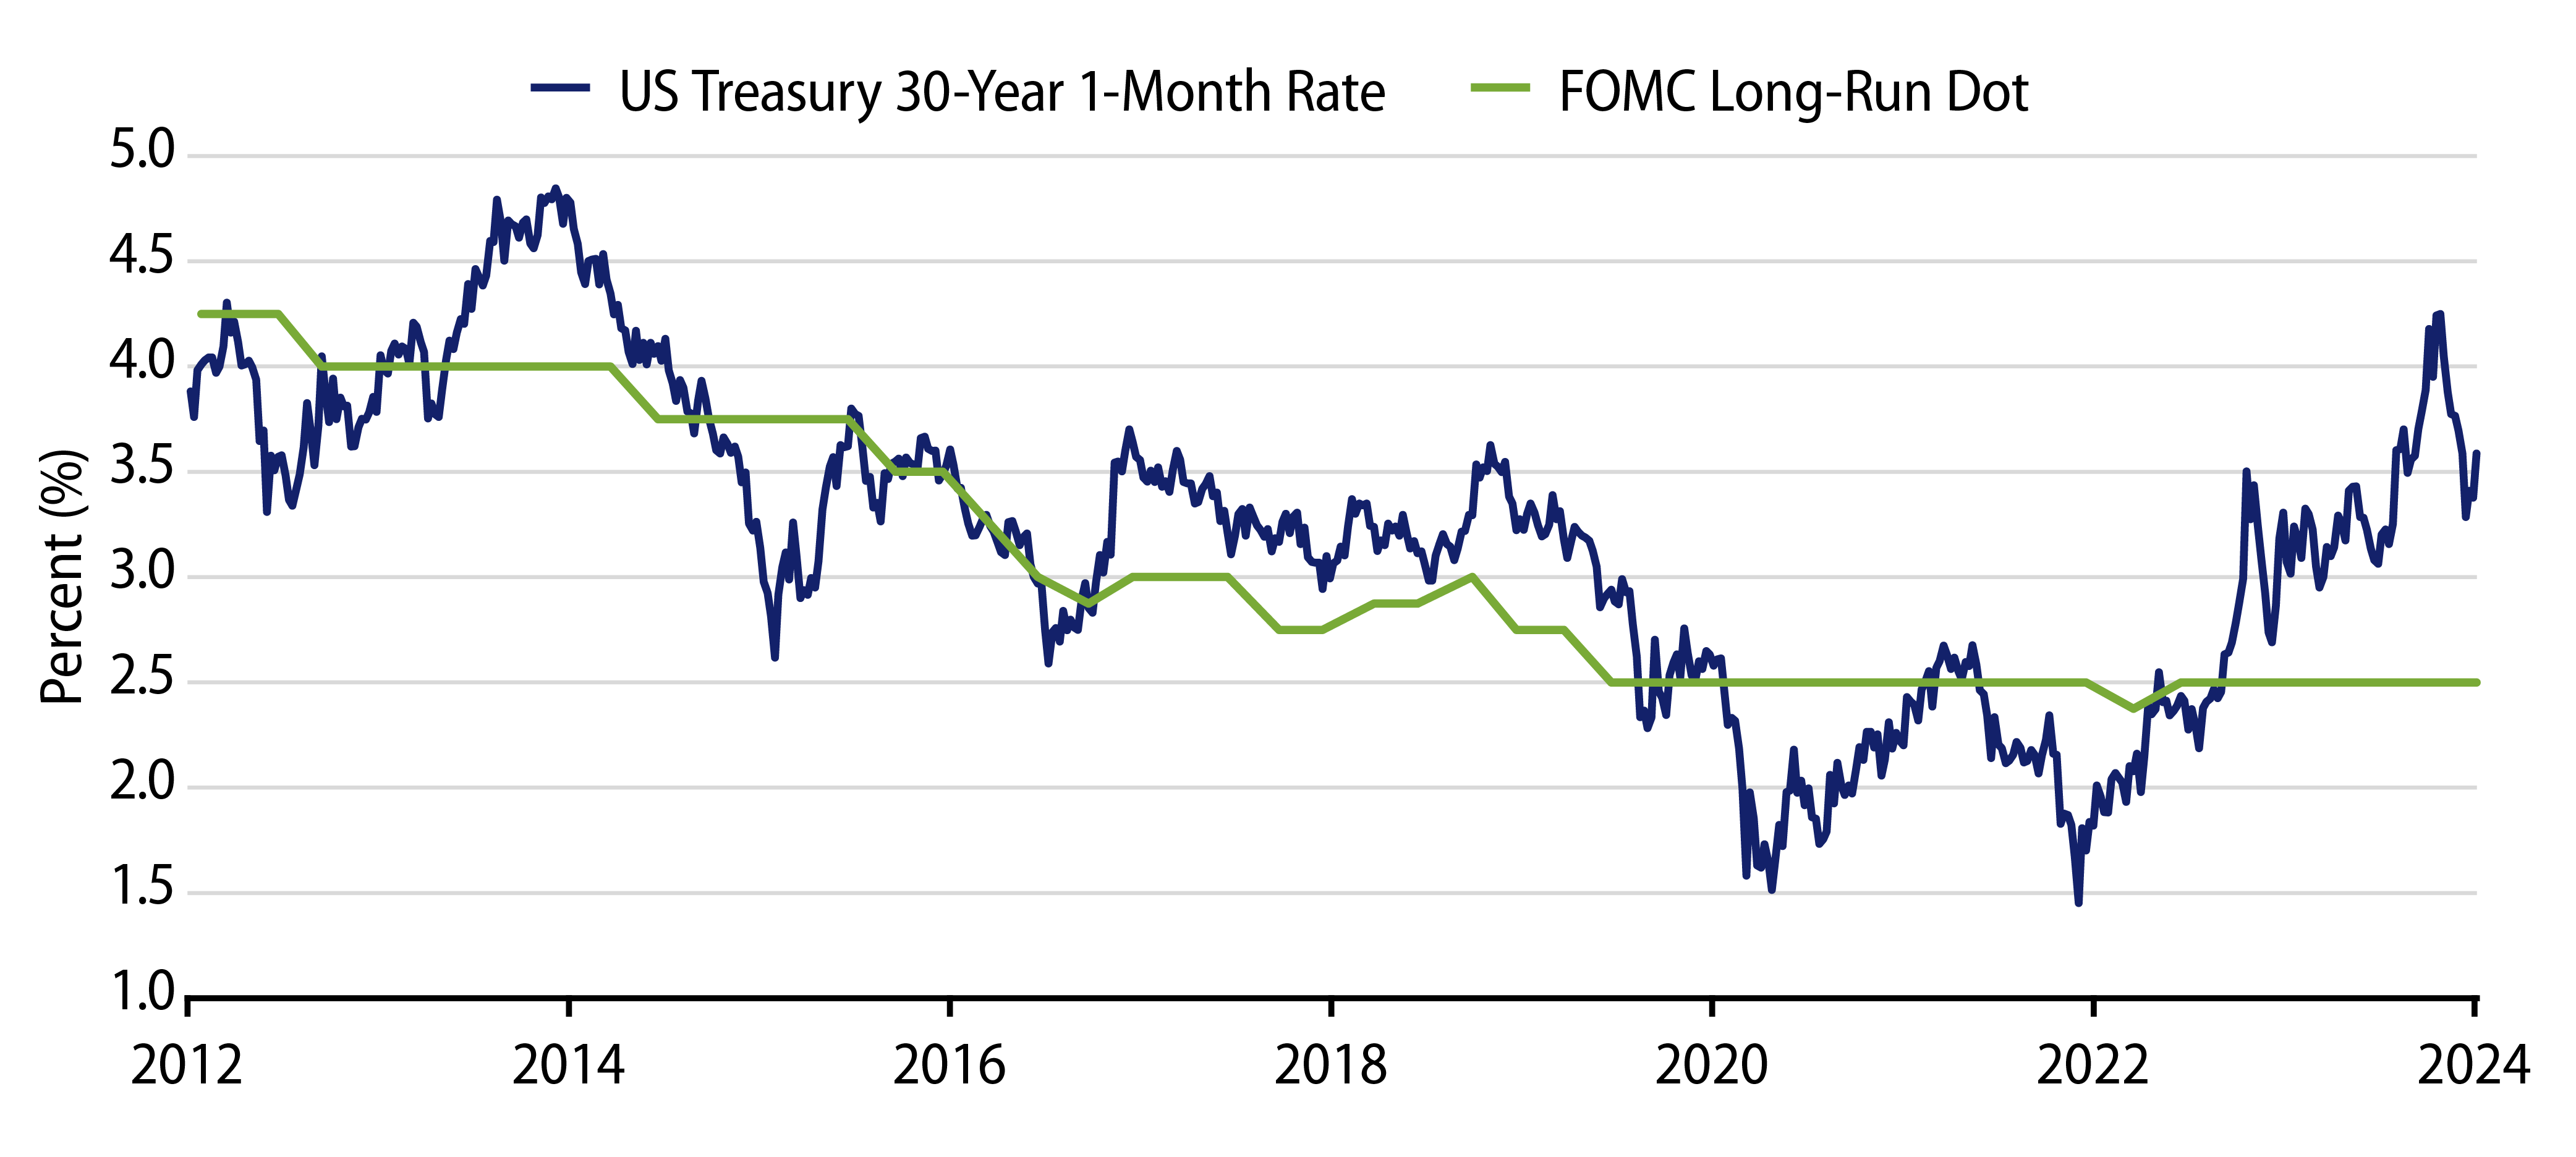
The last consideration for investors, and perhaps the most obvious one, speaks to the path forward, or to reinvestment risk. Generally speaking, investors in longer-dated bonds will require compensation for various risks such as inflation expectations, interest-rate uncertainty and economic factors. As a choice, investors can either decide to include cash equivalents (T-bills, CDs, money markets, and so forth), or invest in longer-dated fixed-rate bonds. In today’s market, real rates, forward curves and at times term premia models, point to an advantage in owning bonds as compared to cash equivalents, particularly as the Fed reaches terminal rates. Moreover, expectations of lower policy rates stemming from economic factors are reinforced by past Fed actions. Historically, the Fed has decreased rates by approximately 100 basis points (bps) within a year of concluding a rate-hike cycle, and by around 200 bps upon initiating the first cut (average of the last six rate-hike cycles).4 Exhibit 5 illustrates the forward curve for 30-year US Treasury (UST) rates relative to estimates for the fed funds rate from the Fed’s December 2023 Summary of Economic Projections (SEP). If current estimates hold true, there is likely to be a clear winner in the reinvestment argument once more.
At Western Asset, we continue to believe the uneven disinflationary process will continue its path downward toward the Fed’s 2% inflation target. As John Bellows articulates in our latest Fed policy meeting update, Does the Fed Rate Need to Be So High?, we do not believe that policy rates need to remain elevated to be considered restrictive. More importantly, the impetus for current levels may no longer be appropriate. While updated measures of inflation and growth do warrant that policy leans more toward neutral, we recognize there are a wide range of expectations for interest rates by a variety of market participants. Regardless of the magnitude or timing of policy easing, we believe there’s a real opportunity for bonds to provide attractive risk-adjusted returns, to serve as a proper diversifier and to outperform cash-like investments.
ENDNOTES
1. https://www.bankrate.com/banking/savings/average-savings-interest-rates/#:~:text=The%20national%20average%20yield%20for,ll%20earn%20on%20your%20savings
2. https://fred.stlouisfed.org/series/MMMFFAQ027S
3. https://www.callan.com/periodic-table/
4. https://www.federalreserve.gov/monetarypolicy/openmarket.htm