
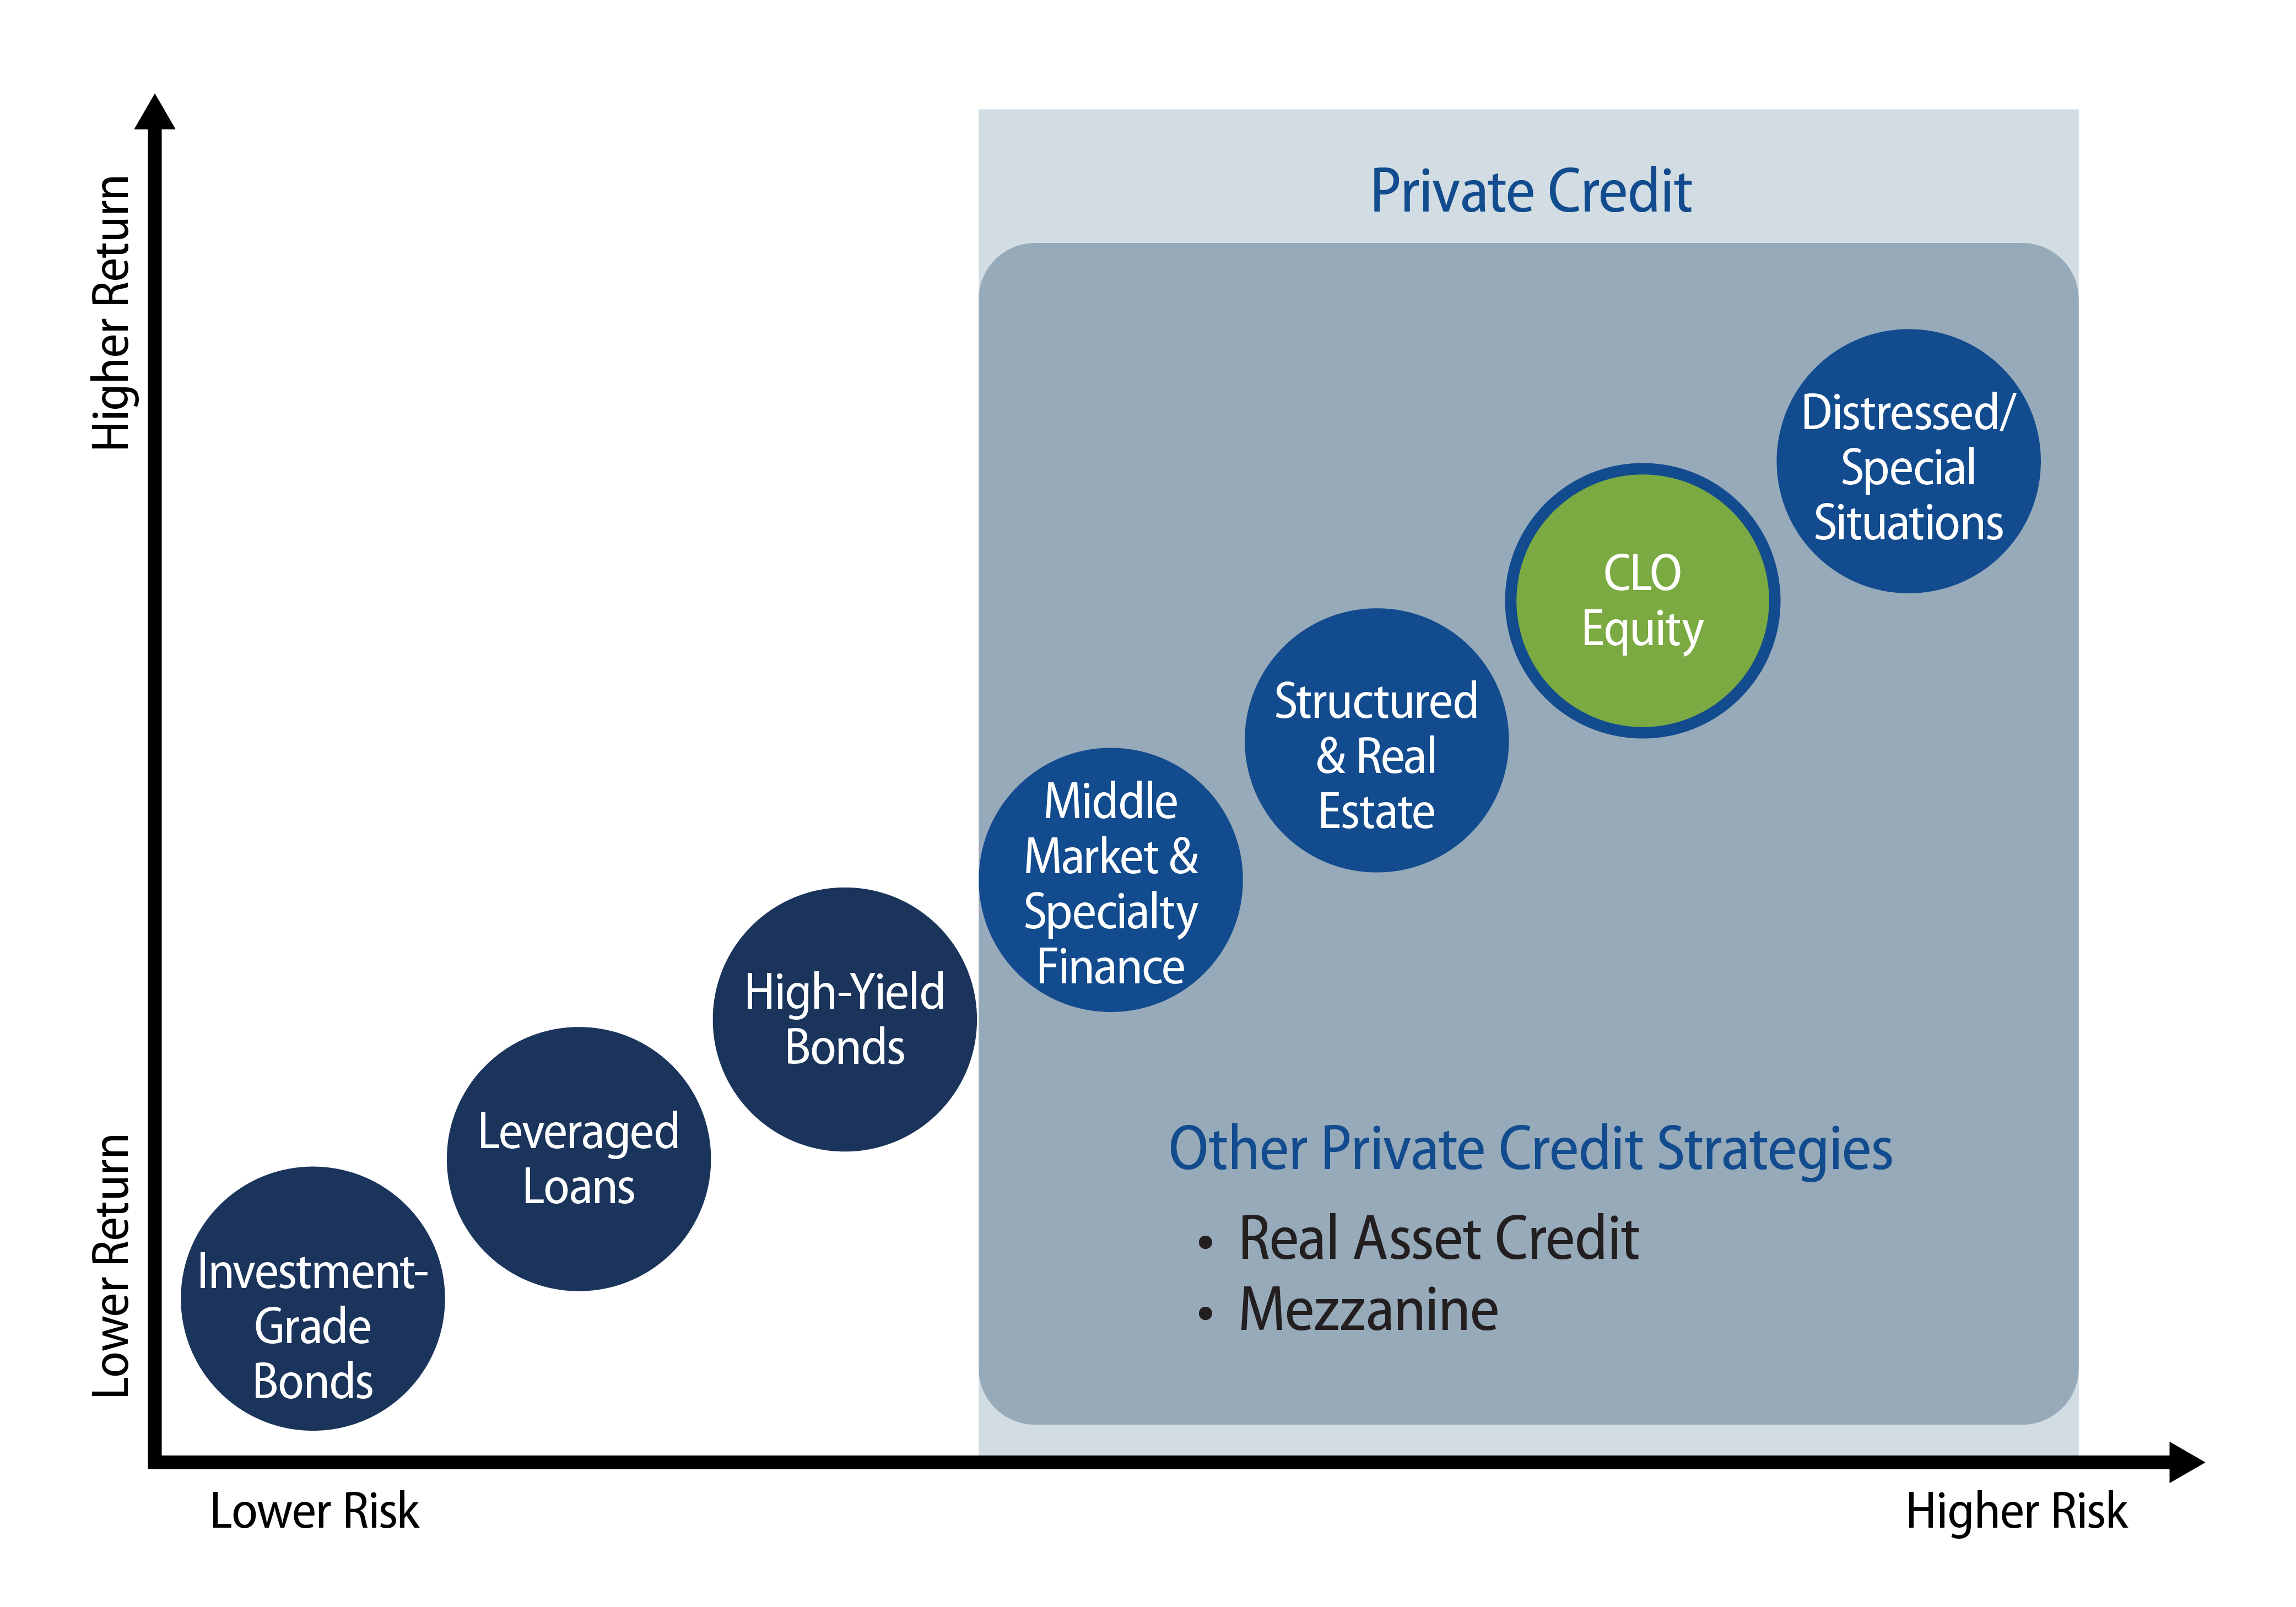
As mentioned in one of our recent blog posts, higher interest rates are creating risks and opportunities in public and private credit markets. While we have seen a recovery of equity valuations since late-2022 on assets for companies that issue high-yield bonds and loans, we believe collateralized loan obligation (CLO) equity may be undervalued for three reasons: optionality, structural advantages and relative collateral.
Optionality
Contrary to what might be expected, the equity of an actively managed CLO, which invests in syndicated bank loans, may outperform both credit and stocks in a recession. As previously illustrated, historical data shows that CLOs originated before the last two recessions yielded better returns for shareholders.
While median economists’ forecasts for the probability of recession in the next 12 months have come down to about 50% according to Bloomberg, so have the credit premiums in markets. In an improving market, an active manager can refinance their debt and reduce interest expenses. This leaves more earnings to distribute to shareholders. On the other hand, if spreads widen, managers may have the ability to reinvest at higher yields and also increase equity returns.
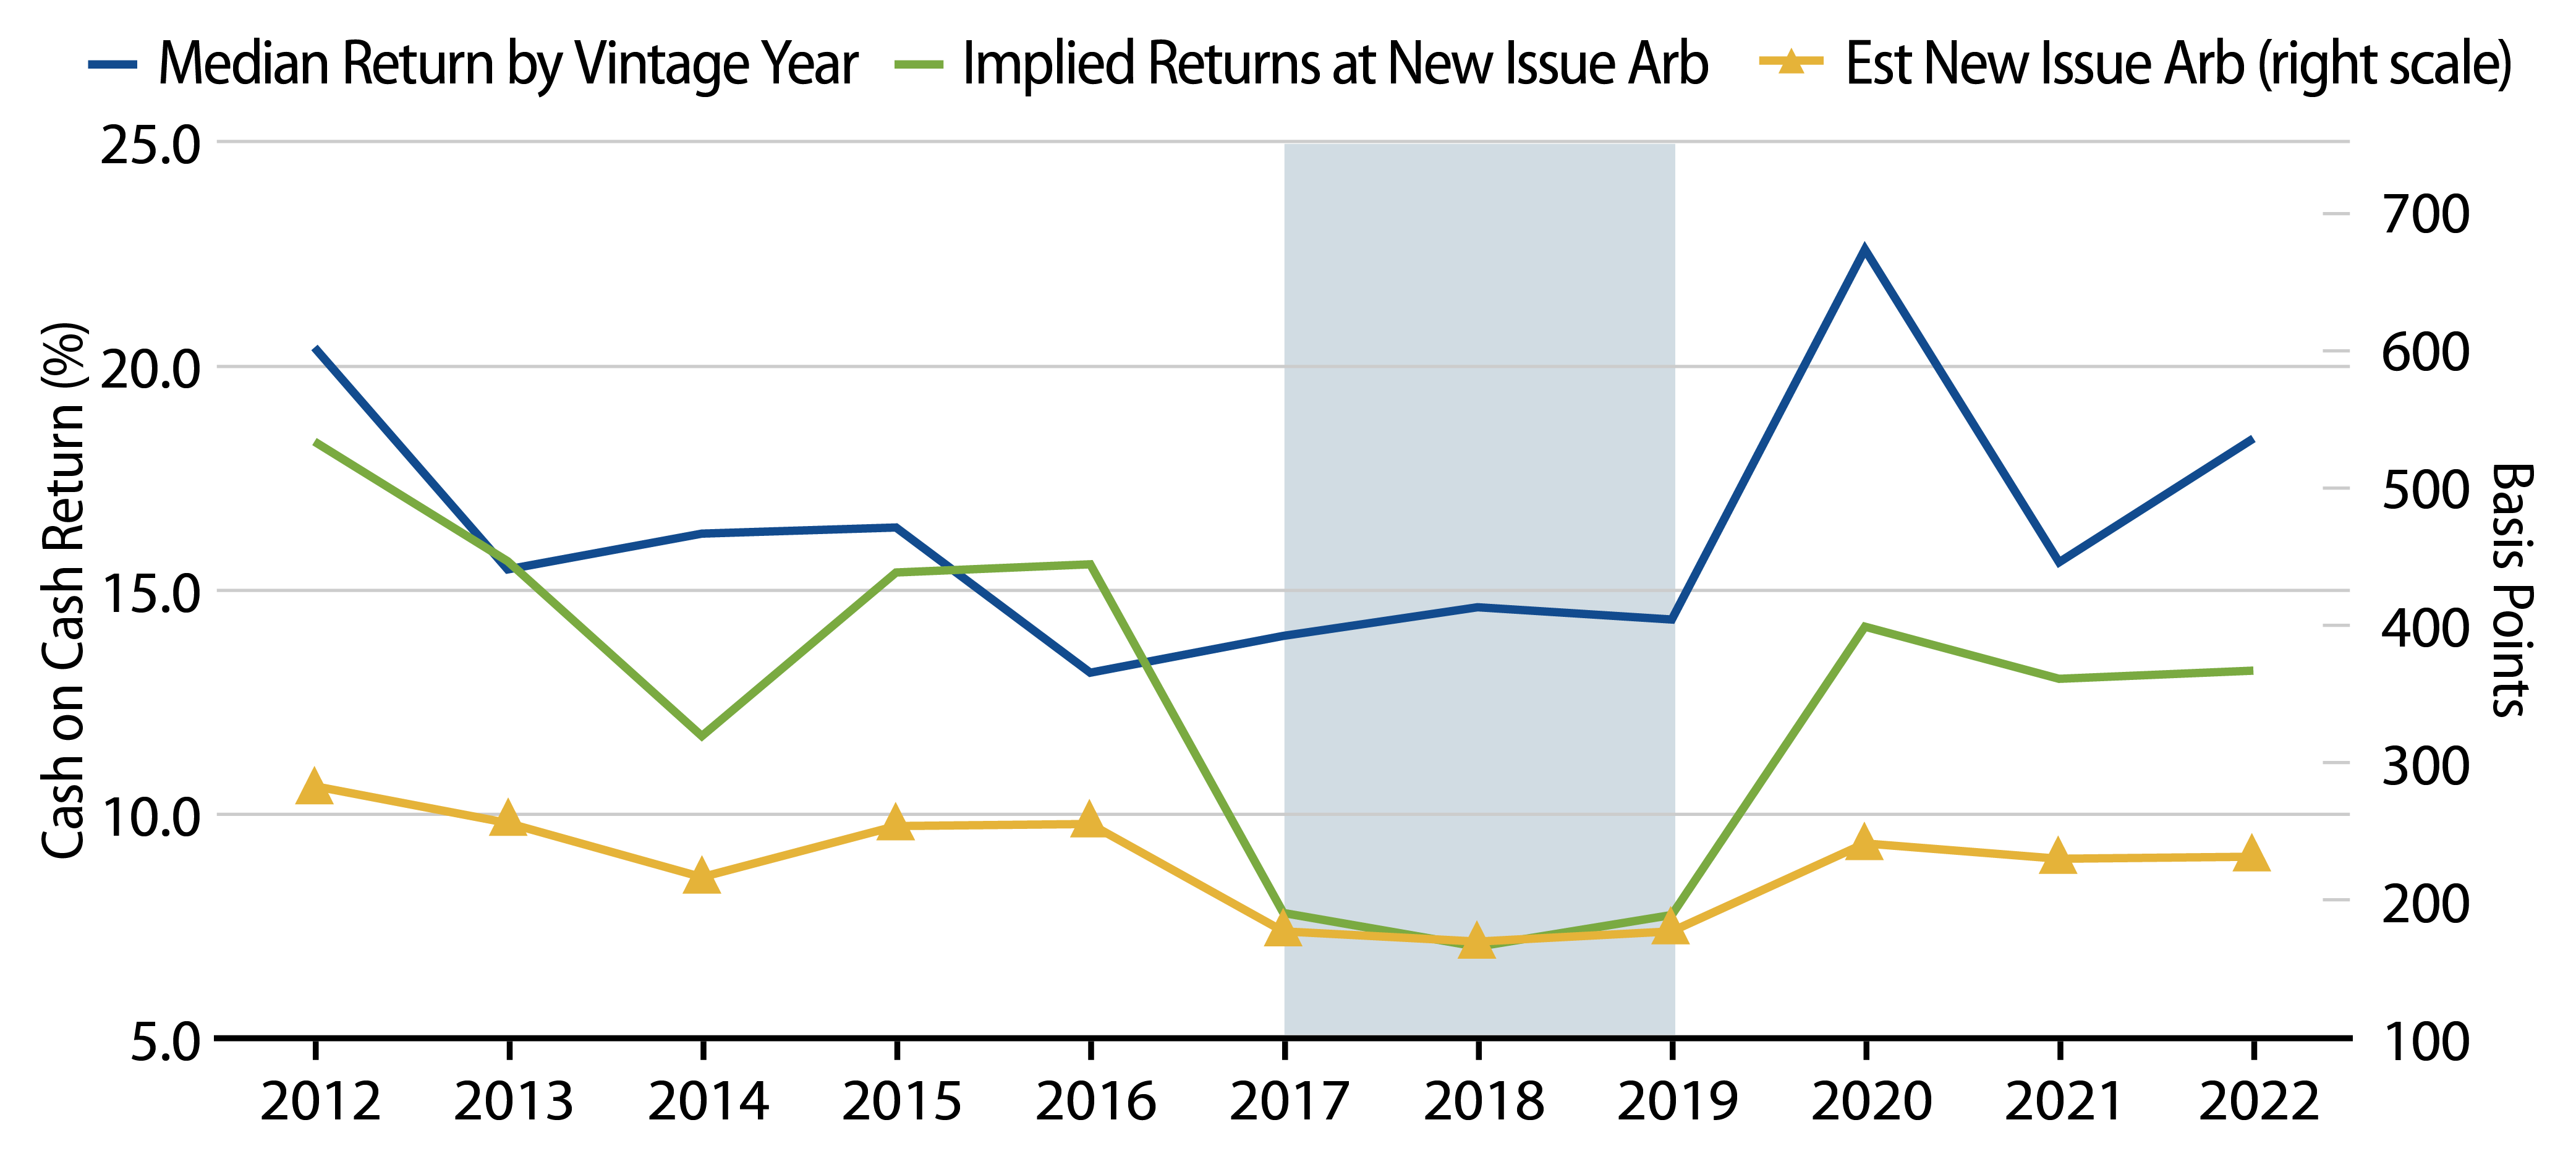
These two options, to reinvest or refinance, likely explain a meaningful part of the higher actual returns of CLO equity than estimates of return at the time of issuance. For example, the “new issue arb,” (i.e., arbitrage) which is the difference between the cost of financing and the income from the assets at new issue, was well below average throughout 2017-2019, according to BofA Merrill. The average new issue arb was estimated at 175 bps, which was below the 10-year average of around 225 bps (see lowest line in Exhibit 1, using right axis scale). An estimate for the median CLO equity may have been around 7% to 8% based on simple new issue arithmetic1, but the actual average return to equity for the CLOs issued during those three years was over 14%, almost 2x higher. Why? Many of those vintages benefited from reinvesting their collateral at higher spreads after 2020. In other words, the median manager was able to increase the income on the assets, creating a larger margin between income and expenses, which in turn boosted equity returns.
Structural Advantages
CLO equity investors also benefit from several structural advantages. Unlike some alternative strategies that borrow in short-term financing markets, the CLO typically issues callable debt that meets or exceeds the life of its investment. This reduces the volatility and risks associated with rising short-term rates.
One of the risks from borrowing in short-term markets is if the value of the assets declines as rates rise, then it may require the borrower to provide additional capital at suboptimal times or reduce their leverage. In contrast, the CLO’s leverage isn’t sensitive to market prices. This makes for a more stable relationship between assets and liabilities, and subsequently more stable equity returns for buy-and-hold style investors.
Relative Collateral
In addition to the optionality and structure advantages, another way active managers enhance returns for CLO equity investors is to avoid losses from defaults on the underlying investments. Avoiding losses makes credit research critical.
Based on our analysis of the fundamentals in credit markets, we think investors should remain selective in private credit markets given that market premiums relative to public market securities that have similar levels of credit risk are slowly adjusting to declining fundamentals. In addition, when adjusting valuations of the underlying assets of private market loans to declines in valuations for public traded companies in the same industries, it may require private borrowers to add substantially more equity capital in order to refinance loans. It’s worth noting that many of the private market loans originated several years ago with reportedly low loan-to-value (LTV) ratios were based on asset valuations that haven’t had to mark to market. While many of those private borrowers may generate stable or recovering cash flows, they will still likely need more equity capital to refinance their loans or reduce the amount of borrowing. As we’ve also explored recently, this is why analyzing investment multiples is an important part of the analysis.
Why Should Investors Consider CLO Equity of Syndicated Bank Loans?
Investors looking to capitalize on private credit markets may want to consider the equity of CLOs that invest in syndicated bank loans. While the CLO structure itself can be used for other private loans such as real estate or middle markets, one of the benefits of syndicated bank loan collateral is that the underlying investments typically have better liquidity than other private investments, which is supportive of capitalizing on the reinvestment option. In other words, it’s likely easier to improve the yield on assets relative to liabilities (aka the arb) in syndicated bank loans that can be more easily sold than with direct loans or lightly syndicated loans. Note it was the reinvestment optionality that historically supported a meaningful portion of the outperformance of CLO equity according to the analysis of Cordell, Roberts and Schwert in 2021.
We think investors may be underappreciating the benefits of actively managed CLOs focused on bank loans in the current environment. We see better reward to risk in CLO equity of bank loans versus other alternatives and equity markets based on the optionality, structural advantages and relative collateral.
ENDNOTES
1. The “Implied Returns at New Issue Arb” reference BofA Merill’s calculations for the difference between asset and liability spreads, subtracts 100 bps for fees and other losses, and multiplies by 10x given that a typical structure has about $10 of equity per $100 of assets.