
Real consumer spending rose a scant 0.1% in February, and that gain was fully offset by a -0.1% revision to the January spending level. Spending was especially soft for merchandise, and the downward revisions to January were mostly in that area as well. However, the gains in services spending were a touch softer than what we had seen in 4Q25.
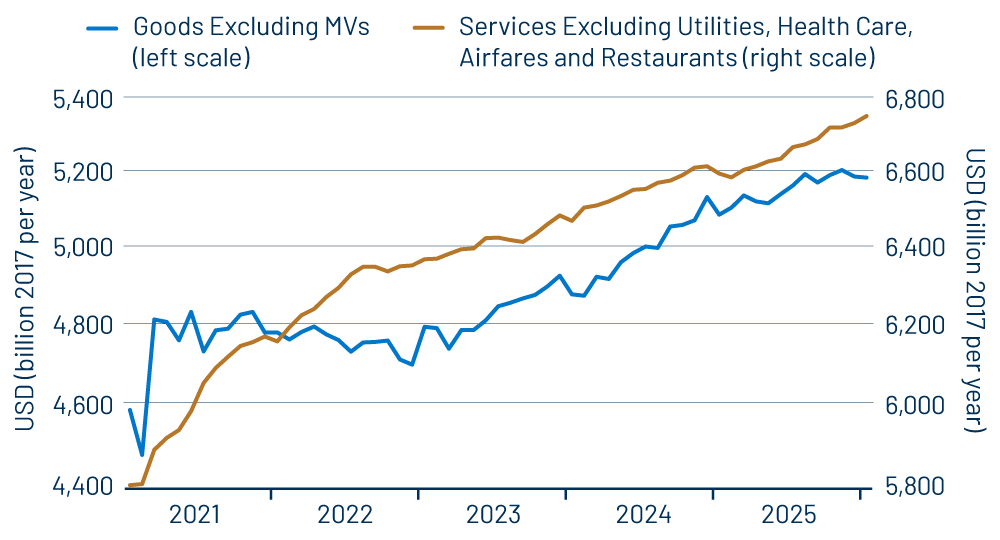
Exhibit 1 summarizes these data. There, you can see a decline in goods spending in each of the last three months. Prior to today’s data, goods spending looked to have been flat in December and January, but downward revisions and a March decline now impart an apparent downtrend.
When we discussed the February retail sales data in our post last week, we stated that nominal spending on merchandise looked to be growing steadily, but that prices increases looked to have bit into that growth. Well, the merchandise price increases announced today were even larger than we expected.
Consumer Price Index (CPI) data are released by the Bureau of Labor Statistics, within the Labor Department. Personal Consumption Expenditures (PCE) data are released by the Bureau of Economic Analysis, within the Commerce Department, and that agency also constructs the consumer spending data.
That CPI data showed a slight, 0.1% increase in core goods prices (excluding food and energy) in February, and we expected core goods prices within the PCE index to be up slightly more, about 0.3%. Instead, that aggregate showed a sharp, 0.9% increase as seen in Exhibit 2, with core goods PCE also up more than core goods CPI in December and January. Those sharper increases turned decent nominal spending growth into the declines in real goods spending seen in Exhibit 1.
Real goods spending has softened in recent months in all merchandise sectors except recreational goods (sporting goods and books, but not electronics). Spending was especially soft for housing-related items (appliances, home maintenance equipment, etc.).
As sharply as goods prices were up, the sector was a mixed bag, with prices down for a number of items, and food prices up only moderately. However, especially sharp increases were registered for car parts (but not cars), small kitchen appliances, dishes, video equipment other than TVs, jewelry, cameras, software, home medical equipment, clothing, linen and personal care products. This set of price increases would suggest that tariff effects are finally seeping significantly into final product pricing, which is ironic in that these price increases occurred at just about the time that the Supreme Court struck down widespread tariffs.
Meanwhile, even if the price increases are tariff-related, it is still odd that the core goods PCE price increases have been so different from what has been reported for the core CPI. As you can also see in Exhibit 2, the two measures have generally moved in consonance in the past and then recently diverged wildly. We will look into this and hopefully provide some insight in our post next week, when we cover March CPI data.
For now, the recent softness in real goods spending is a concern, but not a cause for panic. As we mentioned when discussing the February retail sales data, personal incomes are growing at a decent, steady rate, and nominal demand growth is also steady. Consumers are not cutting back so much as resisting higher prices. The striking down of tariffs and consumer resistance to higher prices could lead to competitive pressures kicking in at stores. Then again, keep in mind that all these developments were occurring prior to the hostilities in Iran, and that conflict is likely to affect consumer behavior as well.
Obviously, a lot of balls are in motion. We think the economy will pull through this, especially given the ongoing strength in business capital spending and business activity in general. However, the incidence of higher prices and global conflict certainly complicates things.
We had been expecting very robust 1Q26 GDP growth, as the auto sector rebounded from a 4Q25 decline and as government spending rebounded with the shutdown over. Those factors will still indeed work to boost 1Q GDP growth, but now there will be an offset from the softer consumer sector. On net, we are looking for 1Q growth to be just a tad above 2%.