Municipals Posted Negative Returns for a Third Consecutive Week
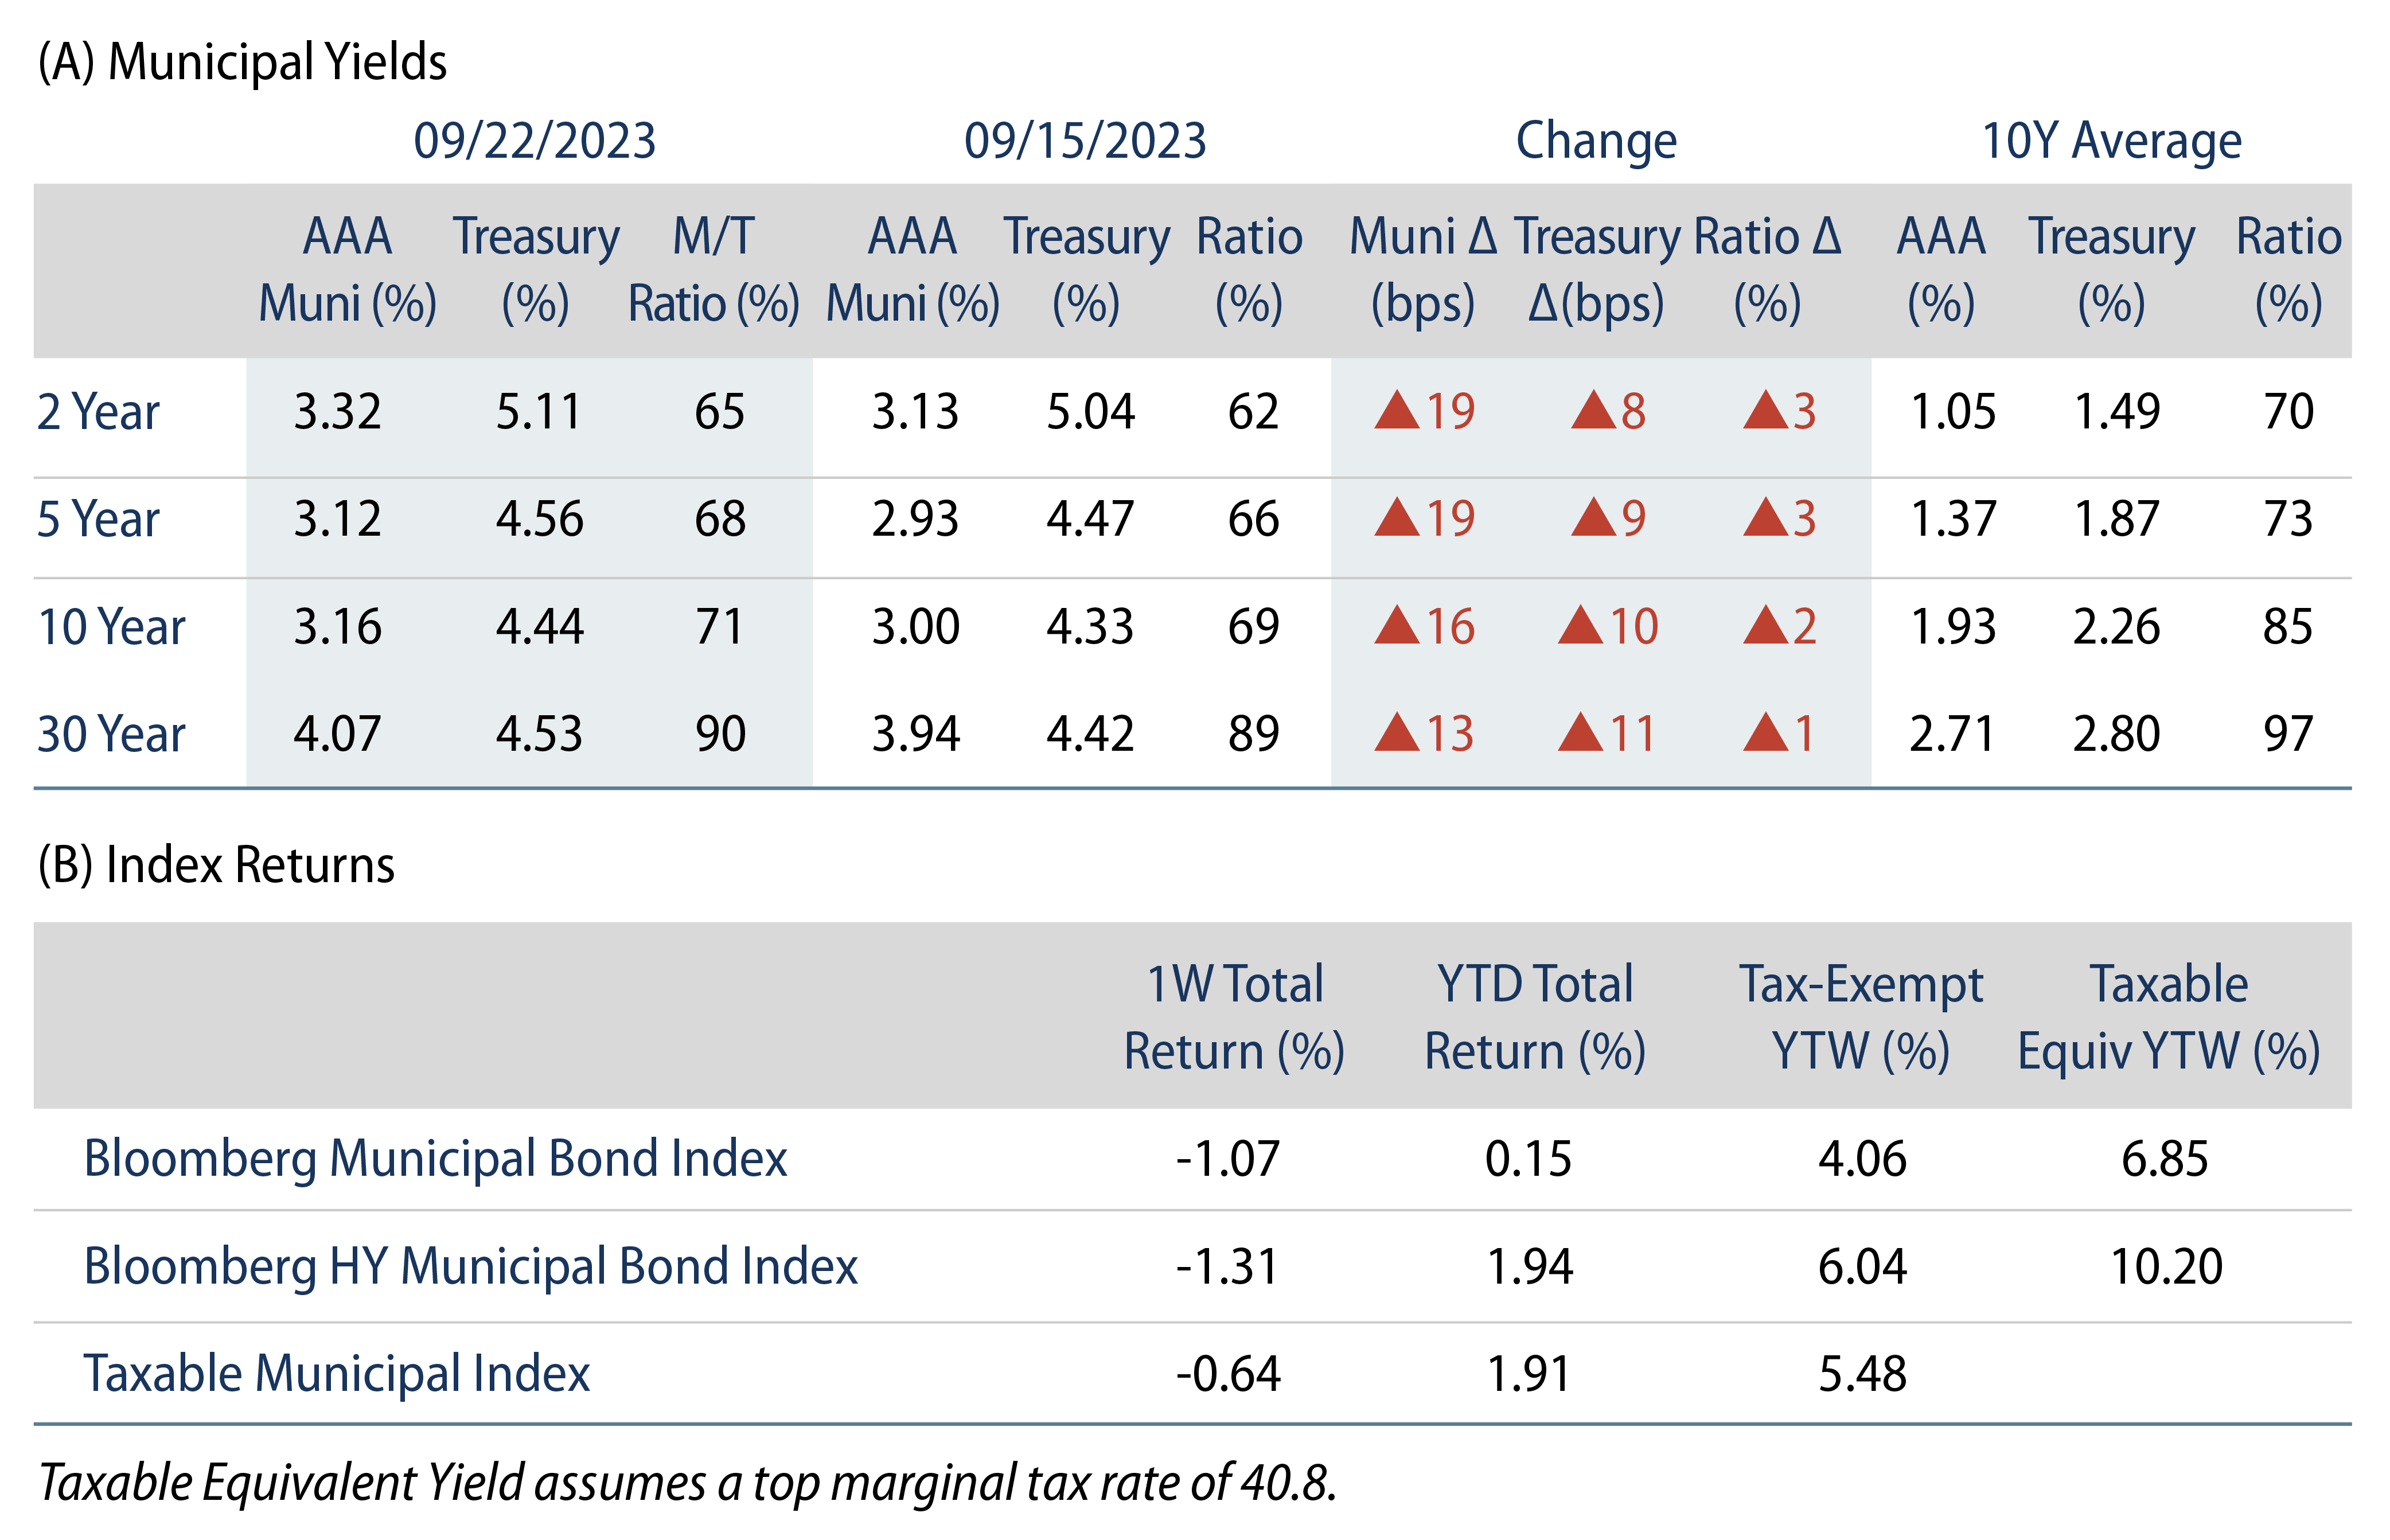
Munis posted negative returns for a third consecutive week as high-grade muni yields moved higher across the curve. Munis underperformed Treasuries as muni demand remained weak, the Fed held rates steady but guided a hawkish tone, and the 10-year Treasury reached its highest level since October 2007. Meanwhile, weaker technicals persisted amid fund outflows. The Bloomberg Municipal Index returned -1.07% during the week, the High Yield Muni Index returned -1.31% and the Taxable Muni Index returned -0.64%. This week we highlight state and local revenue data released from the Census and what it means for muni investors.
Fund Outflows Continued Last Week
Fund Flows: During the week ending September 20, weekly reporting municipal mutual funds recorded $27 million of net outflows, according to Lipper. Long-term funds recorded $337 million of inflows, high-yield funds recorded $85 million of inflows and intermediate funds recorded $75 million of outflows. This week’s outflows bring year-to-date (YTD) net outflows to $10.8 billion.
Supply: The muni market recorded $5 billion of new-issue volume last week, down 37% from the prior week. YTD issuance of $259 billion is down 9% year-over-year (YoY), with tax-exempt issuance down 3% YoY and taxable issuance down 47% YoY. This week’s calendar is expected to increase to $7 billion. Large transactions include $1 billion Texas Water Development Board and $770 million Florida Financial Development Corporation transactions.
This Week in Munis: State and Local Revenues Slide
Earlier this month, the U.S. Census Bureau released estimated state and local tax collections for 2Q23. Total tax collections declined 10.8% from 2Q22 levels to $487 billion, reflecting a second consecutive quarter of tax declines. Considering the underlying major tax components, individual income tax collections declined 12% YoY to $149 billion, corporate income tax collections declined 7% to $47 billion, and sales tax collections declined 1% to $153 billion. Meanwhile, property tax collections, the primary source of revenues for local municipalities, increased 5% YoY to $132 billion.
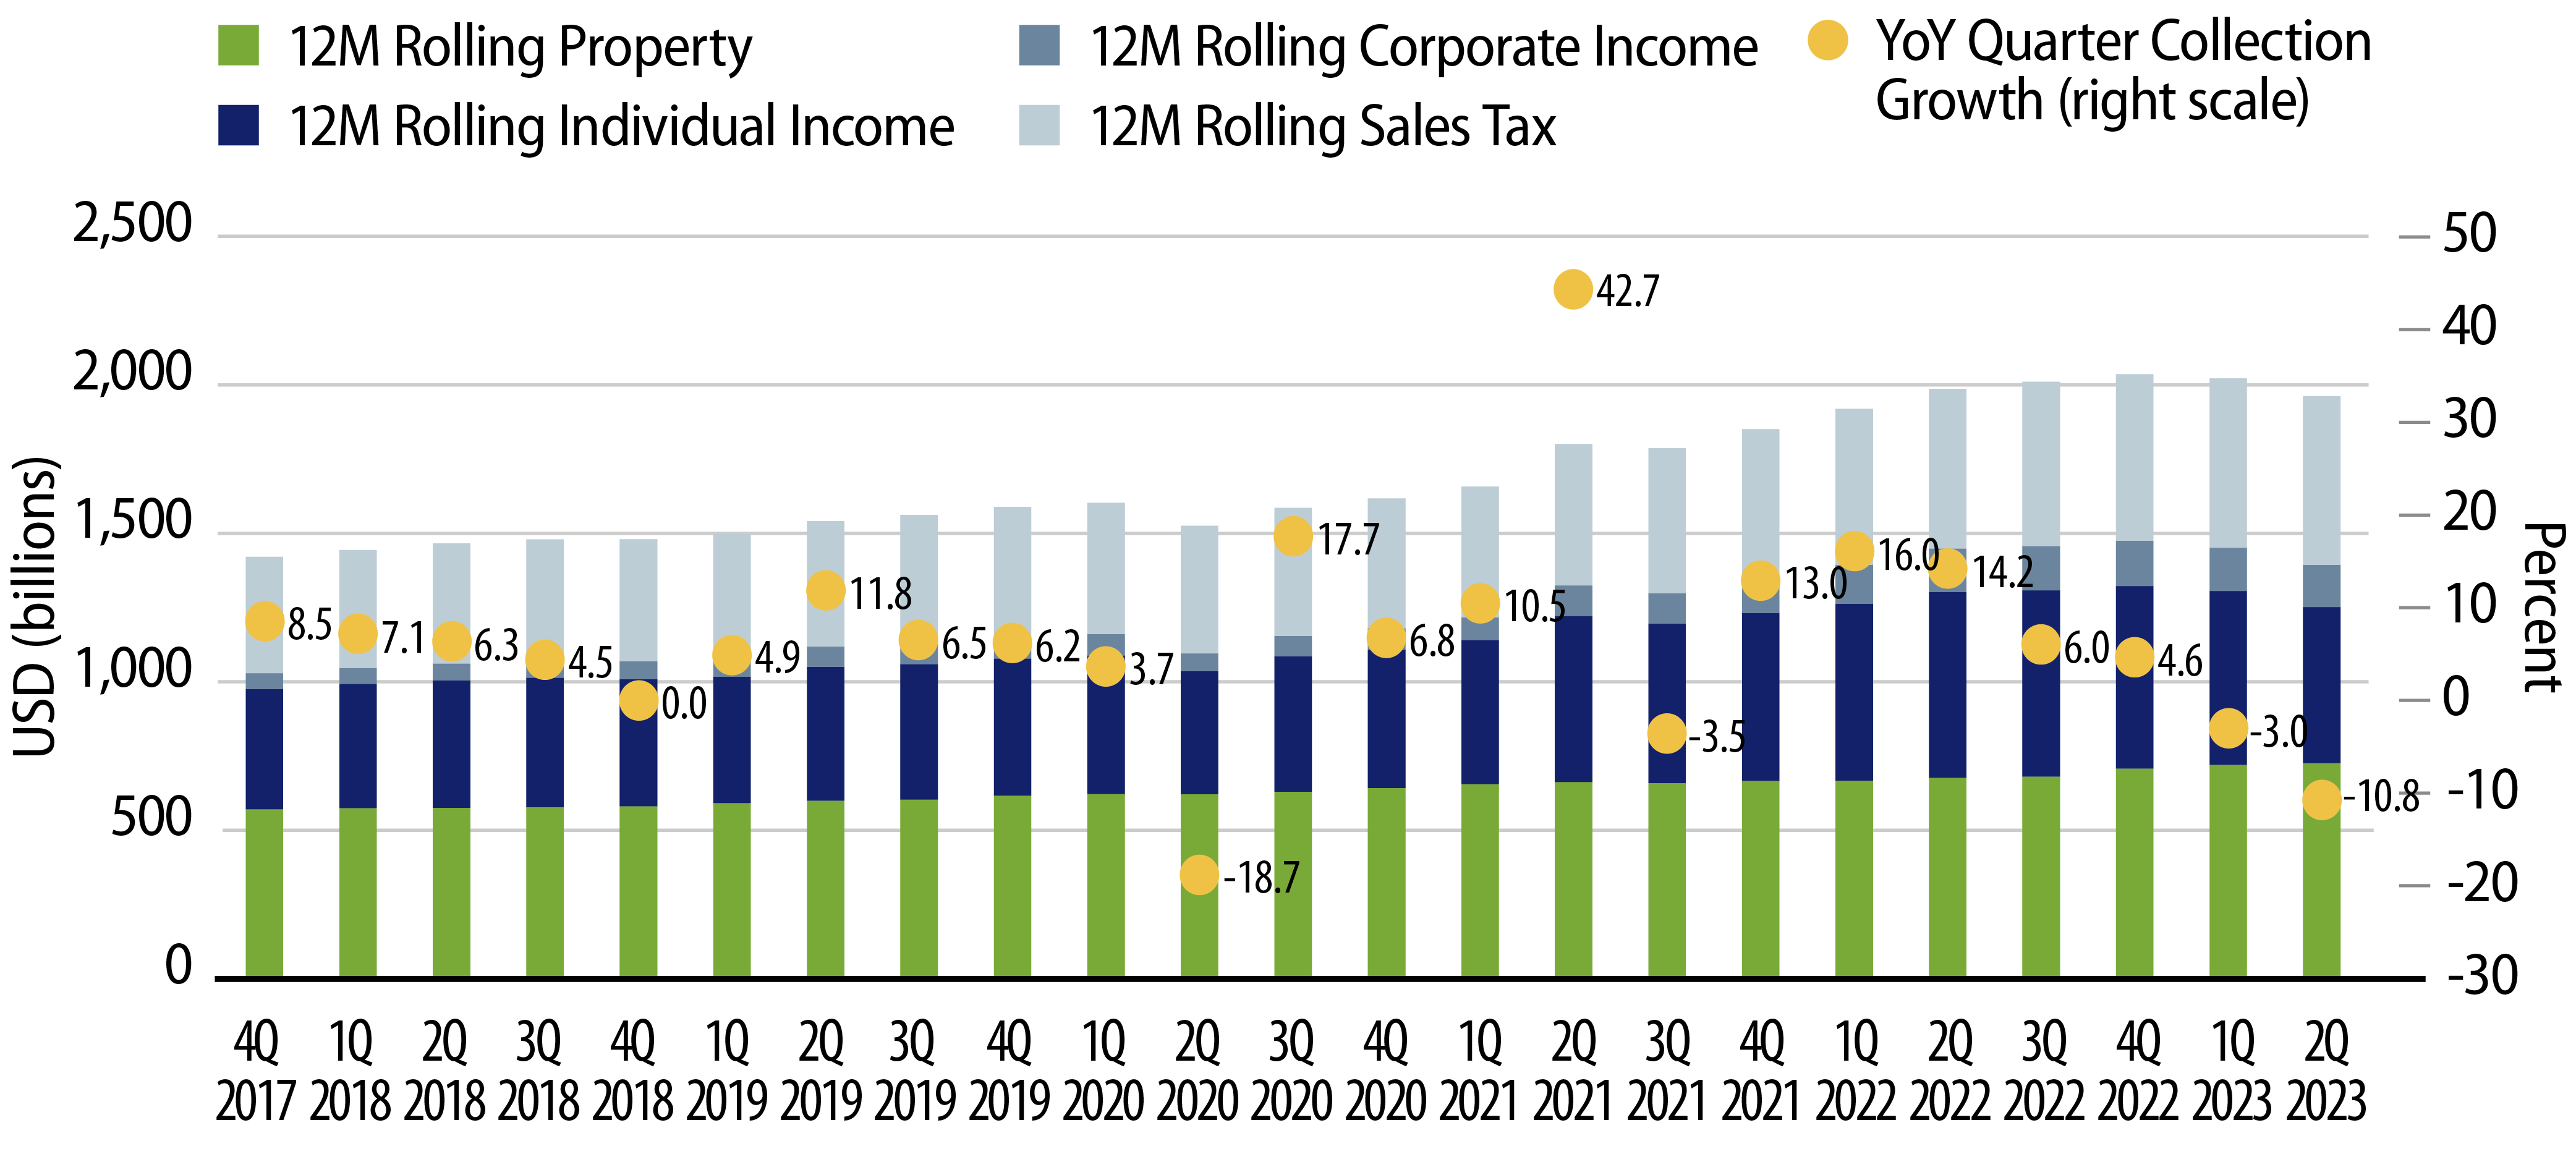
Tax collections for 2Q23 also reflect the end of fiscal-year 2023 for many municipalities. Trailing 12-month total state and local tax collections declined 1.2% from the prior year to $2.0 trillion. Within this figure, trailing 12-month individual income tax collections declined 16% from the prior year to $526 billion and corporate income tax collections declined 3% to $142 billion. Meanwhile, sales tax collections increased 6% to $568 billion and property tax collections increased 7% YoY to $727 billion.
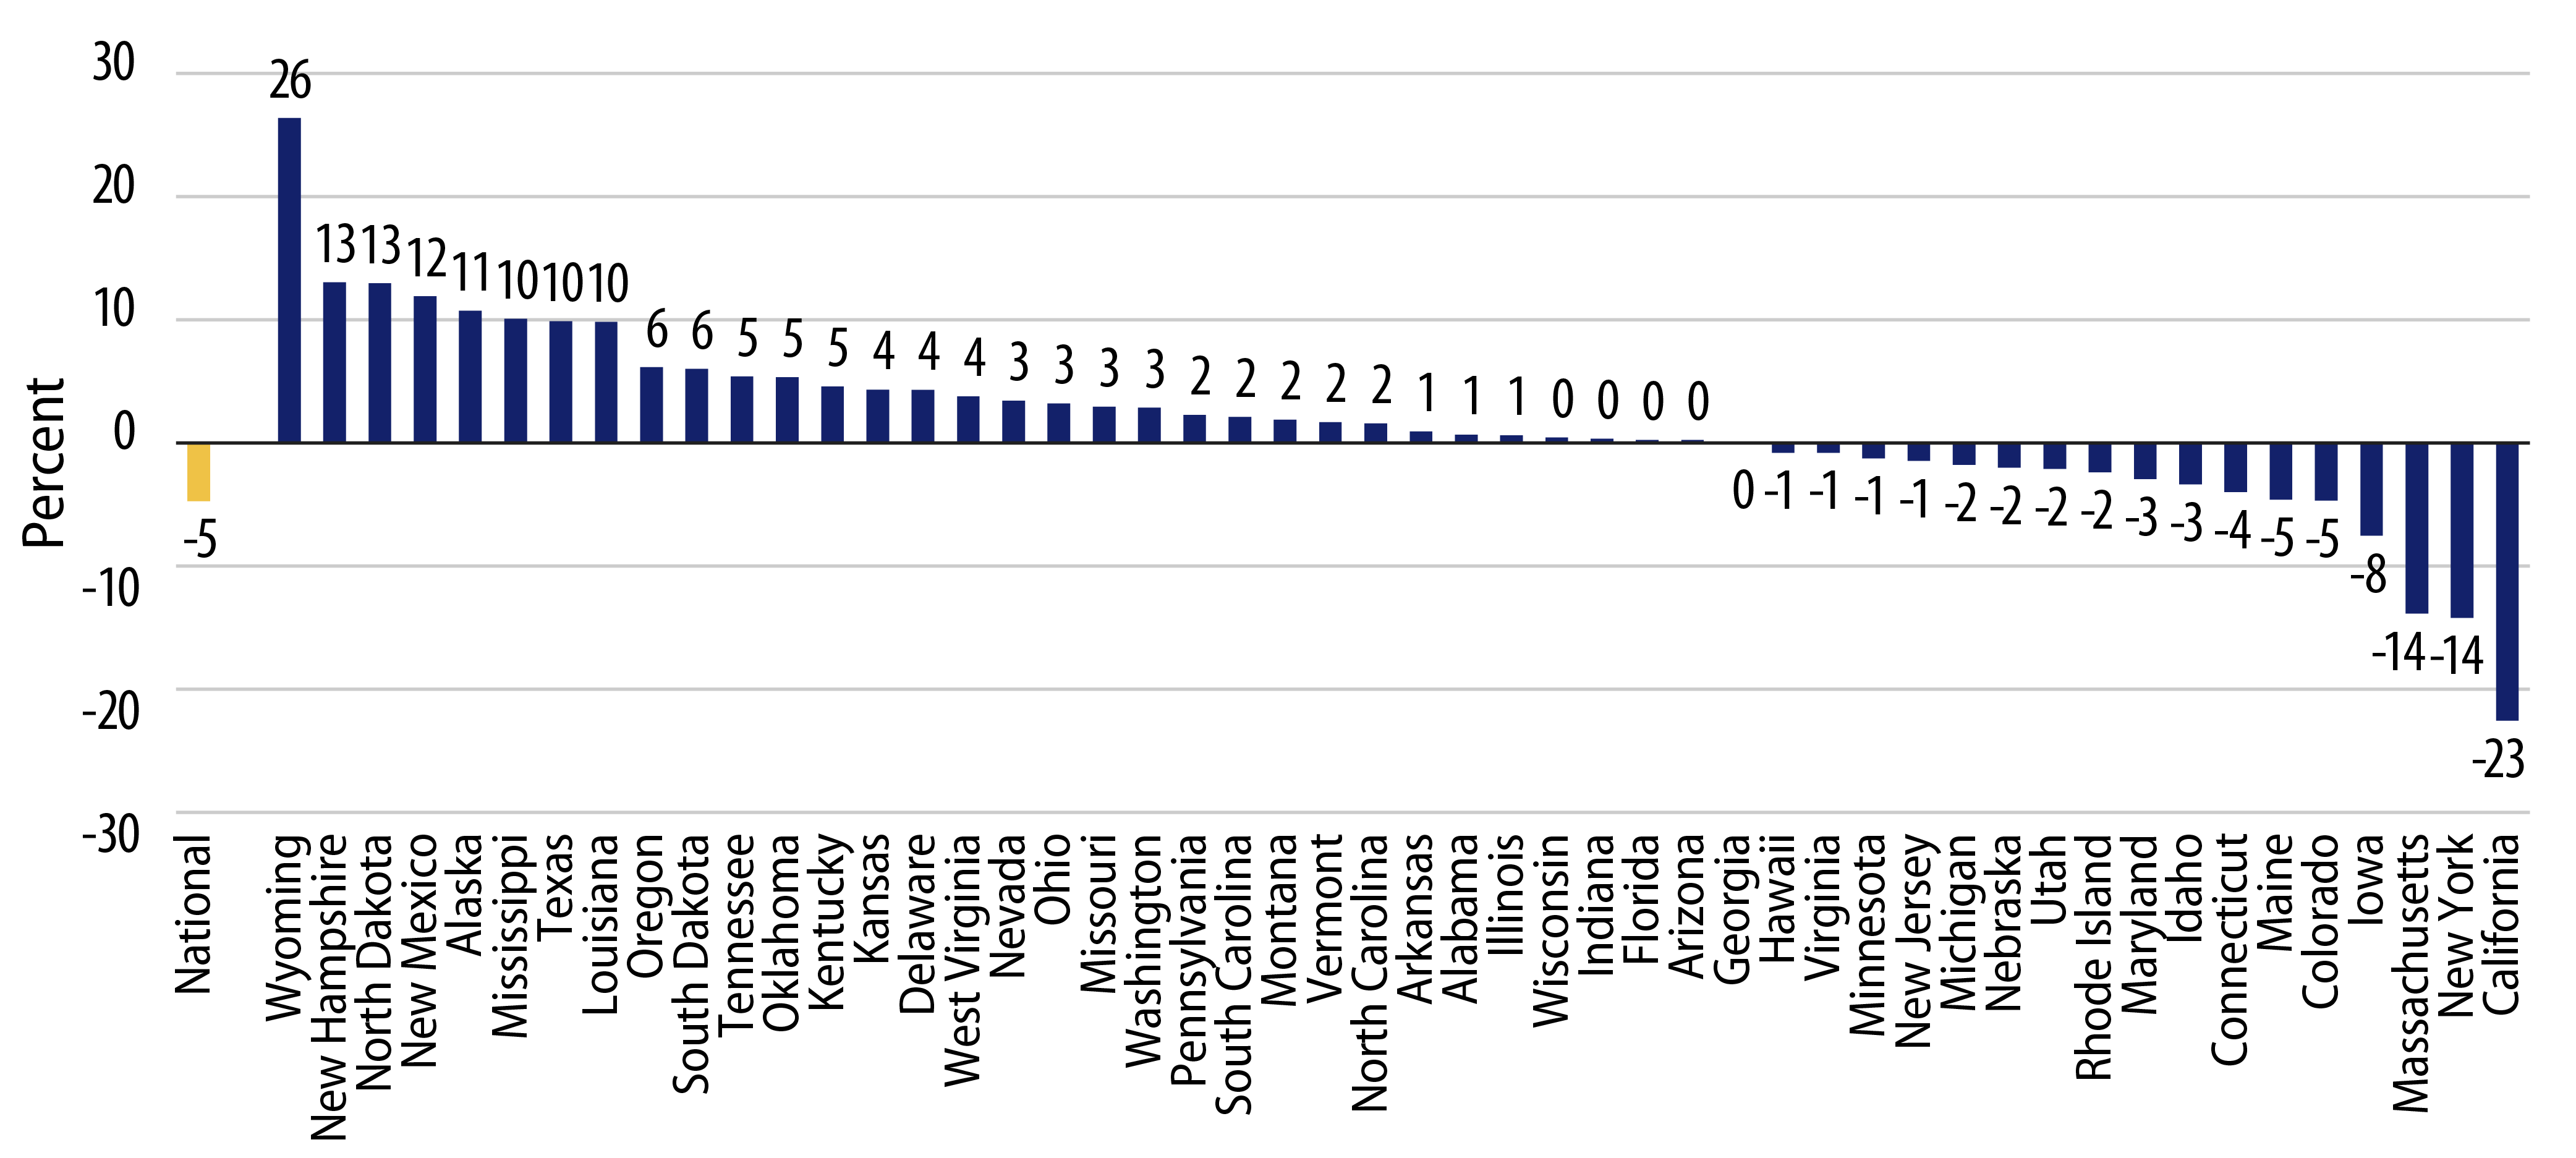
Over the trailing 12 months through the second quarter, state tax collections declined 4.7% YoY. California, New York and Massachusetts observed the highest YoY declines of 23%, 14% and 14%, respectively. These tax declines were partially attributed to filing delays associated with natural disasters in California, as well as lower capital gains tax collections in the wealthier states. Wyoming, New Hampshire and North Dakota recorded the highest YoY growth rates of 26%, 13% and 13%, respectively.
While overall declines in state and local tax collections present a headwind for municipal credit conditions, total collections remain just 1% below record levels. We expect revenues to remain near these levels and to remain supportive of municipal credit conditions over the medium term. However, we are monitoring the potential for additional volatility, as 10 states reduced income tax rates in 2023 which, along with slowing economic conditions, could contribute to shortfalls and potential downgrade risk for select municipal issuers.