マーケット・ブログ
MARKETS
13 September 2022
Weekly Municipal Monitor—Swelling Supply Conditions
By Dave Fare

Municipals Posted Negative Returns

Municipals posted negative returns this week, but outpaced Treasuries even as Treasuries moved higher as a result of the market reflecting a greater probability of a 75-bp rate hike later this month. High-grade municipal yields moved 5 to 9 bps higher across the curve. Market technicals remained weak as fund outflows continued for a fifth consecutive week. The Bloomberg Municipal Index returned -0.37% while the HY Muni Index returned -0.77%. This week, following strong summer supply technicals, we highlight increasing supply conditions that could create favorable opportunities in upcoming weeks.

Technicals Remain Challenged Amid Ongoing Mutual Fund Outflows

Fund Flows: During the week ending September 7, weekly reporting municipal mutual funds recorded $1.1 billion of net outflows, according to Lipper. Long-term funds recorded $881 million of outflows, high-yield funds recorded $540 million of outflows and intermediate funds recorded $81 million of outflows. The week’s outflows mark the fifth consecutive week of outflows and extend year-to-date (YTD) outflows to $84 billion.

Supply: The muni market recorded $7 billion of new-issue volume, down 5% from the prior week. Total YTD issuance of $276 billion is 10% lower than last year’s levels, with tax-exempt issuance trending 1% higher year-over-year (YoY) and taxable issuance trending 43% lower YoY. This week’s new-issue calendar is expected to increase to $10 billion. Large deals include $876 million NY Utility Debt Securitization Authority and $667 million North Texas Tollway Authority transactions.

This Week in Munis: Swelling Supply Conditions

In a post earlier this summer, we highlighted an expectation for sharp negative net supply conditions to be supportive of favorable market technicals. Net supply in June, July and August ultimately totaled -$47 billion, as $105 billion of new issuance was offset by $152 billion of maturities and securities called out of the market. While the Bloomberg Municipal Index posted a negative return of -1.25% over this period due to rising rates, these negative net supply conditions likely contributed to the outperformance versus other fixed-income asset classes such as the Bloomberg U.S. Aggregate return of -2.01% and the U.S. Treasury Index return of -1.80%.

Exhibit 1: Monthly Net Muni Issuance
Explore Monthly Net Muni Issuance
Source: Western Asset, Bloomberg. As of 31 Aug 22. Select the image to expand the view.

We believe that a key driver of the sharp negative net supply conditions over the summer were the elevated bond maturities and calls from the market (highest since the summer of 2015), which we anticipate will abate in the coming weeks. Maturing debt ranged from $21 billion to $27 billion in June to August 2022, but is scheduled to drop to $13 billion this September. Meanwhile, we expect net new-money issuance to move higher into the fall as markets attract better liquidity and issuers look to finalize annual capital plans ahead of the winter holidays. Over the past five years, such seasonal conditions led net municipal issuance to average $14 billion in September, a trend we expect to persist this year.

Exhibit 2: September and October Cumulative Muni Performance vs. Respective Calendar-Year Performance
Explore September and October Cumulative Muni Performance vs. Respective Calendar-Year Performance
Source: Western Asset, Bloomberg. As of 31 Dec 21. Select the image to expand the view.

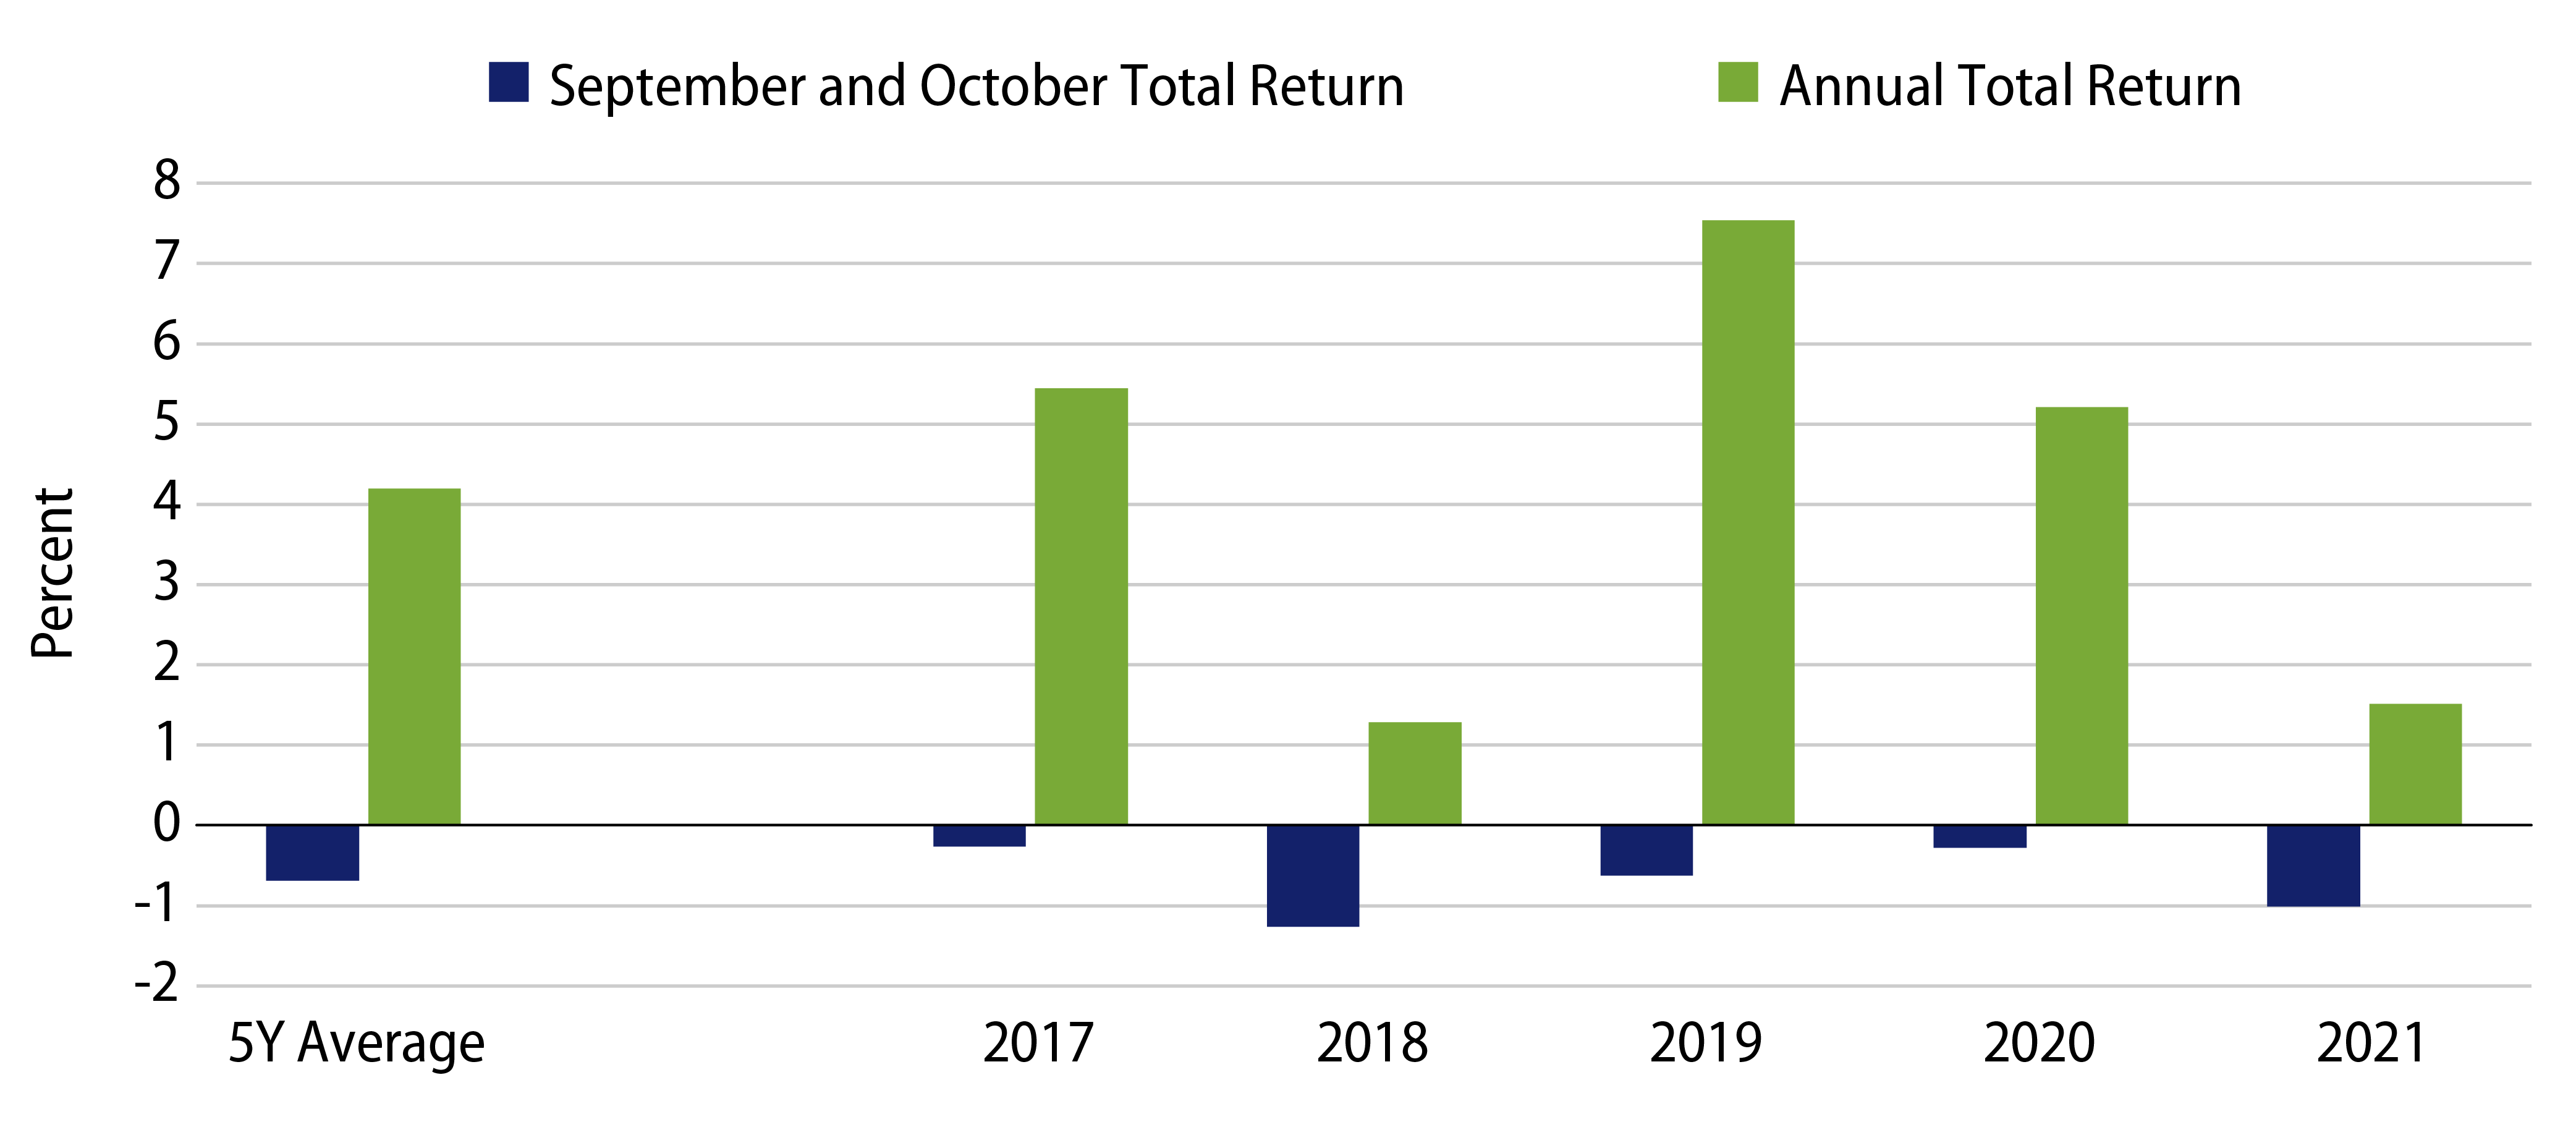
In addition to higher net supply conditions, lackluster demand conditions (considering the record municipal mutual fund outflow cycle) present an additional headwind. Notably, four of the five past years of cumulative positive supply conditions in September and October coincided with municipal mutual fund inflows. Until market demand is stabilized, we believe price activity could be more sensitive to supply conditions than observed in the recent past.

Western Asset remains constructive on the long-term relative value proposition of municipals versus other fixed-income asset classes. However, we believe these near-term technical pressures seek to present more favorable entry points that can add meaningful duration and spread risk to a portfolio allocation.

Exhibit 3: Municipal Bond Yields and Index Returns
Explore Municipal Bond Yields and Index Returns
Source: Bloomberg. As of 09 Sep 22. Select the image to expand the view.
Exhibit 4: Tax-Exempt and Taxable Muni Valuations
Explore Tax-Exempt and Taxable Muni Valuations
Source: Bloomberg. As of 09 Sep 22. Select the image to expand the view.
投資一任契約および金融商品に係る投資顧問料(消費税を含む):
投資一任の場合は運用財産の額に対して、年率1.10%(税抜き1.00%)を上限とする運用手数料を、運用戦略ごとに定めております。 また、別途運用成果に応じてお支払いいただく手数料(成功報酬)を設定する場合があります。その料率は、運用成果の評価方法や固定報酬率の設定方法により変動しますので、手数料の金額や計算方法をこの書面に記載することはできません。
投資信託の場合は投資信託ごとに信託報酬が定められておりますので、目論見書または投資信託約款でご確認ください。

有価証券の売買又はデリバティブ取引の売買手数料を運用財産の中からお支払い頂きます。投資信託に投資する場合は信託報酬、管理報酬等の手数料が必要となります。これらの手数料には多様な料率が設定されているためこの書面に記載することはできません。デリバティブ取引を利用する場合、運用財産から委託証拠金その他の保証金を預託する場合がありますが、デリバティブ取引の額がそれらの額を上回る可能性があります。その額や計算方法はこの書面に記載することはできません。投資一任契約に基づき運用財産の運用を行った結果、金利、通貨の価格、金融商品市場における相場その他の指標に係る変動により、損失が生ずるおそれがあります。損失の額が、運用財産から預託された委託証拠金その他の保証金の額を上回る恐れがあります。個別交渉により、一部のお客様とより低い料率で投資一任契約を締結する場合があります。

©Western Asset Management Company Ltd 2024. 本資料の著作権は、ウエスタン・アセット・マネジメント株式会社およびその関連会社(以下「ウエスタン・アセット」という)に帰属するものであり、意図した受取人のみを対象として作成されたものです。本資料に記載の内容は、秘密情報及び専有情報としてお取り扱いください。ウエスタン・アセットの書面による事前の承諾なしに、全部又は一部を無断で複写、複製することや転載することを堅くお断りいたします。

過去の運用実績は将来の運用実績を示すものではありません。また、本資料は、将来の実績を予測または予想するものではありません。

本資料は、適格機関投資家、特定投資家、企業年金基金、公的年金等、豊富な投資経験と高度な専門知識とを備えたプロフェッショナルのお客様のみにご提供するものです。


本資料は情報の提供のみを目的としています。資料作成時点のウエスタン・アセットの見解を掲載したものであり、将来予告なしに変更する場合があります。また、リアルタイムの市場動向や運用に関する見解ではありません。

本資料で第三者のデータが使用されている場合、ウエスタン・アセットはそのデータが公表時点で正確であると信じていますが、それを保証するものではありません。ウエスタン・アセットの戦略・商品の受賞またはランキングが含まれている場合、これらは独立した第三者または業界出版物により公平な定量・定性情報に基づき決定されたものです。ウエスタン・アセットは、これらの第三者の標準的な業界サービスを利用したり、出版物を購読したりする場合がありますが、それらは、すべてのアセット・マネージャーが利用可能なものであり、ランキングや受賞に影響を与えるものではありません。

本資料に記載の戦略・商品には、元本の一部または全部の損失を含む大きなリスクが伴う場合があります。また、当該戦略や商品に投資することは大きな変動を伴なう可能性があり、投資家にはそのようなリスクを受け入れる経済力および意思を持つことが求められます。

特段の注記がない限り、本資料に記載の戦略のパフォーマンスはコンポジットのデータです。コンポジットではないその他のデータについては、当戦略の運用方針に最も近いと考えられる口座を、コンポジットの代表口座として掲載しています。つまり、代表口座は運用結果により選択されるものではありません。代表口座のポートフォリオ特性は、コンポジットやその他のコンポジット構成口座と異なる場合があります。これらの口座についての情報はご依頼に応じてご提供いたします。

本資料に記載している内容は、ウエスタン・アセットの投資家に対する投資助言ではありません。個別銘柄・発行体に関する一般的または具体的に言及する内容は、例としてご提示したものであり、購入または売却を推奨するものでもありません。また、ウエスタン・アセットの役職員及びお客様は、本資料に記載の有価証券を保有している可能性があります。 本資料は、会計、法務、税務、投資またはその他の助言の提供を意図したものではなく、またそれらに依存すべきではありません。お客様は、ウエスタン・アセットが提供する戦略・商品への投資を行うにあたり、経済的リスクやメリットなどについて助言が必要である場合は、ご自身の弁護士、会計士、投資家、税理士、その他のアドバイザーに相談して下さい。お客様は、居住国で適用される法令を遵守する責任を負います。

ウエスタン・アセットは世界有数の運用専門会社です。1971年の設立以来、債券運用に特化したアクティブ運用機関として最大規模の運用資産と運用チームを有しています。拠点は米国カリフォルニア州パサデナ、ニューヨーク、英国ロンドン、シンガポール、東京、豪メルボルン、ブラジル・サンパウロ、香港、スイス・チューリッヒにあり、フランクリン・リソーシズIncの完全子会社ですが、経営全般に独立性を保っており、次の6法人で構成されています。米国:ウエスタン・アセット・マネジメント・カンパニーLLC(米証券取引委員会(SEC)登録の投資顧問会社)。ブラジル・サンパウロ:ウエスタン・アセット・マネジメント・カンパニーDTVM Limitada(ブラジル証券取引委員会とブラジル中央銀行が認可・規制)。メルボルン:ウエスタン・アセット・マネジメント・カンパニーPty Ltd(事業者番号ABN 41 117 767 923、AFSライセンス303160)。シンガポール:ウエスタン・アセット・マネジメント・カンパニーPte. Ltd.(CMSライセンスCo. Reg. No. 200007692R、シンガポール通貨監督庁が監督)。日本:ウエスタン・アセット・マネジメント株式会社(金融商品取引業者、金融庁が規制)。英国:ウエスタン・アセット・マネジメント・カンパニーLimited(英金融行動監視機構(FCA)が認可(FRN145930)、規制)。本資料は英国ではFCAが定義する「プロフェッショナルな顧客」のみを対象とした宣伝目的に使用されます。許可された欧州経済領域 (EEA)加盟国へ配信する場合もあります。最新の承認済みEEA加盟国のリストは、ウエスタン・アセット(電話:+44 (0)20 7422 3000)までお問い合わせください。

詳細は当社ウエブサイトwww.westernasset.co.jpをご参照ください。
ウエスタン・アセット・マネジメント株式会社について
業務の種類: 金融商品取引業者(投資運用業、投資助言・代理業、第二種金融商品取引業)
登録番号: 関東財務局長(金商)第427号
加入協会: 一般社団法人日本投資顧問業協会(会員番号 011-01319)
一般社団法人投資信託協会