
US Treasury (UST) yields continue to ratchet higher, defying the economic data and our own expectations. What’s behind the latest move?
The recent surge in UST yields since early August can be attributed to several factors, including hawkish remarks from the Federal Reserve (Fed), an unexpectedly more hawkish dot plot and ongoing market narratives, which we discussed in a recent blog. Another complicating factor affecting the UST market is what we refer to as a “buyers’ strike.” In this context, it reflects the apprehension among potential buyers who are holding back from entering the UST market, waiting for more stability in US interest rates. This group includes current investors already holding positions facing losses, leveraged investors growing increasingly cautious and prospective investors looking to invest but adopting a wait-and-see approach. The prevailing sentiment seems to be, “if I miss the first 10 or 20 basis points of a rally, so be it—yields may still be higher than when I initially considered buying.”
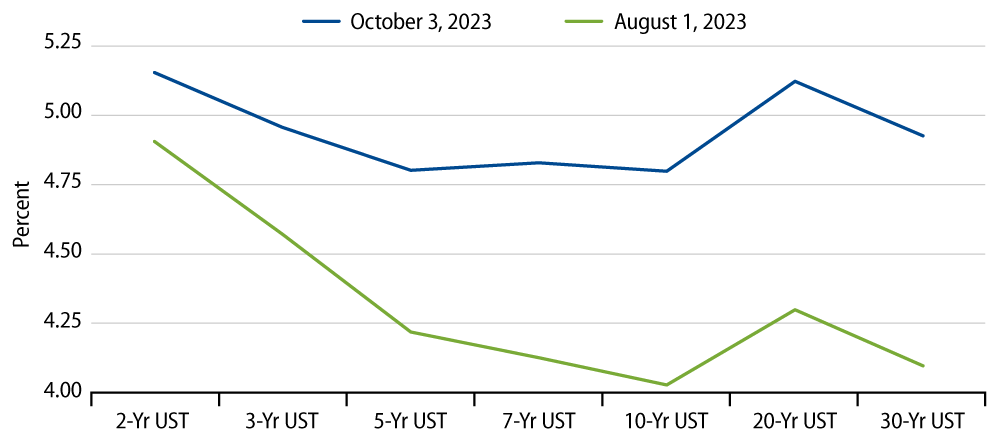
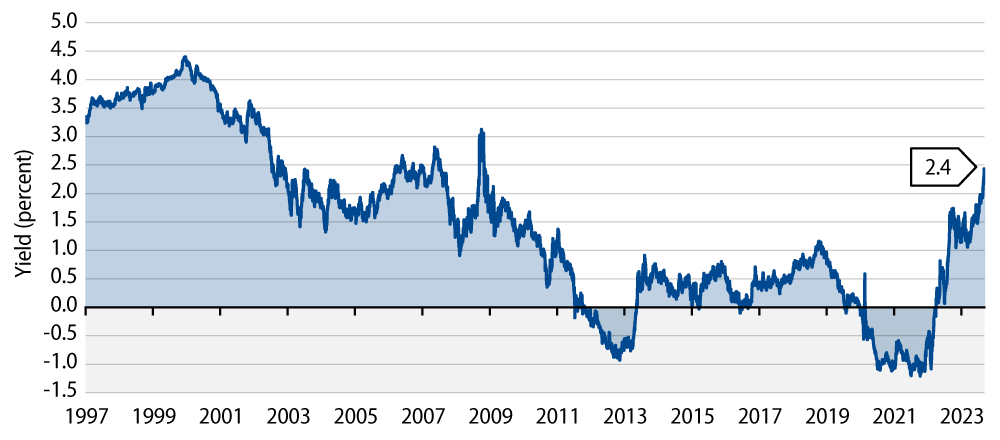
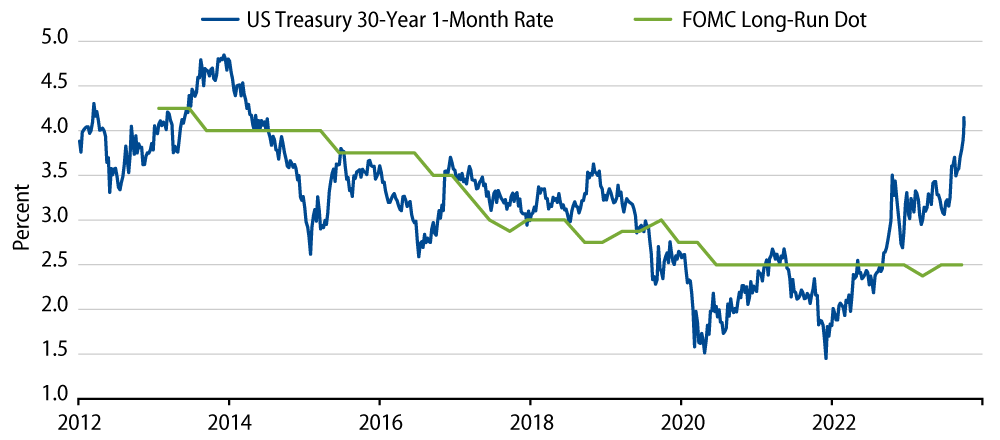
We view this apathy toward US duration as somewhat misplaced. Market pricing has reached extremes, with long-term forward rates currently standing 150 bps above the Fed’s estimate of the neutral rate. Moreover, long-term real rates are hovering around 250 bps, significantly higher than the pre-pandemic levels near zero. While we acknowledge that it can be challenging to determine whether market sentiment is driving the narrative or vice versa, the Exhibit 2 and 3 illustrates that any moderation in the market’s current pricing at the long end of the UST curve could have a notably positive impact on bonds.
Additional factors contributing to the increase in long-term UST yields include the following:
- The “US Exceptionalism” Story: At the start of 2023, there was widespread concern about a looming recession. This sentiment was reinforced during the first quarter by the US regional bank crisis and uncertainty surrounding the debt ceiling. However, market sentiment has now undergone a sharp reversal with pricing reflecting expectations of continuous growth in the foreseeable future. We believe this newfound optimism is out of sync with the recent progress on inflation, which has declined from 5%-6% last year to 2.5%-3% now. We anticipate this trend will persist, especially with signs of a slowdown in the housing and labor market.
Additionally, the outlook for economic growth faces several challenges. Consumers appear fatigued, as they have been tapping into savings as incomes have not kept up, and financial conditions continue to tighten. Furthermore, the Fed’s policy stance is notably restrictive, with the fed funds rate at 5.5% and real rates exceeding 2%. Even if the Fed were to decide to raise rates by another 25 bps later this year, we wouldn’t see it making a significant impact. Monetary policy is already quite tight.
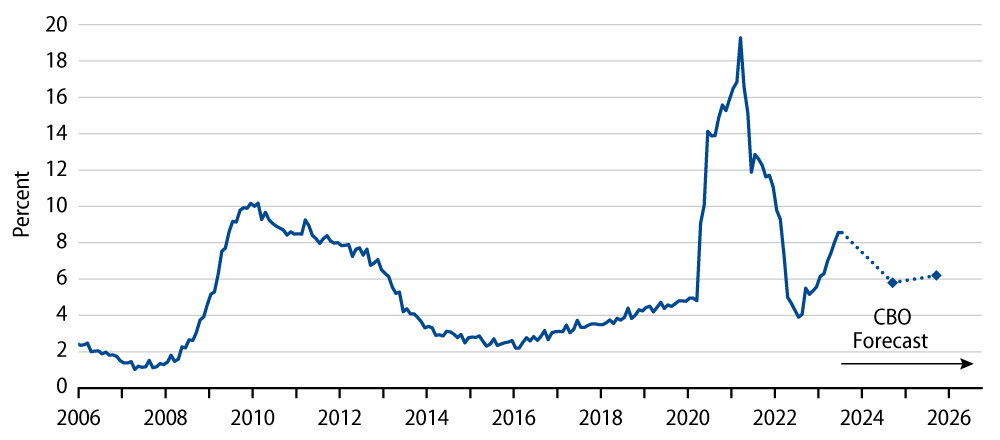
- The Onslaught of UST Supply: The pressure on long-term UST yields began in early August when the US Treasury unexpectedly announced higher and more front-loaded coupon issuance than initially anticipated by the market. Now, the concern revolves around increased UST supply to cover a growing deficit. We would note the increased expenditures from the Inflation Reduction Act, combined with the student loan forgiveness and absence of capital gains tax receipts, have increased the deficit and in concert with the level of Treasury bond issuance. However, next year, all three of these factors should have abated meaningfully as illustrated in Exhibit 4.
- The Geopolitics Angle: Over the years, global savings have flowed into the US due to the US dollar’s (USD) status as the world’s reserve currency. However, there’s a narrative suggesting that these flows are reversing as countries look to reduce their dependency on the USD, diversify reserves, evade US sanctions or take a geopolitical stance against the US. It’s important to remember that the key attributes sought in a reserve currency include economic strength, stability, predictable policies, sound governance and financial depth (i.e., deep, liquid, transparent and open capital markets). The US excels in all of these areas relative to the rest of the world, indicating that de-dollarization or a significant shift away from US assets (e.g., USTs, agencies and corporates) still has a long way to go.
- The Kitchen Sink: Other, less weightier narratives (for now) include convexity-related selling in the mortgage-backed securities market, the cost of carbon transition, de-globalization, the impact of higher yields in other parts of the world reducing foreign demand for USTs and the possibility of a downgrade of the US’ credit rating by Moody’s. Regarding the latter, it’s worth noting that the market’s response to the Fitch downgrade on August 1, 2023 was muted as this had already been telegraphed to the market back in May 2023, and S&P had already downgraded the US back in August 2011.
In Closing
We believe that the abrupt shift in market sentiment from recession to prolonged growth and the prevailing view of a “higher-for-longer” rate environment does not align with the current state of inflation and the various challenges facing economic growth. These include consumer fatigue, tightening financial conditions and restrictive monetary policy. Our view is that both growth and inflation trends will continue to moderate, and we anticipate that Fed officials will take note of these ongoing developments when they convene again in November.